Kuo, Y. - F. and Chen, P. -C. (2008), Constructing performance appraisal indicators for mobility of the service industries using fuzzy Delphi method, Expert Systems with Applications, 35(4), pp. 1930-1939.
Constructing Performance Appraisal Indicators for Mobility of the Service Industries Using Fuzzy Delphi Method
Abstract
Based on the four perspectives of the balanced scorecard, including the financial, customer, internal process, and learning and growth perspectives, this study applied Fuzzy Delphi Method to construct key performance appraisal indicators for mobility of the service industries. The constructed indicators could serve as a reference for the service industries to establish applicable performance appraisal indicators according to the properties of the each industry after mobility is introduced. The research findings showed that cost control, profit growth, and sales growth are the top three indicators in the financial perspective, while service/product quality, customer satisfaction, and service timing are the three major indicators in the customer perspective. In the internal process perspective, information delivery, standard operation procedure, and interactions between staffs and clients are most valued. In the learning and growth perspective, corporate image, competitiveness, and employee satisfaction are most emphasized among various service industries.
Keywords: Mobile Commerce; Balanced Scorecard; Fuzzy Delphi Method; Performance Appraisal
1. Introduction
With the thriving development of global wireless communication and the record-breaking prevalence of mobile phones, Internet users are no longer subject to the traditional wired environments. The integration of wireless communication and mobile Internet services has been considered as one of the most promising investments, and mobile commerce is even a focus of various industries. Many industries have perceived that although e-enterprise allows employees to access the Internet at anytime, enhance work efficiency, and reduce cost, it is unable to satisfy external staffs that need to spend most of their working hours on attending meetings or visiting customers. They are unable to connect to the Internet anywhere and access the company database to retrieve important data instantly. Due to the inconvenience of the Internet access, many enterprises have perceived the
importance of mobility, and that is the reason why mobile Internet has been gradually paid attention to. Because of the immeasurable development potential of mobile commerce, some enterprises have already introduced mobile commerce applications for employees to accomplish more tasks in a shorter time. Mobile commerce allows them to work away from office, achieve a balance between work and life, enhance their satisfaction with the enterprise, and promote their loyalty and cohesion. Thus, enterprise mobility is not merely about constructing a convenient network access environment. It can increase productivity, investment return rate, and reduce cost. It can also benefit employee’s work quality.
For enterprises, performance appraisal helps them diagnose whether the adopted strategy and organizational structure will help them achieve their goals. And the construction of performance appraisal indicators is also the first step for enterprises to conduct practical evaluations. In the era of new economy, enterprises must go through the transition from traditional performance appraisal systems to strategic performance appraisal systems. By integrating performance appraisal systems with strategies as well as integrated and global perspectives, enterprises are able to find out their competitiveness and the direction for improvement. The Balanced Scorecard is a strategic management tool in the era of knowledge economy (Niven, 2002). It not only links organizational strategies, structures, and prospects but also combines traditional and strategic performance appraisal indicators. Thus, enterprises can transform long-term strategies and innovative customer values into substantive activities inside and outside the organization (Chen, et al. 2002). Despite a number of ways to filter performance appraisal criteria, not many enterprises in Taiwan have introduced mobile commerce, and the extraction of large samples is not easy. However, Fuzzy Delphi Method requires only a small number of samples and the derived results are objective and reasonable. It saves time and cost required for collecting expert opinions, and experts opinions will also be sufficiently expressed without being distorted (Hsu & Yang, 2000). Thus, this study uses Fuzzy Delphi Method as the main selection model for performance indicators.
Currently in Taiwan, mobility is mainly introduced to service industries, and better results have been observed in the consulting, real estate brokerage, retail, hospitality, banking, insurance, medical, and logistic industries. As a result, this study uses the four perspectives of the balanced scorecard, namely financial, customer, internal process, and learning and growth perspectives, as the perspectives for the performance appraisal of mobility. Through Fuzzy Delphi Method, the key indicators can be derived for the various service industries after the introduction of mobility. The research results can be provided as a reference for enterprises to construct performance appraisal indicators after mobility is introduced. Besides, from the
perspectives of the balanced scorecard, mobile commerce system developers can develop systems that comply with the demands of enterprises according to the characteristics and strategic goals of various industries.
2. Literature Review 2.1 Enterprise Mobility
Enterprise mobility can be logically viewed as an extension of e-business (Kalakota & Robinson, 2001). Through wireless communication protocols, people can use mobile devices to manage business process activities at anytime anywhere, so as to reduce cost, save time, and enhance the efficiency of business process management. Besides, they can also have closer and real-time interactions with clients, business partners, and upstream/downstream industries (Tsalgatidou & Pitoura, 2001; Tarasewich & Nickerson, 2002). The main benefit is that users can use mobile commerce services through mobile devices to retrieve desired information and satisfy consumer’s demands at anytime and anywhere.
The applications of enterprise mobility include Internet-based services and applications developed exclusively for mobile environments. If classified by application targets, these applications can be roughly divided into business to business (B2B), business to employee (B2E), and business to consumer (B2C) (Kalakota & Robinson, 2001; Siau et al., 2001). B2E is mainly about real-time management. For instance, employees can use mobile devices and wireless systems to retrieve internal resources of the enterprise, such as notice information and business progress. Therefore, employees working outside the office do not need to delay their work because they are away from office. Of course, information sharing (such as online learning and knowledge management) is also an important function of B2E applications. As to B2B applications, most enterprises focus more on real-time information collection (Varshney & Vetter, 2002). For instance, enterprises can use mobile devices at each retail point or terminal point to transmit instant information, including sale, return, or stock information, so that the interactions between enterprises and manufacturers can always maintain updated. Finally, the target of B2C applications is consumer. They are mainly applied in mobile banking services, mobile shopping, mobile advertisement, mobile information service, mobile entertainment/mobile video, and transportation guidance (Clarke, 2001; Kalakota & Robinson, 2001; Siau et al., 2001; Varshney & Vetter, 2002).
2.2 Performance Appraisal and the Balanced Scorecard
goals (Robbins, 1990), and the goals of enterprise activities are to enhance business performance. As to the indicators of business performance, financial performances, such as return on investment, sales income, and profitability, were usually adopted by researchers as indicators of performance appraisal in early years (Van De Ven and Ferry, 1980). But Galbraith and Schedel (1983) pointed out that performance appraisal indicators cannot be determined from a single perspective. The scope and perspectives involved are very complicated and extensive, and many expected goals are included. Venkatraman and Ramanujam (1986) proposed performances of three areas, including financial performance, operational performance, and organizational effectiveness. Kaplan and Norton (1992) proposed the balanced scorecard to integrate financial and non-financial indicators for the performance appraisal system, so that enterprise strategies could be substantively put into action to create competitive advantages. The object and measures of the balanced scorecard are derived from organizational prospects and strategies. It not only preserves the traditional indicators in the financial perspective to measure tangible assets but also incorporate indicators in the customer, internal process, learning and growth perspectives to measure intangible assets or intelligence capital. It is stressed that enterprise strategies should be evaluated from financial and non-financial perspectives, and data completeness and extensive evaluations are important. Thus, it can be viewed as a comprehensive performance appraisal tool (Pinero, 2002; Lawrie & Cobbold, 2004). Besides, Figge et al. (2002) and Dias-Sardinhaet et al. (2002) also conceived that enterprises could use the balanced scorecard to select and develop environmental performance appraisal and include environmental goals in the execution of strategies, so that it can be a tool of environmental strategy management.
The multiple indicators of the balanced scorecard can not only increase the comprehensiveness and objectivity, but also improve the weakness of a single indicator. Thus, based on the four perspectives of the balanced scorecard, namely financial, customer, business internal process, and learning and growth perspectives, this study refers to the performance appraisal indicators for the introduction of information technology, e-commerce, and e-enterprise to compile the performance appraisal perspectives and indicators for the introduction of mobility as shown in Table 1.
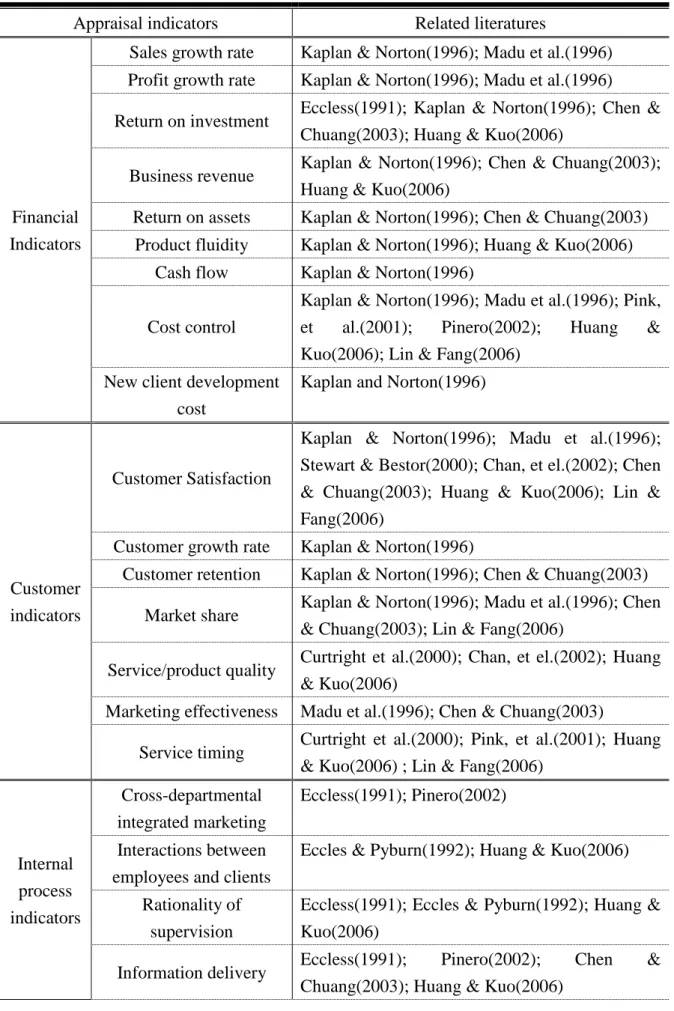
Table 1 An organized list of indicators in this study
Appraisal indicators Related literatures
Financial Indicators
Sales growth rate Kaplan & Norton(1996); Madu et al.(1996) Profit growth rate Kaplan & Norton(1996); Madu et al.(1996) Return on investment Eccless(1991); Kaplan & Norton(1996); Chen &
Chuang(2003); Huang & Kuo(2006)
Business revenue Kaplan & Norton(1996); Chen & Chuang(2003); Huang & Kuo(2006)
Return on assets Kaplan & Norton(1996); Chen & Chuang(2003) Product fluidity Kaplan & Norton(1996); Huang & Kuo(2006)
Cash flow Kaplan & Norton(1996)
Cost control
Kaplan & Norton(1996); Madu et al.(1996); Pink, et al.(2001); Pinero(2002); Huang & Kuo(2006); Lin & Fang(2006)
New client development cost
Kaplan and Norton(1996)
Customer indicators
Customer Satisfaction
Kaplan & Norton(1996); Madu et al.(1996); Stewart & Bestor(2000); Chan, et el.(2002); Chen & Chuang(2003); Huang & Kuo(2006); Lin & Fang(2006)
Customer growth rate Kaplan & Norton(1996)
Customer retention Kaplan & Norton(1996); Chen & Chuang(2003) Market share Kaplan & Norton(1996); Madu et al.(1996); Chen
& Chuang(2003); Lin & Fang(2006)
Service/product quality Curtright et al.(2000); Chan, et el.(2002); Huang & Kuo(2006)
Marketing effectiveness Madu et al.(1996); Chen & Chuang(2003)
Service timing Curtright et al.(2000); Pink, et al.(2001); Huang & Kuo(2006) ; Lin & Fang(2006)
Internal process indicators Cross-departmental integrated marketing Eccless(1991); Pinero(2002) Interactions between employees and clients
Eccles & Pyburn(1992); Huang & Kuo(2006)
Rationality of supervision
Eccless(1991); Eccles & Pyburn(1992); Huang & Kuo(2006)
Information delivery Eccless(1991); Pinero(2002); Chen & Chuang(2003); Huang & Kuo(2006)
Standard operation procedure
Eccles(1991); Curtright et
al.(2000); Pinero(2002); Huang & Kuo(2006) Goal achievement rate Eccless(1991); Chow & Haddad(1997); Huang &
Kuo(2006) Learning and growth indicators Employee productivity
Kaplan & Norton(1996); Curtright et al.(2000); Pink et al.(2001); Chen & Chuang(2003); Huang & Kuo(2006)
Employee satisfaction Madu et al.(1996); Curtright et al.(2000); Stewart & Bestor(2000)
Reduction of employee fluidity
Eccless(1991); Eccles & Pyburn(1992)
Number of employee trainings
Eccles & Pyburn(1992); Chow & Haddad(1997)
Employee professionalism
Curtright et al.(2000); Chan et el.(2002)
Employee innovation Chen & Chuang(2003)
Management level Eccless(1991); Eccles & Pyburn(1992) Communication channel Eccless(1991); Pinero(2002)
Corporate image Chen & Chuang(2003) Establishment of a
learning-oriented organization
Chen & Chuang(2003); Huang & Kuo(2006)
Competitiveness Madu et al.(1996); Huang & Kuo(2006)
2.3 Fuzzy Delphi Method
The traditional Delphi Method has always suffered from low convergence expert opinions, high execution cost, and the possibility that opinion organizers may filter out particular expert opinions. Murry et al. (1985) thus proposed the concept of integrating the traditional Delphi Method and the fuzzy theory to improve the vagueness and ambiguity of Delphi Method. Membership degree is used to establish the membership function of each participant. Ishikawa et al. (1993) further introduced the fuzzy theory into the Delphi Method and developed Max-Min and Fuzzy Integration algorithms to predict the prevalence of computers in the future. However, this method is only applicable to the prediction of time series. Besides, Hsu & Yang (2000) applied Triangular Fuzzy Number to encompass expert opinions and establish the Fuzzy Delphi Method. The max and min values of expert opinions are taken as the two terminal points of triangular fuzzy numbers, and the geometric mean is taken as the membership degree of triangular fuzzy numbers to derive the statistically unbiased
effect and avoid the impact of extreme values. This method may create a better effect of criteria selection. It features the advantage of simplicity, and all the expert opinions can be encompassed in one investigation. The similarities and differences between this Fuzzy Delphi Method and the traditional Delphi Method are listed as follows: 1. Both methods are intended to collect the group decision of expert opinions. 2. The traditional Delphi Method requires multiple investigations to achieve the
consistency of expert opinions, but the new Fuzzy Delphi Method requires only one investigation and all the opinions can be covered.
3. In the traditional Delphi Method, experts are required and forced to modify their opinions so as to meet the mean value of all the expert opinions. If their opinions are not modified, they may be excluded. Thus, it is possible that useful information may be lost. The new Fuzzy Delphi Method respects the original opinions of all the experts. It gives a different membership degree for each possible consensus.
4. The traditional Delphi Method requires a considerable time for collecting expert opinions. The cost is high, and the fuzziness in the process cannot be excluded. The new Fuzzy Delphi Method does not have the above-mentioned weaknesses. To sum up, the main advantage of the Fuzzy Delphi Method for collecting group decision lies in that every expert opinion will be considered and integrated to achieve the consensus of group decisions. In addition to fuzzy parts in human thinking, uncertain and subjective messages can also be induced. Moreover, it reduces the times of investigation and the consumption of cost and time.
3. Methodology
3.1 Questionnaire Design
Questionnaire survey was the main research tool in this study. Based on the balanced scorecard, the primary questionnaire was designed with reference to related literatures and interviews with experts and providers of mobility systems. After the primary questionnaire was completed, five experts in related areas were invited to take the pre-test and modify unclear questions. Questions were added, edited, or deleted according to their appropriateness for the purpose of increasing the convergence of survey questions. The questionnaire was divided into two sections. The first section was about the importance of performance appraisal indicators, and a 1-10 point scale was used. A higher point indicated a higher importance. The second section was about the basic data and industry type of the interviewed enterprise.
3.2 Sampling method
The research population was the service industries with mobility introduced. Due to the service industries encompass a wide range of industry types, industries with a wider scale of mobility were selected, including consulting, real estate brokerage, retail, hospitality, banking, insurance, medical, and logistic industries, and quota sampling was adopted. The survey subjects were supervisors who have participated or cooperated in the introduction of enterprise mobility. They were contacted and informed in advance of the intention of the survey. Questionnaires were distributed after consent was obtained. The researcher would inquire them about the progress and provide trouble-shooting assistance via the phone, in order to increase the response rate and the accuracy of results. At last, a total of 50 questionnaires (1 for each enterprise) were distributed, and 31 returned were valid. The valid response rate was 62%.
3.3 Selection of Appraisal Indicators
In the selection of appraisal indicators, the Fuzzy Delphi Method proposed by Hsu and Yang (2000) was adopted in this study to denote expert consensus with geometric means. The process is demonstrated as follows:
(1) Organize expert opinions collected from questionnaires into estimates, and create the triangular fuzzy number T~A as follows:
) , , ( ~ A A A A L M U T = ) min( Ai A X L = n n i Ai A X M
∏
= = 1, i denotes the ith expert, i=1, 2,…,n
) max( Ai
A X
U = where, XAi indicates the appraisal value of the ith expert for criterion A;
A
L indicates the bottom of all the experts’ appraisal value for criterion A; A
M indicates the geometric mean of all the experts’ appraisal value for criterion A; A
U indicates the ceiling of all the experts’ appraisal value for criterion A. (2) Selection of appraisal indicators
In this study, the geometric mean MA of each indicator’s triangular fuzzy number was used to denote the consensus of the expert group on the indicator’s appraisal value, so that the impact of extreme values could be avoided. For the threshold value r, the 80/20 rule was adopted with r set as 8. This indicated that among the factors for selection, “20% of the factors account for an 80% degree of
importance of all the factors”. The selection criteria were: If MA≥ r= 8, this appraisal indicator is accepted;
If MA< r =8, this appraisal indicator is rejected.
4. Research Results
After fuzzy estimation, the fuzzy number of each appraisal indicator is shown in the appendix. According to different industry types, the more influential indicators and appraisal consensuses are listed in Table 2 to Table 5.
It can be seen from Table 2 that cost control, sales growth rate, and profit growth rate in the financial perspective are the top three indicators among all the service industries. This result is mainly attributed to the ubiquity of mobility that provides real-time information for enterprise employees and customized services for them to obtain the first-hand data from the enterprise or clients without doing any paper works. Unnecessary expenditure can be saved. Customers can also feel the professionalism and commitment of service people, so they will have a higher purchasing intention. As cost control and profit are usually the factors that enterprises consider before they introduce mobility, whether the introduction will bring expected benefits is a focus of enterprises. Return on assets is not considered as an important evaluation item by all the industries. This is probably because some industries have not completely introduced mobility and introduced it only into certain departments depending on necessity. Thus, its benefit requires a long-term test and is relatively less emphasized. The consulting and insurance industries have the most key appraisal indicators selected, while the banking, medical, and logistics industries have the fewest items. For the consulting industry, profit rate, product fluidity, and new customer development cost have a higher degree of importance, while cost control, cash flow, and return on assets have a lower degree. For the insurance industry, sales growth rate, product fluidity, and sales revenue are most valued, while new customer development cost, return on investment, and return on assets are less stressed. For the banking industry, only cost control and profit growth rate are listed as key evaluation items. The medical industry has cost control and sales revenue listed, and the logistics industry also has cost control and sales revenue listed.
Table 2 The appraisal consensuses of each service industry on financial indicators Industry types
Key indicators
Consulting Real estate brokerage
Retail Hospitality Banking Insurance Medical Logistics
Evaluation items of financial indicators
Sales growth rate 8.94 8.34 8.43 8.65 7.90 9.59 2.88 5.01
Profit growth rate 9.74 8.09 7.42 8.65 8.68 8.59 3.56 5.04
Return on investment 8.43 8.34 6.82 6.21 6.82 5.50 3.91 5.01 Business revenue 8.91 8.12 7.97 7.96 7.54 8.98 8.65 8.96 Return on assets 4.68 4.79 5.73 6.95 3.56 4.74 3.91 6.80 Product fluidity 9.21 6.52 8.97 7.65 7.54 9.39 2.00 6.35 Cash flow 6.22 3.47 6.62 6.54 6.59 8.11 3.63 6.95 Cost control 6.77 3.47 8.68 8.32 8.91 8.96 8.96 9.28
New client development
cost 9.21 5.67 6.48 4.58 7.97 7.33 2.62 3.63
It can be discovered from Table 3 the top three indicators among customer indicators are service/product quality, customer satisfaction, and service timing. This result is mainly attributed to the customization of mobility systems. In order to satisfy customers, providing fast and customized services has become the priority goal for the service industries. It allows customers to feel the efficiency and commitment of the service industries. That is why the afore-mentioned indicators are most valued by enterprises. For the consulting and insurance industries, all the items have reached the selection criterion, but for the retail industry, only customer satisfaction, service/product quality, and marketing effectiveness are more paid attention to.
Table 3 The appraisal consensuses of each service industry on customer indicators Industry types
Key indicators
Consulting Real estate brokerage
Retail Hospitality Banking Insurance Medical Logistics
Evaluation items of customer indicators
Customer Satisfaction 8.97 9.17 8.91 8.96 7.67 9.39 9.32 9.65
Customer growth rate 9.21 7.53 7.09 9.65 9.21 8.96 8.32 8.24
Customer retention 8.43 8.39 7.00 8.24 7.71 8.36 8.65 7.88
Market share 8.18 7.76 6.45 7.65 8.24 8.54 7.32 8.96
Service/product quality 9.49 8.98 8.91 9.65 9.49 9.17 9.65 9.32
Marketing effectiveness 8.43 8.56 8.21 8.32 8.35 9.17 3.91 2.88
Service timing 9.24 8.54 7.91 9.65 8.97 9.36 8.32 8.65
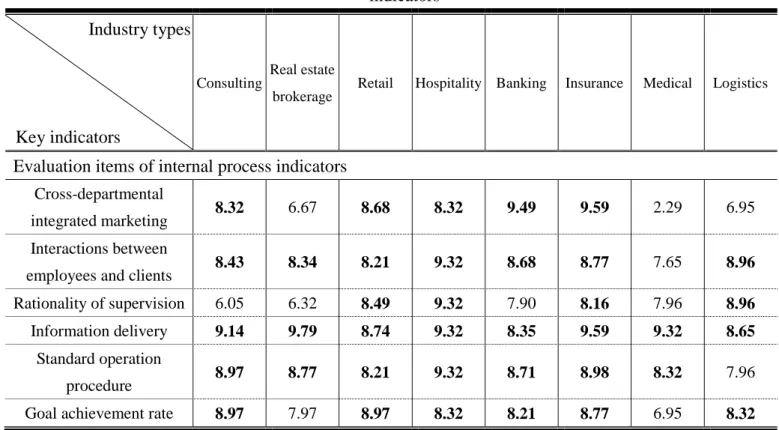
Among the internal process indicators, it can be discovered from Table 4 that information delivery, interaction between employees and clients, and standard operation process are the top three items concerned by all the industries. This result is mainly attributed to the ubiquity and two-way communication of mobility systems. Employees are able to provide instant services to satisfy customer’s volatile demands, and enterprises can also deliver information necessary to employees so as to satisfy their business needs. Employees can also use this system to have real-time discussions. Besides, due to the convenience of mobility, it is necessary to beware of information leakage. Thus, a standard operation procedure is required for system management. For the retail, hospitality, and insurance industries, almost all the items in this perspective are critical, so all the key indicators are selected. This indicates that the retail and hospitality industries pay more attention to the convenience for shopping, and they will introduce mobility to provide faster query and purchasing services. For the medical industry, only information delivery and standard operation procedure are selected.
Table 4 The appraisal consensuses of each service industry on internal process indicators Industry types Key indicators
Consulting Real estate brokerage
Retail Hospitality Banking Insurance Medical Logistics
Evaluation items of internal process indicators
Cross-departmental
integrated marketing 8.32 6.67 8.68 8.32 9.49 9.59 2.29 6.95
Interactions between
employees and clients 8.43 8.34 8.21 9.32 8.68 8.77 7.65 8.96
Rationality of supervision 6.05 6.32 8.49 9.32 7.90 8.16 7.96 8.96
Information delivery 9.14 9.79 8.74 9.32 8.35 9.59 9.32 8.65
Standard operation
procedure 8.97 8.77 8.21 9.32 8.71 8.98 8.32 7.96
Goal achievement rate 8.97 7.97 8.97 8.32 8.21 8.77 6.95 8.32
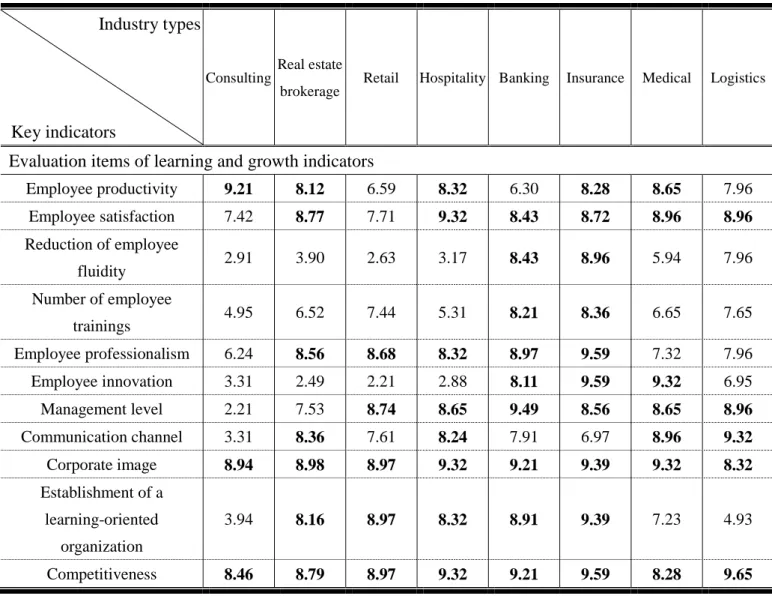
Among the learning and growth indicators, it is revealed on Table 5 that corporate image, competitiveness, and employee satisfaction are most valued by service industries. Generally, enterprises introduce innovative technologies to enhance their competitiveness and corporate image. Thus, most of the enterprises are also concerned whether the introduction of mobility will bring expected effects, and whether customers and employees will feel satisfied with a more balanced work and life after the introduction of mobility. In terms of industry types, except the communication channel, all the other items are selected in the insurance industry. It is the industry that has the most indicators selected. For the consulting industry, only employee productivity, corporate image, and competitiveness are selected as the key indicators.
Overall, every industry has different key indicators. Currently, the insurance industry has been developed into a service industry of virtual offices, and each employee can be viewed as a branch company. Thus, in addition to the large difference of customer’s demand and the fast query service, they also need to pay attention to self-growth. As a result, many indicators in the four perspectives are valued by supervisors. The consulting industry mainly provides transformation or reform guidance and assistance to enterprises. The required mobility items are mostly related to cost reduction and customer satisfaction. Due to a larger difference among customer demands, the indicators valued by this industry usually fall in the
financial, customer, and internal process indicators.
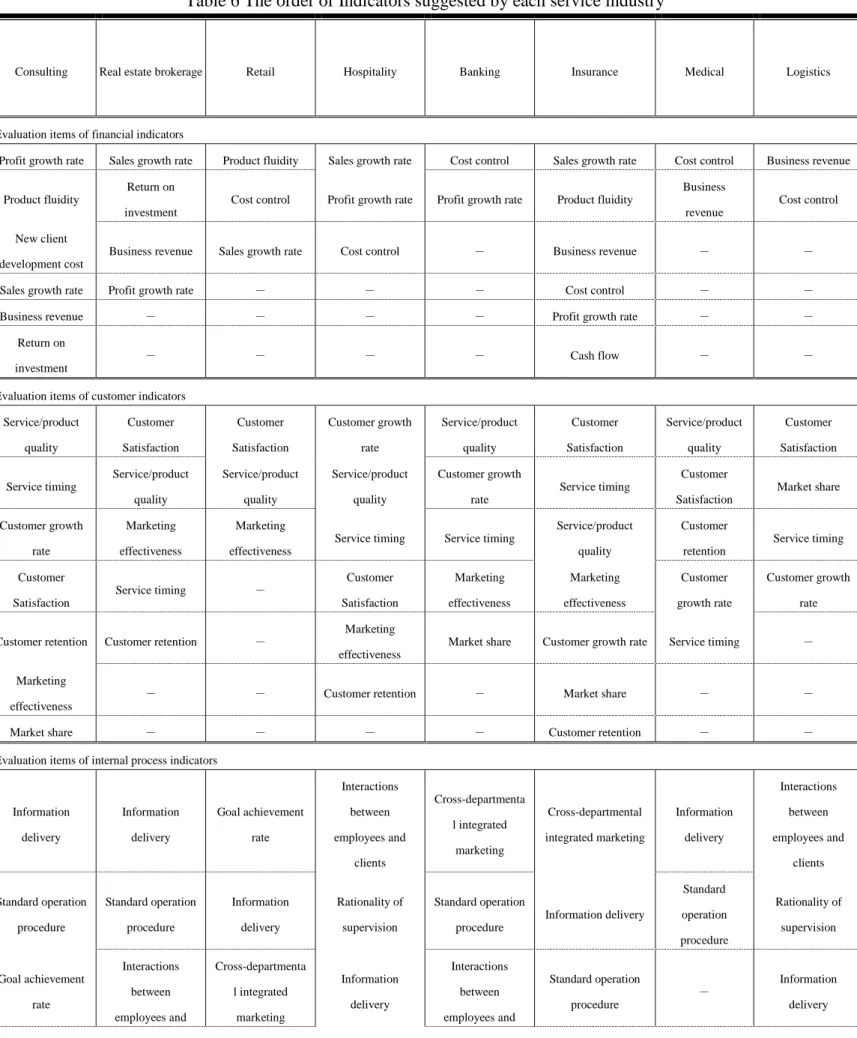
This study further lists the indicators of each perspective by the degree of importance suggested by each service industry in Table 6, which serves as a reference for performance appraisal after the introduction of mobility. Besides, mobility system designers will also be able to understand the items critical to each industry, so that they can design systems that meet the practical demands of each industry.
Table 5 The appraisal consensuses of each service industry on learning and growth indicators
Industry types
Key indicators
Consulting Real estate brokerage
Retail Hospitality Banking Insurance Medical Logistics
Evaluation items of learning and growth indicators
Employee productivity 9.21 8.12 6.59 8.32 6.30 8.28 8.65 7.96 Employee satisfaction 7.42 8.77 7.71 9.32 8.43 8.72 8.96 8.96 Reduction of employee fluidity 2.91 3.90 2.63 3.17 8.43 8.96 5.94 7.96 Number of employee trainings 4.95 6.52 7.44 5.31 8.21 8.36 6.65 7.65 Employee professionalism 6.24 8.56 8.68 8.32 8.97 9.59 7.32 7.96 Employee innovation 3.31 2.49 2.21 2.88 8.11 9.59 9.32 6.95 Management level 2.21 7.53 8.74 8.65 9.49 8.56 8.65 8.96 Communication channel 3.31 8.36 7.61 8.24 7.91 6.97 8.96 9.32 Corporate image 8.94 8.98 8.97 9.32 9.21 9.39 9.32 8.32 Establishment of a learning-oriented organization 3.94 8.16 8.97 8.32 8.91 9.39 7.23 4.93 Competitiveness 8.46 8.79 8.97 9.32 9.21 9.59 8.28 9.65
Table 6 The order of Indicators suggested by each service industry
Consulting Real estate brokerage Retail Hospitality Banking Insurance Medical Logistics
Evaluation items of financial indicators
Profit growth rate Sales growth rate Product fluidity Sales growth rate Cost control Sales growth rate Cost control Business revenue
Product fluidity
Return on investment
Cost control Profit growth rate Profit growth rate Product fluidity
Business revenue
Cost control
New client development cost
Business revenue Sales growth rate Cost control - Business revenue - -
Sales growth rate Profit growth rate - - - Cost control - -
Business revenue - - - - Profit growth rate - -
Return on investment
- - - - Cash flow - -
Evaluation items of customer indicators Service/product quality Customer Satisfaction Customer Satisfaction Customer growth rate Service/product quality Customer Satisfaction Service/product quality Customer Satisfaction Service timing Service/product quality Service/product quality Service/product quality Customer growth rate Service timing Customer Satisfaction Market share Customer growth rate Marketing effectiveness Marketing effectiveness
Service timing Service timing
Service/product quality Customer retention Service timing Customer Satisfaction
Service timing - Customer Satisfaction Marketing effectiveness Marketing effectiveness Customer growth rate Customer growth rate
Customer retention Customer retention - Marketing effectiveness
Market share Customer growth rate Service timing -
Marketing effectiveness
- - Customer retention - Market share - -
Market share - - - - Customer retention - -
Evaluation items of internal process indicators
Information delivery Information delivery Goal achievement rate Interactions between employees and clients Cross-departmenta l integrated marketing Cross-departmental integrated marketing Information delivery Interactions between employees and clients Standard operation procedure Standard operation procedure Information delivery Rationality of supervision Standard operation procedure Information delivery Standard operation procedure Rationality of supervision Goal achievement rate Interactions between employees and Cross-departmenta l integrated marketing Information delivery Interactions between employees and Standard operation procedure - Information delivery
clients clients Interactions between employees and clients - Rationality of supervision Standard operation procedure Information delivery Interactions between employees and clients - Goal achievement rate Cross-departmenta l integrated marketing - Interactions between employees and clients Cross-departmenta l integrated marketing Goal achievement rate Goal achievement rate - - - - Standard operation procedure Goal achievement rate - Rationality of supervision - -
Evaluation items of learning and growth indicators
Corporate image Corporate image Corporate image
Employee satisfaction Communication channel Employee professionalism Employee innovation Competitiveness Employee productivity Competitiveness Establishment of a learning-oriented organization
Corporate image Corporate image Employee innovation Corporate image
Communication channel
Competitiveness
Employee satisfaction
Competitiveness Competitiveness Competitiveness Competitiveness
Employee satisfaction Employee satisfaction - Employee professionalism
Management level Management level
Employee professionalism Corporate image Communication channel Management level - Communication channel Employee professionalism Employee productivity Establishment of a learning-oriented organization Establishment of a learning-oriented organization Employee productivity Corporate image - Establishment of a learning-oriented organization - Employee professionalism Employee satisfaction Reduction of employee fluidity Management level - - Employee productivity - Establishment of a learning-oriented organization Reduction of employee fluidity Employee satisfaction Competitiveness - - - - Communication channel Number of employee trainings Management level - - - - - - Employee innovation Number of employee trainings - - - - - - - Employee productivity - -
5. Conclusions
When enterprises introduce new technologies, they always place the focus on how much they can be benefited by the new technologies. Thus, establishing a set of objective performance appraisal indicators will be their priority task. This study applied modified Fuzzy Delphi Method to construct performance appraisal indicators for service industries after mobility is introduced. The experiences from other enterprises in the same industry are expected to produce substantive benefits from the dominance over appraisal indicators and further reduce the risks of introduction. The research findings showed that cost control, profit growth rate, and sales growth rate in the financial perspective are the indicators most valued by all the service industries. The consulting and insurance industries are the two industries with most performance appraisal indicators selected, while the banking, medical, and logistics industries have the fewest. In the customer perspective, the most important indicators are service/product quality, customer satisfaction, and service timing. In the consulting and insurance industries, all the indicators have passed the selection criterion. The retail industry has the fewest indicators selected. In the internal process perspective, information delivery, standard operation procedure, and interaction between employee and clients are more emphasized by every industry. The retail, hospitality, and insurance industries put a strong emphasis on the indicators in this perspective, as all the key indicators have been selected. However, the medical industry has the fewest items selected. In the learning and growth perspective, corporate image, competitiveness, and employee satisfaction are most valued by service industries. The insurance industry has the most key indicators selected, while the consulting industry has the fewest.
It can be discovered that some indicators were eliminated. But, the main reason is that interviewed experts had different focuses on the benefits of the introduction of mobility. A larger difference in the appraisal scores was resulted, so the indicators had to be excluded. However, this study proposed a conceptual structure based on literature reviews, and the structure may not perpetually the same. Organizations can add/remove appraisal indicators according to their practical demands and the needs of enterprises. This study applied sampling method on enterprises with mobility introduced, so not every enterprise could be covered. Besides, due to the limitation of time and inconvenience of data acquisition, only the data of a subjective questionnaire could be used in the analysis. Moreover, the respondents may not have sufficient understanding of each question. Even if they were informed of the intention and use of the survey in advanced, some biases of the survey results could still exist. Therefore, our analysis may be insufficient. Due to insufficient human resource and time and other objective factors, only the enterprises in the service
industries with mobility introduced were extracted as research samples. It was suggested that follow-up studies may take other industries as research subjects and expand the investigation for an in-depth research, so that the results will be more comprehensive and applicable to other industries.
References
Chan, Y. K., Gaffney, P., Neailey, K., & Ip, W. H. (2002). Achieving breakthrough performance improvement: Results of implementing a fit-for-purpose total management. The TQM Magazine, 14(5), 293-296.
Chen, C. T., & Chuang, S. P. (2003). A Study on performance evaluation model of electronic business. Journal of Management and Systems, 10(1), 41-58.
Chow, W. C., & Haddad, M. (1997). Applying the balanced scorecard to small companies. Management Accounting, 79(2), 221-227.
Curtright, J. W., Stolp-Smith, S. C., & Edell, E. S. (2000). Strategic performance management: Development of a performance measurement system at the Mayo clinic. Journal of Healthcare Management, 45(1), 58-68.
Dias-Sardinha, I., Reilnders, L., & Antunes, P. (2002). From environmental performance evaluation to eco-efficiency and sustainability balanced scorecard. Environmental Quality Management, 12(2), 51-64.
Eccless, R. G. (1991). The performance measurement manifests. Harvard Business Review, 69(2), 131-137.
Eccles, R. G., & Pyburn, P. F. (1992). Creating a comprehensive system to measure performance. Management Accounting, 74(1), 41-44.
Figge, F., Hahn, T., Schaltegger, S., & Wagner, M. (2002). The sustainability balanced scorecard-linking sustainability management to business strategy. Business Strategy and the Environment, 11(5), 269-284.
Frankel, E. G. (1990). Management of Technological Change. New York: Kluwer. Galbraith, C., & Schedel, D. E. (1983). An empirical analysis of strategy types.
Strategic Management Journal, 4(2), 153-173.
Hsu, T. H., & Yang, T. H. (2000). Application of fuzzy analytic hierarchy process in the selection of advertising media. Journal of Management and Systems, 7(1), 19-39. Huang, Y. S., & Kuo, M. H. (2006). An Empirical Case Study for ERP
Implementation in Conventional Industry. Journal of e-Business, 8(1), 65-100. Ishikawa, A., Amagasa, M., Shiga, T., Tomizawa, G., Tatsuta, R., & Mieno, H.
(1993). The max-min Delphi method and fuzzy Delphi method via fuzzy integration. Fuzzy Sets and Systems, 55(3), 241-253.
Kalakota, R., & Robinson, M. (2001). M-Business: The Race to Mobility. New York: McGraw-Hill.
Kaplan, S. R., & Norton, D. P. (1992). The balanced scorecard measures that drive performance. Harvard Business Review, 70(1), 71-79.
Kaplan, R. S., & Norton, D. P. (1996). Using the balanced scorecard as a strategic management system. Harvard Business Review, 74(1), 75-85.
Lawrie, G., & Cobbold, I. (2004) Third-generation balanced scorecard: Evolution of an effective strategic control tool. International Journal of Productivity and Performance Management, 53(7), 611-623.
Lin, L. Y., & Fang, Y. P. (2006). The impact of mobile commerce application on corporate performance: Moderate effect of market-orientation-- An example of logistic related industry in Taiwan. Journal of e-Business, 8(2), 271-294.
Madu, C. N., Kuei, C. H., & Jacob, R. A. (1996). An empirical assessment of the influence of quality dimension on organizational performance. International Journal of Production Research, 34(7), 1943-1962.
Murry, T. J., Pipino, L. L., & Gigch, J. P. (1985). A pilot study of fuzzy set modification of Delphi. Human Systems Management, 5(1), 76-80.
Niven, P. R. (2002). Balanced Scorecard Step-by-Step: Maximizing Performance and Maintaining Results. New York: John Wiley and Sons.
Pinero, C. J. (2002). The balanced scorecard: An incremental approach model to health care management. Journal of Health Care Finance, 28(4), 69-80.
Pink, G. H., McKillop, I., Schraa, E. G., Preyra, C., Montgomery, C., & Baker, G. R. (2001). Creating a balanced scorecard for a hospital system. Journal of Health Care Finance, 27(3), 1-20.
Robbins, S. P., (1990). Organization Theory: Structure, Design, and Application. Englewood Cliffs: Prentice-Hall.
Siau, K., Lim, E. P., & Shen, Z. (2001). Mobile commerce: Promises, challenges, and research agenda. Journal of Database Management, 12(3), 4-13.
Stewart, L. J., & Bestor, W. E. (2000). Applying a balanced scorecard to health care organizations. The Journal of Corporate Accounting and Finance, 11(3), 75-82. Tarasewich, P., Nickerson, R. C., & Warkentin, M. (2002). Issues in mobile
e-commerce. Communications of the Association for Information Systems, 8, 41-64.
Van de Ven, A. H., & Ferry, D. L. (1980). Measuring and Assessing Organizations. New York: John Wiley and Sons.
Varshney, U. & Vetter, R. (2002). Mobile commerce: Framework, applications and networking support. Mobile Networks and Applications, 7(3), pp. 185-198. Venkatraman, N., & Ramanujam, V. (1986). Measurement of business performance
in strategy research: A comparison of approaches. Academy of Management Review, 11(4), 801-814.
Appendix
The fuzzy number of each appraisal indicator
Industry types
Key indicators
Consulting Real estate
brokerage Retail Hospitality Banking Insurance Medical Logistics
Evaluation items of financial indicators
Sales growth rate (8,8.94,10) (7,8.34,10) (7,8.43,10) (8,8.65,9) (6,7.9,9) (9,9.59,10) (2,2.88,4) (3,5.01,7) Profit growth rate (9,9.74,10) (6,8.09,10) (6,7.42,9) (8,8.65,9) (7,8.68,10) (8,8.59,9) (3,3.56,5) (4,5.04,8) Return on investment (7,8.43,10) (7,8.34,10) (5,6.82,9) (5,6.21,8) (5,6.82,9) (4,5.5,7) (3,3.91,5) (3,5.01,7) Business revenue (7,8.91,10) (7,8.12,10) (7,7.97,9) (7,7.96,9) (4,7.54,10) (8,8.98,10) (8,8.65,9) (8,8.96,10) Return on assets (3,4.68,8) (3,4.79,7) (4,5.73,9) (6,6.95,8) (2,3.56,5) (4,4.74,6) (2,3.91,6) (5,6.8,9) Product fluidity (8,9.21,10) (5,6.52,8) (8,8.97,10) (7,7.65,8) (4,7.54,10) (9,9.39,10) (1,2,4) (4,6.35,8) Cash flow (5,6.22,10) (2,3.47,7) (4,6.62,10) (5,6.54,8) (5,6.59,9) (6,8.11,9) (3,3.63,4) (6,6.95,8) Cost control (5,6.77,10) (2,3.47,7) (7,8.68,10) (8,8.32,9) (7,8.91,10) (8,8.96,10) (8,8.96,10) (8,9.28,10) New client development cost (8,9.21,10) (4,5.67,7) (4,6.48,9) (4,4.58,6) (7,7.97,9) (6,7.33,9) (2,2.62,3) (3,3.63,4)
Industry types
Key indicators
Consulting Real estate
brokerage Retail Hospitality Banking Insurance Medical Logistics
Evaluation items of customer indicators
Customer Satisfaction (8,8.97,10) (8,9.17,10) (7,8.91,10) (8,8.96,10) (6,7.67,9) (9,9.39,10) (9,9.32,10) (9,9.65,10) Customer growth rate (8,9.21,10) (6,7.53,9) (5,7.09,9) (9,9.65,10) (8,9.21,10) (8,8.96,10) (8,8.32,9) (7,8.24,10) Customer retention (7,8.43,10) (8,8.39,9) (5,7,10) (7,8.24,10) (7,7.71,9) (7,8.36,9) (8,8.65,9) (7,7.88,10) Market share (7,8.18,10) (7,7.76,9) (4,6.45,9) (7,7.65,8) (8,8.24,9) (7,8.54,10) (7,7.32,8) (8,8.96,10) Service/product quality (9,9.49,10) (8,8.98,10) (7,8.91,10) (9,9.65,10) (9,9.49,10) (8,9.17,10) (9,9.65,10) (9,9.32,10) Marketing effectiveness (7,8.43,10) (8,8.56,10) (7,8.21,9) (8,8.32,9) (6,8.35,10) (8,9.17,10) (3,3.91,5) (2,2.88,4) Service timing (9,9.24,10) (7,8.54,10) (7,7.91,10) (9,9.65,10) (8,8.97,10) (8,9.36,10) (8,8.32,9) (8,8.65,9)
Industry types
Key indicators
Consulting Real estate
brokerage Retail Hospitality Banking Insurance Medical Logistics
Evaluation items of internal process indicators
Cross-departmental integrated marketing (6,8.32,10) (5,6.67,9) (7,8.68,10) (8,8.32,9) (9,9.49,10) (9,9.59,10) (2,2.29,3) (6,6.95,8) Interactions between employees and clients (7,8.43,10) (7,8.34,10) (7,8.21,9) (9,9.32,10) (7,8.68,10) (8,8.77,10) (7,7.65,8) (8,8.96,10) Rationality of supervision (4,6.05,8) (5,6.32,8) (8,8.49,9) (9,9.32,10) (6,7.9,9) (7,8.16,9) (7,7.96,9) (8,8.96,10) Information delivery (9,9.14,10) (9,9.79,10) (8,8.74,9) (9,9.32,10) (6,8.35,10) (9,9.59,10) (9,9.32,10) (8,8.65,9) Standard operation procedure (8,8.97,10) (8,8.77,10) (7,8.21,9) (9,9.32,10) (8,8.71,10) (8,8.98,10) (8,8.32,9) (7,7.96,9) Goal achievement rate (8,8.97,10) (7,7.97,9) (8,8.97,10) (8,8.32,9) (7,8.21,9) (8,8.77,10) (6,6.95,8) (8,8.32,9)
Industry types
Key indicators
Consulting Real estate
brokerage Retail Hospitality Banking Insurance Medical Logistics
Evaluation items of learning and growth indicators
Employee productivity (8,9.21,10) (7,8.12,10) (5,6.59,9) (8,8.32,9) (5,6.3,9) (6,8.28,10) (8,8.65,9) (7,7.96,9) Employee satisfaction (6,7.42,9) (8,8.77,10) (7,7.71,9) (9,9.32,10) (7,8.43,10) (7,8.72,10) (8,8.96,10) (8,8.96,10) Reduction of employee fluidity (2,2.91,4) (3,3.9,5) (2,2.63,4) (2,3.17,4) (7,8.43,10) (8,8.96,10) (5,5.94,7) (7,7.96,9) Number of employee trainings (4,4.95,6) (5,6.52,8) (6,7.44,8) (5,5.31,6) (7,8.21,9) (7,8.36,9) (6,6.65,7) (7,7.65,8) Employee professionalism (6,6.24,7) (8,8.56,10) (7,8.68,10) (8,8.32,9) (8,8.97,10) (9,9.59,10) (7,7.32,8) (7,7.96,9) Employee innovation (2,3.31,5) (1,2.49,4) (2,2.21,3) (2,2.88,4) (6,8.11,10) (9,9.59,10) (9,9.32,10) (6,6.95,8) Management level (2,2.21,3) (6,7.53,9) (8,8.74,9) (8,8.65,9) (9,9.49,10) (8,8.56,10) (8,8.65,9) (8,8.96,10) Communication channel (2,3.31,5) (7,8.36,9) (6,7.61,10) (7,8.24,10) (7,7.91,10) (6,6.97,8) (8,8.96,10) (9,9.32,10) Corporate image (8,8.94,10) (8,8.98,10) (8,8.97,10) (9,9.32,10) (8,9.21,10) (9,9.39,10) (9,9.32,10) (8,8.32,9) Establishment of a learning-oriented organization (3,3.94,5) (7,8.16,9) (8,8.97,10) (8,8.32,9) (7,8.91,10) (9,9.39,10) (6,7.23,9) (4,4.93,6) Competitiveness (8,8.46,10) (8,8.79,9) (8,8.97,10) (9,9.32,10) (8,9.21,10) (9,9.59,10) (7,8.28,9) (9,9.65,10)