探討消費者人格特質與產品風格一致性對消費者產品偏好之影響
57
0
0
全文
(2) 致 謝 經過研究所兩年的洗禮,終於在此時畫下了句點。這兩年要感謝的人太多, 首先感謝我的指導教授吳毓麒老師,在指導論文的過程中耐心的給我意見和方 向,使學生在撰寫時能有更周延的思考。也要感謝口試委員鄭育仁老師及蔡進士 老師,在口試時給我一些不錯的建議,讓學生的論文修改的更精闢。 再來要感謝我的研究所同窗,佳伶、佳慧、秉儒、晉霖、信志、欣潔、省欣、 棠祺、遠揚、俊宏、華順…等,因為有你們使我這兩年研究所的生活多采多姿, 尤其是佳伶、佳慧和秉儒,有你們三個同老闆的好友,這兩年我們一起互相督促、 共進退,相信這份友誼深刻的印在彼此心裡。 最後,感謝我的家人,爸爸、媽媽及妹妹,在我壓力最大的時候,你們給我 的支持和鼓勵,使我能有動力繼續前進,心中的感謝是無法言喻的。除此之外, 最感謝我的男友,在我最需要的時候,無時無刻地給我幫助、照顧,包容我的一 切。因為有你們大家一路陪伴走過來,這兩年的點點滴滴,是我求學階段最美好 的回憶,也是讓我學習成長最多的階段,千言萬語說不出的感謝,謝謝你們!!. 羅佳芸 謹致 高雄大學經營管理研究所 民國九十九年 七月. I.
(3) Examining the effects of consumer personality and product image congruence on consumer’s product preference. Advisor:Dr. Yu-Chi Wu Institute of Business and Management National University of Kaohsiung Student:Chia-Yun Lo Institute of Business and Management National University of Kaohsiung Abstract. Recent studies have tended to focus on the aesthetic aspect of product design. However, the existing product design literature lacks for discussions of the congruence of product images and consumer personalities. Therefore, the purpose of this study is to investigate the link between product images and consumer personalities, and thereby influences consumer‟s product preference. A sofa experimental study is conducted to examine the congruence of product images and consumer personalities. The samples include 500 respondents. Data are analyzed by descriptive statistics, T-test, Pearson correlation and Hierarchical regression. There are two findings of this study. One represents that the congruency between Type A consumers and hard image product, and the other represents that the congruency between Type B consumers and soft image product. Moreover, the result of is study shows that the congruence of product images and consumer personalities will influences consumer‟s product preference. Through this study will fill the literatures‟ gap and help designers to grasp consumers‟ needs and preferences and therefore design a variety of product images precisely. Keywords: Consumer personality, Product image, Consumer‟s product preference, Congruence of product images and consumer personalities. II.
(4) 探討消費者人格特質與產品風格一致性對消費者產品 偏好之影響. 指導教授:吳毓麒 博士 國立高雄大學經營管理所 學生:羅佳芸 國立高雄大學經營管理所 摘要 近年來的研究已著重在產品的美學設計方面。然而,目前在產品設計 的文獻上缺乏探討產品風格與消費者人格特質之一致性關係。因此,本研 究目的在研究產品風格與消費者人格特質之一致性,進而影響消費者對產 品的偏好。利用沙發的實驗設計去探討產品風格與消費者人格特質一致性 關係,資料蒐集對象為對傢俱沙發有興趣的受測者,共計 500 人,資料經 敘述性統計、T 檢定、皮爾森相關性及階層迴歸等方法分析。而實驗結果 顯示,A 型人格消費者與剛性的產品風格有一致性,B 型人格消費者則與 柔性的產品風格有一致性關係。而他們一致性的關係進一步地對消費者產 品偏好產生影響。透過本研究,可以彌補文獻在這方面的缺乏以及提供設 計者能抓住消費者的需求和喜好,因而,精確地設計出更多不同的產品風 格。 關鍵字:消費者人格特質、產品風格、消費者產品偏好、一致性. III.
(5) Contents Acknowledgment ....……………..…………………...……………………………..Ⅰ Abstract ................................................................................................................... II Abstract (in Chinese) ............................................................................................. III Contents ................................................................................................................. IV List of Tables .......................................................................................................... VI List of Figures ....................................................................................................... VII Chapter 1 Introduction ........................................................................................... 1 1.1Research Background and Motivation ........................................................... 1 1.2Research Purpose and Question .................................................................... 2 1.3Structure of This Thesis ................................................................................ 3 Chapter 2 Literature Review .................................................................................. 4 2.1 Personality ................................................................................................... 4 2.1.1 Introduction to Personality…………………………………………………4 2.1.2 Type A Behavior Pattern (TABP)............................................................... 6 2.2 Image ........................................................................................................... 8 2.2.1 Introduction Image Concept………………………………………………..8 2.2.2 Product Image ........................................................................................... 9 2.3 Theory of Self-congruity ............................................................................ 10 2.4 Consumer Response .................................................................................... 11 2.4.1 The Classification of Consumer Response………………………………..11 2.4.2 Consumer Preference .............................................................................. 12 Chapter 3 Research Methodology ......................................................................... 13 3.1 Research Hypotheses ................................................................................. 13 3.2 Experimental Design .................................................................................. 15 3.2.1 Overview ................................................................................................ 15 3.2.2 Participants ............................................................................................. 15 3.2.3 Research Variables .................................................................................. 16 3.2.3.1 Independent Variables and Manipulation .............................................. 16 3.2.3.2 Dependent Variable .............................................................................. 17 3.3 Questionnaire ............................................................................................. 18 3.4 Control Variables ....................................................................................... 18 3.5 Data Analysis Method ................................................................................ 18 Chapter 4 Data Analysis and Results .................................................................... 19 4.1 Data Collection .......................................................................................... 19 4.2 Descriptive Statistics .................................................................................. 19. IV.
(6) 4.2.1 Demographical Characteristics ................................................................ 19 4.3 Checking the Design .................................................................................. 22 4.3.1 Manipulation Checks .............................................................................. 22 4.3.2 Reliability Analysis ................................................................................. 23 4.4 Hypotheses Testing .................................................................................... 24 4.4.1 T-test Analysis ......................................................................................... 24 4.4.2 Pearson Correlation Analysis .................................................................. 26 4.4.3 Hierarchical Regression Analysis ............................................................ 26 4.5 Discussion ................................................................................................. 27 Chapter 5 Conclusions and Suggestions ............................................................... 28 5.1 Discussion on the Findings ........................................................................ 28 5.2 Limitation .................................................................................................. 29 5.3 Contributions ............................................................................................. 29 5.3.1 Theoretical Implications .......................................................................... 29 5.3.2 Managerial Implications .......................................................................... 30 5.4 Suggestion for Future Research.................................................................. 30 References .............................................................................................................. 32 Appendix A:Questionnaire ................................................................................. 36 Appendix B:Questionnaire in English................................................................ 43. V.
(7) List of Tables Table 2-1 Personality Character Theories ............................................................. 5 Table 4-1 Summary of Response Rate ................................................................. 19 Table 4-2 Description of Sample Gender............................................................. 20 Table 4-3 Description of Sample Age ................................................................... 20 Table 4-4 Description of Sample Education Level .............................................. 21 Table 4-5 Description of Sample Month Income ................................................. 21 Table 4-6 Description of Sample Occupation ...................................................... 22 Table 4-7 Manipulation Check on Product Image .............................................. 23 Table 4-8 Reliability Analysis .............................................................................. 23 Table 4-9 T-test Analysis in Personality (Type A) and Product Image (hard image vs. soft image) .................................................................................. 25 Table 4-10 T-test Analysis in Personality (Type B) and Product Image (hard image vs. soft image) .................................................................................. 25 Table 4-11 Correlation ......................................................................................... 26 Table 4-12 Results of Regression Analysis between Congruence and Preference………………………………………………………………………………………………... 27 Table 4-13 Summary of Hypotheses Test............................................................. 27. VI.
(8) List of Figures Figure 1-1 Research Procedure…………………………………………………..3 Figure 3-1 The conceptual framework and hypotheses……………...………...15. VII.
(9) Chapter 1 Introduction This research focuses on the relationship of consumer personality and product image and their relationship influence consumer‟s product preferences. According to previous studies, many experts had been discussed the relationships of product and personality, and described the relationships as product personality, such as “Product personality and its influence on consumer preference” (Govers, 2005). However, they described product definition as physical product. They didn‟t discuss an idea of product design. This chapter introduces research background and motivation, also summarizes later chapters.. 1.1Research Background and Motivation The current trend in product design has shifted from functionalism to product semantics (Krippendorff, 1995). According to this trend, the users‟ needs and preferences are primary concerns in product development within a highly competitive market. There is a growing recognition that product design is emerging as a key marketing element (Wallendorf, 1980; Kotier & Rath, 1984; Holbrook & Zirlin, 1985). Consumer researchers have tended to focus on the aesthetic aspect of product design. Design, which refers to the organization of elements of an object, and aesthetics are inherently linked since the design or physical form of a product encompasses aesthetic aspects of the product (e.g., shape, color and image, etc.).This is not surprising since this is a central concern of design and most person—product relationships begin with the perception of a product‟s appearance (Izzi & Caplan, 1972). This is especially the case for aesthetic and symbolic product value, which are very personal. Therefore, the product with the image that is most similar to the. 1.
(10) consumer‟s self-image will be the one purchased or desired while products with dissimilar images will be rejected. Westfall (1962) suggested there were some relationships between product image and consumer personality-would the product image most likely to attract a given consumer be one that matched the consumer's personality, his desired personality, or the personality he thought he had? Martineau (1958) said the product image which attracts a consumer is the image which expresses what the consumer thinks he is or what he wants to be. Although many research studies have identified different product images, very few have identified the consumer personalities attracted to different product images. Hence, this study will explore the relationship between different consumer personalities and product images, and show that their discrepant relationships influence consumer‟s product preferences strongly.. 1.2Research Purpose and Question However, some research used self-concept to explain the relationship between personality and product images. Self-concept is defined as “the totality of the individual's thoughts and feelings having reference to him as an object”. Others argue that self-concept encompasses a variety of things such as “role identities, personal attributes, relationships, fantasies, possessions, and other symbols that individuals use for the purpose of self creation and self- understanding.” (Schouten, 1991) Based on people‟s tendency to behave consistently with his/her view of the self, scholars concluded that consumers prefer products that are congruent to their self-concept (e.g., Malhotra 1988; Sirgy 1982). People make a comparison between their own self-concept and the product image and prefer those products that have image congruence with their self. Therefore, there are some research questions to be addressed in this part :. 2.
(11) 1. Will consumer personality and product images have a congruous relationship? 2.. If consumer personality and product images exists a congruous relationship, will. their relationship influence the extent of consumer‟s product preferences? Through answering the above research issues will assist designer in grasping consumer‟s psychology and designing a variety of product images precisely.. 1.3 Structure of This Thesis This study follows the procedure as illustrated in Figure1-1 Figure 2-1 Research Procedure. Identifying research objectives. Reviewing related literature and Formulating research hypotheses. Establishing research model. Questionnaire design. Data collection and analysis. Discussion and suggestions. 3.
(12) Chapter 2 Literature Review 2.1 Personality 2.1.1 Introduction to Personality Personality theories have chiefly been concerned with the factors that determine and explain different individuals‟ personalities as they are, and the factors which have brought about the given personality. Personality has been conceptualized from a variety of theoretical perspectives, and at various levels of abstraction or breadth (John, Hampson, & Goldberg, 1991; McAdams, 1995). Each of these levels has made unique contributions to our understanding of individual differences in behavior and experience. As far back as 1937, Allport collected more than 50 definitions of personality as well as offering one of his own: “Personality is the dynamic organization within the individual of those psychophysical systems that determine his unique adjustments to his environment”. Paton considered personality to be the dynamic or functional aspect of individuality - “the progressive synthesis of the mosaic of experiences.” Individuality which is mere organism unity expresses only structural differentia between members of a species; whereas personality is in all cases the peculiar function of the individual. “Personality represents those characteristics of the person that account for consistent patterns of feeling, thinking, and behaving.” (Pervin & John, 1997). Usually when we talk about someone's personality, we are talking about what makes that person different from other people, perhaps even unique. This aspect of personality is called individual differences. Individual differences in personality may be described at different levels. One of the levels consists of those broad, decontextualized, and relatively no conditional constructs called “traits”, which. 4.
(13) provide a dispositional signature for personality description. Character is defined by this author as the personality evaluated according to prevailing standards of conduct. Webb defines character as the sum of all personal qualities which are not distinctly intellectual. Thus, personality is usually defined as character, trait and so on. Interest in the relationship of personality variables and consumer behavior has existed since the importance of marketing was first recognized. Purchasing behavior, media choice, innovation, segmentation, fear, social influence, product choice, opinion leadership, risk taking, attitude change, and almost anything else one can think of have been linked to personality. Since individuals do react fairly consistently in a variety of environmental situations, these generalized patterns of response or modes of coping with the world can be called personality. To predict an individual in the study of consumer behavior, scholars researched many personality character theories to analyze the concepts of personality, for example The Big Five, Type A/B personality, Sixteen Personality Factor and Internals/Externals personality. In order to fit product image (hard vs. soft), we select Type A/B personality as a variable in this study. Table 2-1 Personality Character Theories (cont.). Type. Authors. content. The Big Five. McCrae & Costa. Extraversion, Agreeableness,. Model. (1992). Neuroticism, Conscientiousness, Openness to Experience. 5.
(14) Type A behavior pattern as an action-emotion complex that can be observed in any person who is Type A. aggressively involved in a chronic,. behavior. Roseman & Friedman. pattern. (1974). incessant struggle to achieve more and more in less and less time, and if. (TABP). required to do so, against the opposing efforts of other things or other persons; Type B behavior is opposite. Warmth, Reasoning, Emotional Stability, Dominance, Liveliness,. Sixteen. Rule-Consciousness, Social. Personality. Cattell,Eber & Tatsuoka. Boldness, Sensitivity, Vigilance,. Factor. (1980). Abstractedness, Privateness,. Questionnaire. Apprehension, Openness to Change, Self-Reliance, Perfectionism, Tension. Internals/. Internals tend to attribute outcomes. Externals. Rotter's. of events to their own control.. personality. (1954). Externals attribute outcomes of events to external circumstances.. 2.1.2 Type A Behavior Pattern (TABP) The Type A behavior pattern (TABP), an established risk factor for coronary. 6.
(15) heart disease (CHD), is defined theoretically as a chronic struggle to achieve a series of poorly defined goals within the shortest period of time possible (Friedman & Rosenman, 1974). In addition to its recently disputed relationship with heart disease, this behavior pattern has been found to intensify health complaints such as loss of appetite, depression, and headaches (Matteson & Ivancevich, 1982).The Type A behavior pattern (TABP) is an important person factor in the person-environment fit model because TABP means how person considers when she/he confronts a challenge (Ivancevich et al., 1982).Those who demonstrate the inverse behavior patterns are designated Type B. Some scholars brought up concepts of Type A behavior pattern are as follows. 1. Friedman and Rosenman (1959) Type A behavior pattern as an action-emotion complex that can be observed in any person who is aggressively involved in a chronic, incessant struggle to achieve more and more in less and less time, and if required to do so, against the opposing efforts of other things or other persons. The Structured Interview (SI) resulted from early studies of both sexes to determine the prevalence of coronary heart disease in subjects with Type A behavior (Rosenman & Friedman, 1961). Based upon questions asked in the earlier studies, a new series of items evolved for use in rating degree of drive and ambition, past and present competitive, aggressive, and hostile feelings, and sense of time urgency. This series became the SI, which was used in the Western Collaborative Group Study (WCGS) to determine the prospective role of Type A behavior patterns in the incidence of coronary heart disease (Rosenman et al., 1970). 2. Zyzanski and Jenkins (1978) The most widely used self-report measure of the Type A behavior pattern is the Jenkins Activity Survey (JAS) (Matteson & Ivancevich, 1980). The instrument was constructed from data collected in 1965 and 1966 in the Western Collaborative Group 7.
(16) Study (Zyzanski & Jenkins, 1970). The test has four major components: the Type A scale and Factor S (Speed and Impatience), Factor J (Job Involvement), and Factor H (Hard-Driving and Competitive). The latter three factors emerged from a factor analysis of the JAS items (Zyzanski & Jenkins, 1978).. 2.2 Image 2.2.1 Introduction Image Concept Boulding (1956) defined image as subjective knowledge. The concept of “image” can be applied to a political candidate, a product, a country. It describes not individual traits or qualities, but the total impression an entity makes on the minds of others. It is a most powerful influence in the way people perceives things, and should be a crucial concept in shaping our marketing, advertising, and communications efforts. The various conceptualizations of image are presented as they have appeared in the consumer behavior and marketing literature. For the marketing practice, the developments that were mentioned above imply that brand positioning cannot take place on the basis of intrinsic, functional product characteristics. Instead, brand positioning should be based (more) upon subjective, attributed characteristics, thus taking into account symbolic and intangible aspects. Finn (1985) views an image as the collection of symbolic associations with the product. Another definition by Kosslyn (1983) takes an image „as a representation in the mind that gives rise to the experience of “seeing” in the absence of the appropriate stimulation from the eye‟. For example, a politician who suddenly starts wearing glasses can radically change his impression on others. Wearing dark glasses will do so even more. Yet he remains the same person. It is his aura, his image, people have reacted to. By the same token, repackaging a product that has been on the market for decades can make it seem “young” again. The product does not changed, but its image. 8.
(17) does. There are some definitions of image in the follow: -Image as the sum of all product meanings conveyed to the consumer (Martineau, 1957); - Brand personality (Arons, 1961); - Linkages between characteristics and feelings/emotions (Oxenfeldt, 1974); - Image as an attitude (Kroeber-Riel, 1975); - Perceptions of products (Lindquist, 1974; Marks, 1976); -General characteristics, feelings, or impressions (Jain & Etgar, 1976); - Image as a hierarchical meaning structure consisting of means-end (value) chains (Reynolds & Gutman, 1984); - Image as a combination of product aspects that are distinct from the physical product characteristics but are nevertheless identified with the product. Examples are the brand name, symbols used in advertising, endorsement by a well-known figure, and country of origin (Erickson et al., 1984); - Image as concrete visual representations in memory (Kroeber-Riel, 1986); - Imagery is a processing mode in which multisensory information is represented in a Gestalt form in working memory (McIrmis & Price, 1987). It becomes clear that there is no generally accepted definition of image in the consumer behavior literature, and that different authors refer to images at different levels of abstraction. Images, as they are discussed in the literature, range from holistic, general impressions to very elaborate evaluations of products, brands, stores or companies.. 2.2.2 Product Image The product image plays an important role in users‟ preference and choice of the product (Chuang et al., 2001). Bloch said: “A good design attracts consumers to a. 9.
(18) product, communicates to them, and adds value to the product by increasing the quality of the usage experiences associated with it” (KA Hsiao et.al, 2006). However, in purchasing and using products, customers or users generally expect to perceive some critical image or indications of quality from the products. Many studies‟ research results found every products include hard and soft image (e.g., Hsiao et al., 1997; Chuang et al.,2001 and Hsiao et al.,2006).According to results of Hsiao et. al.‟s (2006) research, it referred to the product images of sofa had been kept two image words, hard and soft. Thus, after this part we use the two images to explore and test.. 2.3 Theory of Self-congruity Studies of the extent to which consumers attach meanings to products have used the 'image congruence hypothesis‟ (Grubb & Grathwoh, 1967) and product-user stereotypes (e.g. Sirgy et al., 1997) in order to examine the imagery which consumers associate with products. Self-congruity refers to the fact that consumers prefer products associated with an image that is similar to their self-concept (e.g., Belk, 1988; Malhotra, 1988; Sirgy, 1982). However, self-congruity is made up of two components, namely product image and self-image. Sirgy (1982) suggested in his self-congruity theory that consumers make a psychological comparison between their self-concept and the image of a product. The effect of self-congruence is assumed to originate from our need to express a consistent and positive view of our self. Products can serve as means by which an individual can symbolically display his/her self-concept to one-self and to others (Sirgy, 1982). Based on the theory of self-congruity, Aaker (1999) and Govers and Schoormans (2005) found that consumers prefer products and brands with a set of personality characteristics congruent to their own. The theory-when related to that of congruency-is that consumers will attempt to support their self-concept by consuming. 10.
(19) products or brands that for them evoke positive product user stereotypes, and similarly will reject or avoid those products that evoke negative stereotypes. These products can help to maintain and express their identity. For example, a person can express that he is tough by driving in a tough car, such as a Land Rover. If a person identifies with this product image, he/she will experience high self-congruence which positively influences product evaluation.. 2.4 Consumer Response 2.4.1 The Classification of Consumer Response In the existing literature, a number of different approaches are taken to describe response to design. There are three types of responses in consumer behavior. . Cognitive response Cognitive response refers to the judgments that the user or consumer makes. about the product based on the information perceived by the senses. These judgments include evaluation of the products‟ perceived qualities. . Affective response It has been well established that products elicit emotional responses. The word. affect is commonly used as an umbrella term to describe these emotions, moods and feelings. Affect has been described as part of „the consumer‟s psychological response to the semiotic content of the product. Consumers may experience a variety of potentially contradictory feelings towards an object, such as admiration, disappointment, amusement and disgust. Typically, these feelings will be relatively mild when compared to the possible spectrum of human emotions. . Behavior response A consumer‟s psychological response influences the way in which they behave. towards the product. Marketers frequently use the terms approach or avoid. 11.
(20) distinguishing between the behavior responses of an interested and disinterested consumer. Approach responses may be associated with further investigation of the product, product purchase and product use. Avoid responses may be associated with ignoring the product, failure to purchase, product abuse and even hiding the product.. 2.4.2 Consumer Preference The various aspects of product design play a vital role in the interaction between consumer and product and thus may affect consumer behavior (e.g., comprehension, categorization, aesthetic response, preference, choice, use/performance, etc.). In classical preference theory, each consumer is assumed to have a well-defined preference order or utility function, such that the consumer selects from any choice set the alternative that offers the highest utility. Consumer preference can be formed in different ways. In some cases, buyers directly compare alternatives across various attributes and choose the one they most prefer. In other situations, consumers evaluate each option separately and then pick the one that is judged most favorably. Robert (1982) stated the antecedents of preferences may involve cognitive and affective components in a variety of combinations. In some cases the cognitive component may be dominant, in some the cognitive and affective factors may interact with each other, and in other cases the affective factors may be dominant and primary. This point is clearly recognized by Bettman (1981), who attempted to isolate and specify the conditions associated with these different cases (Zajonc & Markus, 1982). Accordingly, marketing researchers have employed a variety of techniques for assessing and predicting consumer preferences, such as choice, rating, ranking, and matching (e.g., Urban & Hauser, 1993). These techniques are useful in the evaluation of products because they are based on actual products and on strong direct preference measures.. 12.
(21) Chapter 3 Research Methodology Based on review of the previous literature, the principal research indicates the relationship of consumer and product, furthermore their relationship influence the degree of product preference. This chapter includes research hypotheses, sample process, experimental design, measure on research variables and data analysis method.. 3.1 Research Hypotheses Westfall (1962) suggested there were some relationships between product image and consumer personality. We use an idea of self-concept to explain the relationship, for the self-concept has been treated as a multidimensional concept reflecting more than one type of self-perspective (e.g., actual self-image, ideal self-image, social self-image and ideal social self-image), self-image/product image congruity in turn, has been treated multidimensional. Congruity between the actual self-image and the product image has been referred to as self-congruity. Owing to products have too many images and persons have too much classification of personalities, there is no way to discuss the whole constitution of product images and personalities. Hence, we find two images, hard and soft, from numerous images as far as possible and test. The hard image gives people a strong, tough and strict feeling but at the same time Type A behavior pattern is seen as a lifestyle of behavioral responses characterized by extremes such as competitiveness, pressures for vocational advancement, intense strivings for achievement, loss of time perspective, aggressiveness, self-involvement, hyper-alertness, and inability to respond to bodily signals of stress. The soft image gives people a pleasant and gentle feeling but at the same time Type B personal behavior is accommodating attitude, cooperativeness,. 13.
(22) focus on quality over quantity and, in general, an easy going approach to life. This study suggests that there is congruity between consumer personality and product image. Hence, hypotheses are formed in the following: H1a:Type A consumers are more attracted by hard image products than soft image products. H1b: Type B consumers are more attracted by soft image products than hard image products. Several authors considered the role of product or package appearance in consumer product evaluation or choice (Bloch, 1995; Garber et al., 2000). However, they did not discuss explicitly the different ways (such as shape, color and image) in which appearance influences consumer choice and their respective implications for product design. Because product appearances include shape, color, image and so on, in terms of the foregoing viewpoint, product image also influences consumer choice of product. Therefore, the product with the image that is most similar to the consumer's personality will be the one purchased or desired while products with dissimilar images will be rejected. This product image has been assumed by consumer researchers to interact with the consumer's self-concept, thereby resulting in a so-called self-image/product image congruity, which in turn affects the consumer's product preference and purchase intention (Quester et al., 2000). This work proposes that much of the consumption process is the interaction of consumer self-images with brand, product, or store images. Sirgy's studies indicate that congruence between product image and self-concept facilitates positive behavior and attitudes towards products, which holds true regardless of whether the comparison is based on actual or ideal self-concept. Therefore, self-congruity may have a greater influence on consumers' preference, purchase intention, ownership, usage and loyalty to specific 14.
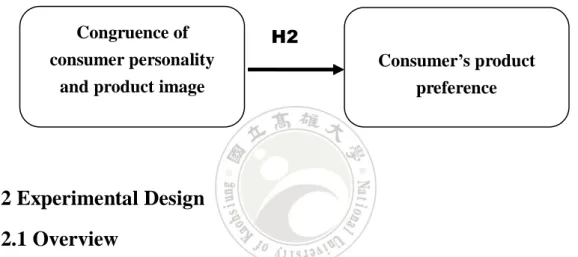
(23) products and possibly brands. According to the above description, our hypothesis tests whether congruity between the product image and consumer personality results in consumer‟s product preference: H2:Congruence of consumer personality and product image has a positive influence on consumer’s product preference. Figure 3-1 The conceptual framework and hypotheses. Congruence of. H2. consumer personality and product image. Consumer’s product preference. 3.2 Experimental Design 3.2.1 Overview This study elaborated on the concept of the relationship between different consumer personalities and product images, and their discrepant relationship influence consumer‟s product preference strongly. Consumer personality and consumer‟s product preference were directly measured. A sofa experiment in two situations of product image (hard vs. soft) within-subjects design was developed to test in this study. We indicated that A sofa belongs to hard product image, contrariwise B sofa belongs to soft product image. Participants were told that they would help to establish a useful product image of sofa.. 3.2.2 Participants Owing to our product is a sofa, we will choose Hyper-market and furniture shop,. 15.
(24) such as IKEA and HOLA in Taiwan. We select the people who are interested in sofa as this study‟s subjects.. 3.2.3 Research Variables 3.2.3.1 Independent Variables and Manipulation Independent Variables are concerned in this study: consumer personality, product images and the congruence of consumer personality and product images, which are described in the following. . Manipulation on Product image According to type of product, dissimilar products include many images. We. select two experimental conditions about product images, that is hard product image and soft product image. Through subjects‟ feeling, they evaluate two conditions of sofas display appropriate images. . Measure of Congruence of Consumer Personality and Product Image This study adapts and modifies Product-personality congruence scale that was. developed by Govers (2005) to measure congruence of consumer personality and product image. Coefficient alpha was 0.91 for Product-personality congruence (Govers, 2005). In the actual experiment, participants are asked with 3 items to measure individual personality-product images (A sofa vs. B sofa) congruence respectively. They are,“ A sofa’s image matches my own personality.”“ If you consider your own personality and compare it to the description of A sofa’s image, to the extent are they similar?”and “A sofa’s image is like my own personality.” Congruence of B sofa is measured as well. All items are measured on a 5-point Likert type scale ranging from1 (very disagree) to 5 (very agree). . Measure of Consumer personality In this part, we use Type A/B personality to measure consumer personality. The. 16.
(25) 21-item Type A scale, which was developed and validated by Begley (1985) to measure the Type A behavior pattern. We selected 6 items from the Type A scale to fit in with Chinese culture. An example is, “ Others rate as hard-driving and competitive.”Subjects indicate how well each item describes them on a 5-point Likert scale (1= disagree completely, 5= agree completely). The higher scores indicated that subjects prefer Type A personality to Type B personality.. 3.2.3.2 Dependent Variable Bloch stated consumer reactions to product form do not occur in isolation. Rather, consumer reactions are moderated by several variables, including consumer‟s taste. Product forms that are congruent with individual tastes and preference are evaluated positively, whereas negative reactions occur when there is low congruent. Further, some literatures show that the visual appearance of a product (ex, form, color or image) can influence consumer product evaluations and choice in several ways (Bloch, 1995; Garber et al., 2000; Veryzer, 1995). Thus, consumer‟s product evaluation was dependent variable to evaluate the effectiveness of consumer‟s product preference in this study. . Consumer’s product preference Product evaluation, in terms of consumer behavior, this means that the congruent. effect influences pre-purchase behavior (Gover, 2004). Product evaluation included product value, attraction and so on, and we adapts Product evaluation scale that was developed by Govers (2005) to measure consumer‟s product preference. The coefficient alpha of the literature for this scale was 0.89 (Gover, 2005). In the actual experiment, participants are asked with 4 items to measure consumer‟s product preference (A sofa vs. B sofa) respectively. They are,“I think A sofa is good-looking.”“I would like to have A sofa.”“I think A sofa is attractive me.”. 17.
(26) and “I think A sofa is a good product.”. Subjects indicate how well each item describes them on a 5-point Likert scale (1= disagree completely, 5= agree completely).. 3.3 Questionnaire The Questionnaire used in this experiment consisted of four parts. The first part of the questionnaire will measure subjects‟ personalities which categorize the Type A or B behavior. The second part, subjects evaluate product images of sofa. After evaluating, subjects will go on filling the congruence of questionnaire out. For the last part, subjects are asked about some product evaluation questions.. 3.4 Control Variables . Age Preferences could change as time goes by. Young people perhaps prefer images to. differ greatly from old people. Hence, consumers‟ age would be considered as a factor in this study. It was measured by three stages that are young, the middle-aged and old age people (Yang & Allenby, 2003).. 3.5 Data Analysis Method This study employs two types of statistic method to test the hypotheses. First, we will use the method, T-test to test the relationship between consumer personality and product image (that is H1a and H1b). Then, we perform a hierarchical regression and Pearson correlation analysis in which the dependent variable consumer preference is predicted based on the independent variable congruence of personality and product image.. 18.
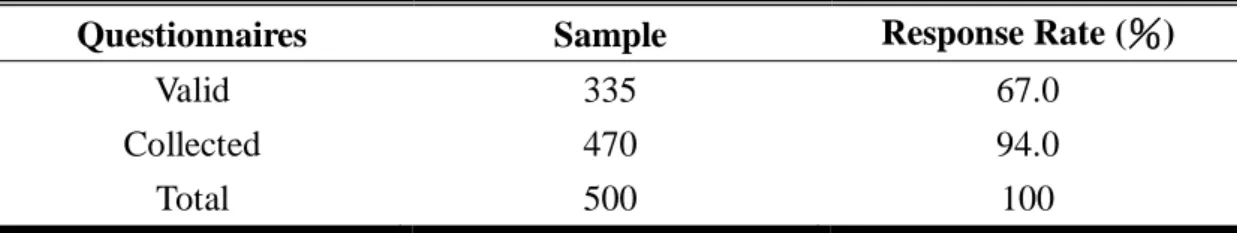
(27) Chapter 4 Data Analysis and Results This chapter will report the results of hypothesis testing. All statistical analyses were conducted using the Statistical Package for the Social Sciences (SPSS Version17.0). Initially, it represents the background of the sample and the reliability of the adopted scales to ensure that all the variables were properly used. Some interpretations of the data will be discussed. Finally, the results of hypothesis testing are listed in the form.. 4.1 Data Collection Table 4-1 shows the number of questionnaires collected, the number that were valid, and the response rate for each sample setting. As illustrated in the table, 500 questionnaires were distributed, and 470 of those were answered. The overall response rate for this survey was 94%. 135 cases of the 470 answered questionnaires were dropped due to incomplete answers or because it was clear that the respondents had not treated the questionnaire seriously. For instance, some of them chose the same answer (score) for every question. Table 4-1 Summary of Response Rate Questionnaires. Sample. Response Rate (%). Valid Collected Total. 335 470 500. 67.0 94.0 100. 4.2 Descriptive Statistics 4.2.1 Demographical Characteristics The structure of respondents includes gender, age, education level, month income and occupation.. 19.
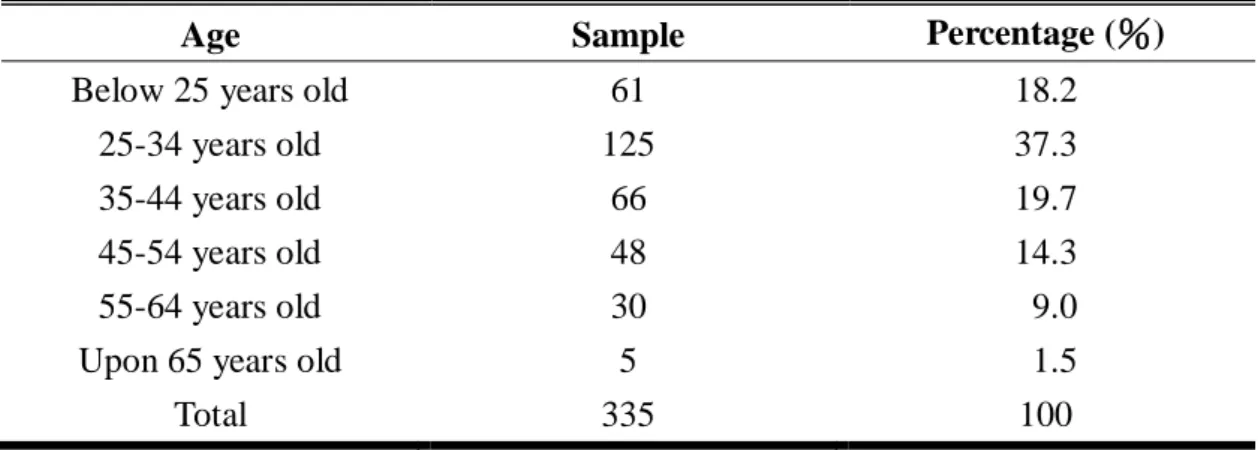
(28) 4.2.1.1 Gender Description The study includes 147 males (43.9%) and 188 females (56.1%). The major participants are females and it‟s listed in Table 4-2. Table 4-2 Description of Sample Gender Gender. Sample. Percentage (%). Male Female Total. 147 188 335. 43.9 56.1 100. 4.2.1.2 Age Description There is mostly 125 participants‟ age rage within 25-34 years old and its percentage is 37.3%. The range within 35-44 years old includes 66 participants and its percentage is 19.7%, within below 25 years old includes 61 participants and its percentage is 18.2 % , within 45-54 years old includes 48 participants and its percentage is 14.3 % , within 55-64 years old includes 30 participants and its percentage is 9.0%. The less frequency is upon 65 years old , includes 5 participants (1.5%). It‟s listed in Table 4-3. Table 4-3 Description of Sample Age Age. Sample. Percentage (%). Below 25 years old 25-34 years old 35-44 years old 45-54 years old 55-64 years old. 61 125 66 48 30. 18.2 37.3 19.7 14.3 9.0. Upon 65 years old Total. 5 335. 1.5 100. 4.2.1.3 Education Level Description This study includes 11 participants with Less than senior high school degree (3.3. 20.
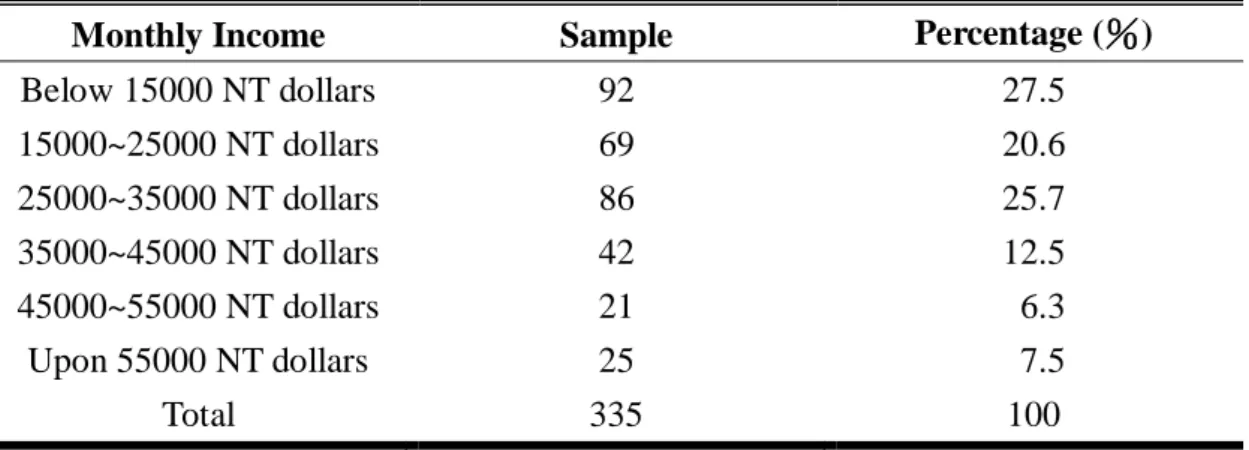
(29) %), 75 participants with Senior high school degree (22.4%), 187 participants with University degree (55.8%) and 62 participants with Master or Above degree (18.5%). The major participants of education level are university degree and it‟s listed in Table 4-4. Table 4-4 Description of Sample Education Level Education level. Sample. Percentage (%). Less than senior high school Senior high school University. 11 75 187. 3.3 22.4 55.8. Master or Above. 62. 18.5. Total. 335. 100. 4.2.1.4 Monthly Income Description The monthly income below 15000 NT dollars includes 92 participants (27.5%), within 15000~25000 NT dollars includes 69 participants (20.6%), within 25000~35000 NT dollars includes 86 participants (25.7%), within 35000~45000 NT dollars includes 42 participants (12.5%), within 45000~55000 NT dollars includes 21 participants (6.3%) and upon 55000 NT dollars includes 25 participants (7.5%). It‟s listed in Table 4-5. Table 4-5 Description of Sample Monthly Income Monthly Income. Sample. Percentage (%). Below 15000 NT dollars 15000~25000 NT dollars 25000~35000 NT dollars. 92 69 86. 27.5 20.6 25.7. 35000~45000 NT dollars 45000~55000 NT dollars Upon 55000 NT dollars Total. 42 21 25 335. 12.5 6.3 7.5 100. 21.
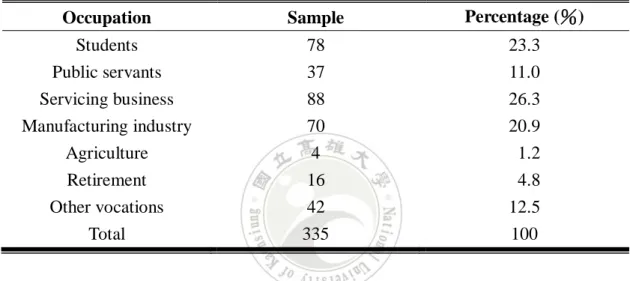
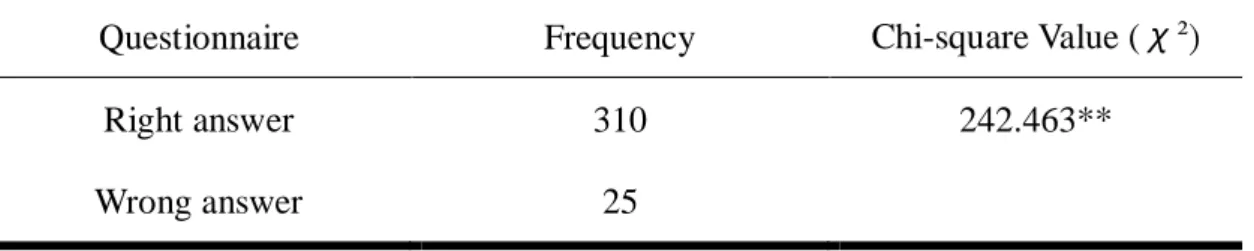
(30) 4.2.1.5 Occupation Description The occupation of participants are mostly Servicing business, include 88 people (26.3%). 78 participants are students (23.3%), 70 participants‟ occupation are Manufacturing industry (20.9%), 42 participants are other vocations(12.5%), 37 participants‟ occupation are Public servants (11%), 16 participants are retired (4.8%) and 4 participants‟ occupation are Agriculture (1.2%). It‟s listed in Table 4-6. Table 4-6 Description of Sample Occupation Occupation. Sample. Percentage (%). Students. 78. 23.3. Public servants Servicing business Manufacturing industry Agriculture. 37 88 70 4. 11.0 26.3 20.9 1.2. Retirement Other vocations Total. 16 42 335. 4.8 12.5 100. 4.3 Checking the Design 4.3.1 Manipulation Checks There were two pictures of sofa‟s samples in the questionnaire, participants were asked to choose the right answer from the information they viewed. For example, participants marked product image of A sofa as soft product image, we thought the wrong answer. In terms of two different conditions, the right answers were coded as “1”and the wrong ones were coded as “0”. Chi-square was used to determine in the experiment successfully manipulated. The results were significant with χ² = 242.463, p < 0.01. The details of manipulation on participants‟ perception were shown in Table 4-7.. 22.
(31) Table 4-7 Manipulation Check on Product Image Questionnaire. Frequency. Chi-square Value (χ²). Right answer. 310. 242.463**. Wrong answer. 25. Note:**p<0.01. 4.3.2 Reliability Analysis Reliability is the accuracy of measurement tools. It is usually used to measure scale and test the internal consistency. According to Nunnally (1978), he indicated 0.70 to be an acceptable reliability coefficient. The reliability of the scales was checked and Cronbach‟s alphas were obtained in the following:personality (6 items) = 0.758;consistency of A sofa (3 items) =0.932;consistency of B sofa (3 items) = 0.929;preference of A sofa (4 items) = 0.933 and preference of B sofa (4 items) = 0.923. All data are listed in Table 4-8. Table 4-8 Reliability Analysis (cont.) Index. Items. Alpha. 1. I eat faster than other people. 2. I like to keep two jobs moving forward at the same time. Personality. 3. Feels like hurrying speaker. 4. I often sets own deadlines 5. Others rate as hard-driving and competitive 6. Others agree-more energy than most people 1. A sofa’s image matches my own personality.. Congruence of. 2. If you consider your own personality and. 23. 0.758.
(32) A sofa. compare it to the description of A sofa’s. 0.932. image, to the extent are they similar? 3. A sofa’s image is like my own personality. 1. B sofa’s image matches my own personality. Congruence of B sofa. 2. If you consider your own personality and compare it to the description of B sofa’s. 0.929. image, to the extent are they similar? 3. B sofa’s image is like my own personality. Preference of A sofa. 1. I would like to have A sofa. 2. I think A sofa is attractive me.. 0.933. 3. I think A sofa is a good product. Preference of B sofa. 1. I would like to have B sofa. 2. I think B sofa is attractive me.. 0.923. 3. I think B sofa is a good product.. 4.4 Hypotheses Testing 4.4.1 T-test Analysis T-test is employed to determine whether or not there are any effects of personality and Product image. According to the T-test, significant differences were found (p < 0.05), the results are shown in Table 4-9 and Table 4-10. From the result of Table 4-9, we acquire product image which having significant differences in the personality (Type A) contingency (p < 0.05). It represents that hard image product have higher congruence with Type A consumers than soft image product. Hence, hypothesis 1a is supported.. 24.
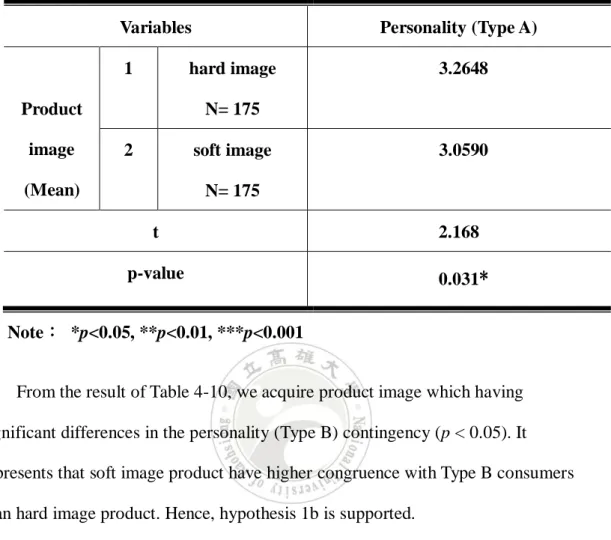
(33) Table 4-9 T-test Analysis in Personality (Type A) and Product image (hard image vs. soft image). Variables 1. Personality (Type A). hard image. Product. 3.2648. N= 175. image. 2. soft image. (Mean). 3.0590. N= 175 t. 2.168. p-value. 0.031*. Note: *p<0.05, **p<0.01, ***p<0.001 From the result of Table 4-10, we acquire product image which having significant differences in the personality (Type B) contingency (p < 0.05). It represents that soft image product have higher congruence with Type B consumers than hard image product. Hence, hypothesis 1b is supported. Table 4-10 T-test Analysis in Personality (Type B) and Product image (hard image vs. soft image) Variables. Personality (Type B). Product. 1. hard image. image (Mean). 2.8083. N= 160 2. soft image. 3.1979. N= 160 t. -4.009. 25.
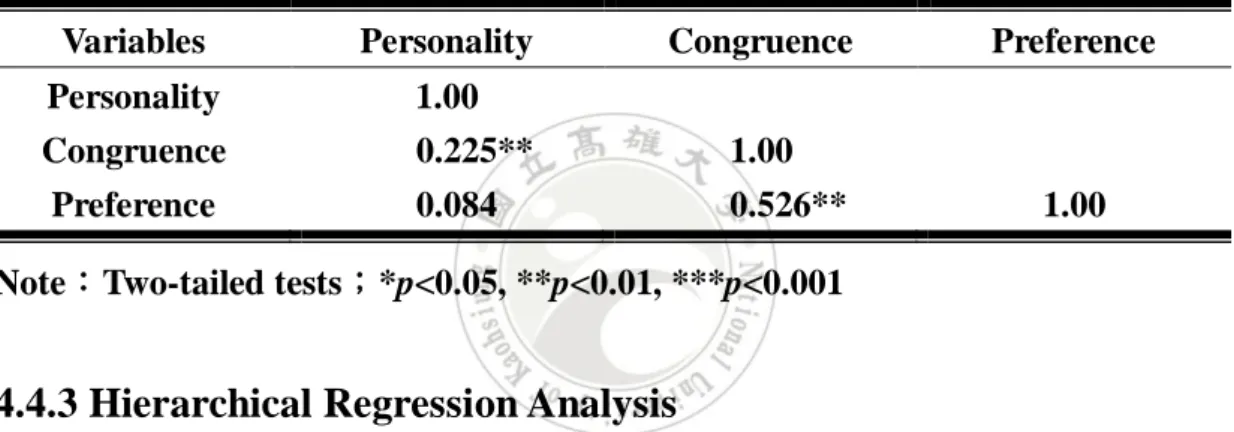
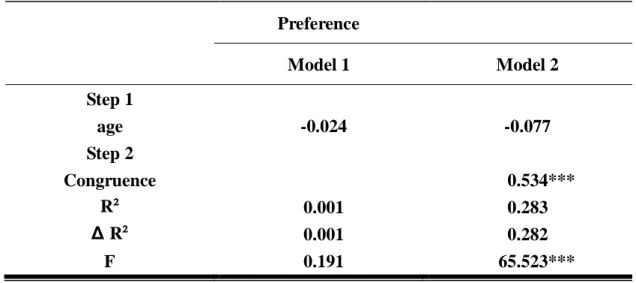
(34) p-value. 0.000***. Note: *p<0.05, **p<0.01, ***p<0.001. 4.4.2 Pearson Correlation Analysis Table 4-11 describes Pearson correlation analysis of congruence between personality and product image, consumer‟s product preference. This study found that congruence between personality, product image was positively related to consumer‟s product preference at the significant level (γ = 0.526). Table 4-11 Correlation Variables. Personality. Congruence. Personality Congruence. 1.00 0.225**. 1.00. Preference. 0.084. 0.526**. Preference. 1.00. Note:Two-tailed tests;*p<0.05, **p<0.01, ***p<0.001. 4.4.3 Hierarchical Regression Analysis This research uses hierarchical regression analysis to test the relationship of congruence between personality and product image, consumer‟s product preference by using SPSS statistic software. Table 4-12 tests hypothesis 2. Model 1 shows the results of the coefficient of control variables to consumer‟s product preference. Model 2 adds congruence of personality and product image to estimate consumer‟s product preference. Result consists with H2:Congruence of consumer personality and product image has a positive influence on consumer‟s product preference (β = 0.534, p < 0.001). The model could explain 28.3% of consumer‟s product preference (R² = 0.283).. 26.
(35) Table 1 Results of Regression Analysis between Congruence and Preference Preference Model 1. Model 2. -0.024. -0.077. Step 1 age Step 2 Congruence R² Δ R². 0.001 0.001 0.191. F. 0.534*** 0.283 0.282 65.523***. Note: *p<0.05, **p<0.01, ***p<0.001. 4.5 Discussion This study examines the congruent relationship of consumer personality and product image and it influence consumer‟s product preference. The result of hypotheses tests are summarized in Table 4-13. Table 4-13 Summary of Hypotheses Test Hypothesis. Result. H1a:Hard image products have more attraction for type A. Support. consumers than soft image products. H1b: Soft image products have more attraction for type B. Support. consumers than hard image products. H2:Congruence of consumer personality and product image has a positive influence on consumer’s product preference.. 27. Support.
(36) Chapter 5 Conclusions and Suggestions This study focuses on what consumers like what kind of product design? Regarding the effects, this study draws on literature about consumer personality, product image and consumer‟s product preference to explain the strength of their relationship. Thus, the central purpose of this research was to investigate the consumers with different personalities influence the fit of kind of product image. In this chapter, we will discuss the implications of these results as well as the limitations. Further, theoretical and managerial contributions to aspect of product design will be mentioned. Moreover, some suggestions for future studies will be addressed at the end.. 5.1 Discussion on the Findings In this study we tested two hypotheses. The results mostly consisted with the previous inference. The part of experiment displayed two results. First, it represents that the hard image product attracted the Type A consumers. Second, it represents that the soft image product attracted the Type B consumers. Analogously, the previous study shows that similarity in personality is also relevant for the development of an emotional relationship between a person and a product. People become more attached to products with a personality that is congruent to their own.. We believe that. self-congruent products serve people‟s needs to maintain a consistent view of the self (Mugge & Schifferstein, 2004). Hence, on the basis of theory of self-congruity and experimental results, we can acquire congruent relationship of personality and product image. Previous studies have shown that, with regard to the symbolic meaning of products, self-congruity is an important factor in directing consumer preference.. 28.
(37) According to the experimental result in this study, it showed that congruence of personality and product image has a positive influence on consumer‟s product preference. Therefore, the outcome corroborated previous studies.. 5.2 Limitation The consumer wants a product that gives the illusion that it was made exclusively for him, that it matches his personality, and that it responds to his needs. In other words, everyone prefers different product images. A potential problem is that there may be different set of personality and product image categories, making it different to discuss all situations in this study. There is no way to discuss the whole constitution of product images and personalities as a result of the time. We only discuss one possible personality (i.e. Type A/B personality) and product image (hard vs. soft image) in this study.. 5.3 Contributions 5.3.1 Theoretical Implications The past literature explored that relationship of consumers and product image, most of researches used theory of self-congruity (that is, self-image/product image congruity) to apply. Although a concept of consumers‟ self-image is similar to consumers‟ personality. Self-image has been defined as the "total subjective perception of oneself, including an image of one's body and impressions of one's personality, capabilities, and so on". However, the above literature refers to “Personality represents those characteristics of the person that account for consistent patterns of feeling, thinking, and behaving.” (Pervin & John, 1997). There is still the distinction between self-image and personality. Through this study to investigate the linkage between consumer personality and product images, and thereby influences consumer‟s product preference. In the 29.
(38) literatures, this study will fill the gap of consumer personality and product images.. 5.3.2 Managerial Implications Based on users‟ preference and perception, most product design studies on product image have focused on the relationship between product image and product form (Chuang & Ma, 2001; Hsiao & Liu, 2002; Hsu et al., 2000; Jindo et al., 1995). The product image plays an important role in users‟ preference and choice of the product (Chuang et al., 2001). The concept of „„user‟‟ can generally comprise two groups: the consumers and the designers. However, the way that consumers look at product image is usually different from the way that designers look at product elements or characteristics (Hsu et al., 2000). Whether consumers choose a product depends largely on their perception of product image (Hsiao & Liu, 2002), while designers design a product by considering physical elements or characteristics of the product (Matsubara & Nagamachi, 1997). In addition, consumers‟ perception of product image is often a black box and cannot be precisely described (Chuang et al., 2001). To best meet consumers‟ need of a product from a design perspective, the physical elements of the product require being linked to consumers‟ perception of the product (Aitken et al., 2003). For example, the product such as cell phone, it has many different images for everyday lives. If the person belongs to Type A behavior pattern, he or she maybe likes minimal product image of cell phone. Through the results of this study can be useful in guiding efforts intended to design the attractiveness of product image for a variety of consumers with various personalities.. 5.4 Suggestion for Future Research There are several suggestions for future research in the following. In this study we only explore congruence of product image and consumer personality; maybe it could add variables of product attributes and color and explore consistency of them. 30.
(39) and consumer personality respectively in the future. If users of various products or brands have different personalities and thus respond more to appeals structured to their particular needs, they might purchase the same product for different reasons. If product attributes that determine their choices are somehow related to their personality structures, specific appeals might be aimed at particular personality types. Ideally, an entire marketing mix could be designed for different psychological segments, particularly if different types of people want different attributes in a product. Color can also be used to differentiate a product. Many consumers have favorite colors, a phenomenon that may have been created via an association with a favorable stimulus. Color could express different meanings to dissimilar people and be used to explain human physiological response. Like The Big-Five trait, it includes extraversion, agreeableness, neuroticism and so forth. The person has extraversion and agreeableness traits, he or she behaves optimistic, lively and energy. The color yellow gives people the feeling of sunshine. There is the relationship between the extraversion and agreeableness person and the color, yellow. For this reason we suggest the research will investigate toward the direction in the future. Second, we adopt Type A/B personality and product image (hard vs. soft) to research congruent relationship in this study. It could research variety of consumer‟s personalities and product images in depth and explore their relationship.. 31.
(40) References Allport, W. G. (1921). Personality and Character. Psychological Bulletin, 18(9), 441-455. Alpert, M. I. (1972). Personality and the Determinants of Product Choice. Journal of Marketing Research, 9(1), 89-92. Ahmad, J. & Mark, M. H. G. (2001). Consumers and Brands: A Study of the Impact of Self-image Congruence on Brand Preference and Satisfaction. Marketing Intelligence & Planning, 19 (6-7). Begley, T. M. & Boyd, D. P. (1985). The Relationship of the Jenkins Activity Survey to Type A/Behavior among Business Executives. Journal of Vocational Behavior, 27(3), 316-328. Bailey, J. A. (2003). Self-image, Self-concept, and Self-identify Revisited. Journal of the National Medical Association, 95(5). Banister, E. N. & Hogg, M. K. (2007). Consumers and Their Negative Selves, and the Implications for Fashion Marketing. Fashion Marketing: Contemporary Issues. Curtis, P. H., Richard, E. P. & John, T. C. (1992). Need for Cognition and Advertising: Understanding the Role of Personality Variables in Consumer Behavior. Journal of Consumer Psychology, 1(3), 239-260. Chuang, M. C. & Ma, Y. C. (2001). Expressing the Expected Product Images in Product Design of Micro-electronic Products. International Journal of Industrial Ergonomics, 27(4), 233-245. Dale, A. B. & Carol, M. T. (1983). The Self-Concept and Self-esteem of Early Adolescents. Theory into Practice, 22(2), 91-97. Dhar, R. & Simonson, I. (1992). The Effect of the Focus of Comparison on Consumer Preferences. Journal of Marketing Research, 29(4), 430-440. Eagleston, R. & Ray, H. R. (1980). The Type A Structured Interview: A Behavioral Assessment in the Rough. Journal of Behavioral Assessment, 2(4), 255-272. 32.
(41) Eugene, T. G., Philip, W. & Donn, B. (1964). A Theory of Personality Change. Personality Change, New York: John Wiley & Sons. Ernest, D. (1985). What's In An Image? Journal of Consumer Marketing, 2(1). Grossman, R. P. & Wisenblit, J. Z. (1999). What We Know about Consumers‟ Color Choices. Journal of Marketing Practice: Applied Marketing Science, 5(3), 78-88. Govers, P .C. M & Schoormans, J. P. L. (2005). Product Personality and Its Influence on Consumer Preference. Journal of Consumer Marketing, 22(4), 189-197. Harold, H. K. (1971). Personality and Consumer Behavior: A Review Journal of Marketing Research, 8(4), 409-418. Hsu, S. H., Chuang, M.C. & Chang, C. C. (2000). A Semantic Differential Study of Designers' and Users' Product Form Perception. International Journal of Industrial Ergonomics, 25(4), 375-391. Hogg, M. K. & Banister, E. N. (2001). Dislikes, Distastes and the Undesired Self: Conceptualizing and Exploring the Role of the Undesired End State in Consumer Experience. Journal of Marketing Management, 17(1-2), 73-104. Hsiao, K. A. & Chen, L. L. (2006). Fundamental Dimensions of Affective Responses to Product Shapes. International Journal of Industrial Ergonomics, 36(6), 553-564. John, R. H. & Steven, M. S. (1982). Intensity Measures of Consumer Preference. Operations Research, 28(2), 278-320. Joseph, M. S. (1982). Self-Concept in Consumer Behavior: A Critical Review. Journal of Consumer Research, 9(3), 287. Karen, A. M., Robert, L. H., William, E. B. & William, G. L. (1982). Pattern A, Achievement Striving, and Scientific Merit: Does Pattern A Help or Hinder? Journal of Personality and Social Psychology, 39(5), 962-967. Lai, H. H., Lin, Y. C., Yeh, C. H. & Wei, C. H. (2006). User-oriented Design for the Optimal Combination on Product Design. International Journal of Production Economics, 100(2), 253-267.. 33.
(42) Matthews, K. A.; Krantz, D. S.; Dembroski, T. M.; MacDougall & James, M. (1982). Unique and Common Variance in Structured Interview and Jenkins Activity Survey Measures of Type A Behavior Pattern. Journal of Personality and Social Psychology, 42(2), 303-313. Marielle, E. H. C. & Jan P. L. S. (2005). The Different Roles of Product Appearance in Consumer Choice. Journal of Product Innovation Management, 22, 63-81. Mugge, R., Schifferstein, H. N. J. & Schoormans, J. P. L. (2006). Product Attachment and Product Lifetime: The Role of Personality Congruity and Fashion. European Advances in Consumer Research, 7. Nathan, C., James, M. & John. P. C., Engineering (2004). Seeing Things: Consumer Response to the Visual Domain in Product Design. Design Studies, 25, 547-577. Oliver, P. J. & Sanjay, S. (1999). The Big-Five Trait Taxonomy: History, Measurement, and Theoretical Perspectives. Handbook of personality: Theory and research (2nd ed.). New York: Guilford (in press). Poiesz, T. B. C (1989). The Image Concept: Its Place in Consumer Psychology. Journal of Economic Psychology, 10(4), 457-472. Quester, P. G., Karunaratna, A. & Goh, L. K. (2000). Self-congruity and Product Evaluation: a Cross-cultural Study. Journal of Consumer Marketing, 17(6), 525 - 535 Ralph, W. (1962). Psychological Factors in Predicting Product Choice. The Journal of Marketing, 26(2), 34-40. Robert, B. Z. & Hazel, M. (1982). Affective and Cognitive Factors in Preferences. The Journal of Consumer Research , 9(2), 123-131. Robert, R. M., Paul, T. & Costa, Jr. (1982). Self-Concept and the Stability of Personality: Cross-Sectional Comparisons of Self-reports and Ratings. Journal of Personality and Social Psychology, 43(6), 1282-1292. Sirgy, M. J. (1985). Using Self-Congruity and Ideal Congruity to Predict Purchase Motivation. Journal of Business Research, 13(3), 195-206. Sirgy, M. J. Grewal, D., Mangleburg, T. F. & Park, J. KS. (1997). Assessing the. 34.
(43) Predictive Validity of Two Methods of Measuring Self-image Congruence. Journal of the Academy of Marketing Science, 25(3), 229-241. Stephen, M. N. & Itamar, S. (1997). Attribute-Task Compatibility as a Determinant of Consumer Preference Reversals. Journal of Marketing Research, 34(2), 205-218. Thomas, M. B., Cynthia, L. & Joseph, M. C. (2000). The Relationships of Type A Behavior and Optimism with Job Performance and Blood Pressure. Journal of Business and Psychology, 15(2), 215-227. Veryzer, R. W. (1995). The Place of Product Design and Aesthetics in Consumer Research. Advances in Consumer Research, 22. Watson, D., Clark, L. A. & Harkness, A. R. (1994). Structures of Personality and Their Relevance to Psychopathology. Journal of Abnormal Psychology, 103(1), 18-31. Yang, S. & Allenby, G. M. (2003). Modeling Interdependent Consumer Preferences. Journal of Marketing Research, 282-294.. 35.
(44) Appendix A:Questionnaire. 您好: 我是國立高雄大學經營管理研究所的研究生,目前正從事有關「消費者與 產品之關係」的研究,請您協助填寫問卷,而您寶貴之意見,將成為本研 究之重要參考依據,感謝您撥冗參與本階段之研究,謝謝。敬祝 平 安 國立高雄大學經營管理研究所 指導老師: 吳毓麒 博士 研 究 生: 羅佳芸 敬上. 第一部分 問卷說明 本問卷提供 2 類形容詞分別加以描述產品風格,請針對以下 2 組沙發樣本進 行評量之工作,在您認為適當描述產品風格的空格內打勾。 產品風格的定義:使用者對產品本身體驗出的一種直覺感受,此種感受藉由產品 的造型、線條等產品外觀因素所組成。 堅硬/男性/理性的風格 柔軟/女性/感性的風格 A 沙發. 堅硬、男性、理性的. 柔軟、女性、感性的. 風格□. 風格□. 36.
(45) B 沙發. 堅硬、男性、理性的 風格□. 柔軟、女性、感性的 風格□. 第二部分 請針對下列的敘述,以「ˇ」表達您的看法: 非. 不. 沒. 同. 非. 常. 同. 意. 意. 常. 不. 意. 見. 同. 同. 意. 意. 01. 我吃飯的速度比一般人快............................................ □. □. □. □. □. 02. 我喜歡在同一時間內完成許多事情........................... □. □. □. □. □. 03. 我說話的速度比一般人快............................................ □. □. □. □. □. 04. 我會掛著記著事情的完成期限................................... □. □. □. □. □. 05. 我的好勝心很強............................................................ □. □. □. □. □. 06. 我很有幹勁..................................................................... □. □. □. □. □. 背面上有試題,請繼續作答. 37.
(46) 第三部分 A 沙發. 請針對下列的敘述,以「ˇ」表達您對 A 沙發的看法: 非. 不. 沒. 同. 非. 常. 同. 意. 意. 常. 不. 意. 見. 同. 同. 意. 意 01. A 沙發之產品風格和我個人的人格特質相符 一致................................................................................... □. □. □. □. □. 比較,彼此間有相似性................................................. □. □. □. □. □. 03. A 沙發之產品風格很像我個人的人格特質................ □. □. □. □. □. 02. 就你個人的人格特質和 A 沙發之產品風格作. 背面上有試題,請繼續作答. 38.
(47) B 沙發. 請針對下列的敘述,以「ˇ」表達您對 B 沙發的看法:. 非. 不. 沒. 同. 非. 常. 同. 意. 意. 常. 不. 意. 見. 同. 同. 意. 意 01. B 沙發之產品風格和我個人的人格特質相符 一致................................................................................... □. □. □. □. □. 較,彼此間有相似性....................................................... □. □. □. □. □. 03.B沙發之產品風格很像我個人的人格特質................. □. □. □. □. □. 02.就你個人的人格特質和 B 沙發之產品風格作比. 背面上有試題,請繼續作答. 39.
(48) 第四部分 A 沙發. 請針對下列的敘述,以「ˇ」表達您對 A 沙發的看法:. 非. 不. 沒. 同. 非. 常. 同. 意. 意. 常. 不. 意. 見. 同. 同. 意. 意. 01. 我認為 A 沙發很好看.................................................... □. □. □. □. □. 02. 我想要擁有 A 沙發........................................................ □. □. □. □. □. 03. 我認為 A 沙發吸引我................................................... □. □. □. □. □. 04. 我認為 A 是一張好的沙發........................................... □. □. □. □. □. 背面上有試題,請繼續作答. 40.
(49) B 沙發. 請針對下列的敘述,以「ˇ」表達您對 B 沙發的看法:. 非. 不. 沒. 同. 非. 常. 同. 意. 意. 常. 不. 意. 見. 同. 同. 意. 意 01. 我認為 B 沙發很好看..................................................... □. □. □. □. □. 02. 我想要擁有 B 沙發........................................................ □. □. □. □. □. 03.我認為 B 沙發吸引我...................................................... □. □. □. □. □. 04.我認為 B 是一張好的沙發............................................. □. □. □. □. □. 背面上有試題,請繼續作答. 41.
(50) 第五部分 基本資料 1.請問您的性別. ○ 男. ○ 女. 2.請問您的年齡. ○ 25 歲以下○ 25~34 歲 ○ 35~44 歲 ○ 45~54 歲○ 55~64. 歲 ○ 65 歲以上 3.請問您的學歷. ○ 國中小以下. ○ 高中職. ○ 大專院校. ○ 研究所以上. 4.請問您的月收入 ○ 15000 元以下 ○ 15000~25000 元 ○ 25000~35000 元 ○ 35000~45000 元 ○ 45000~55000 元 ○ 55000 元以上 5.請問您的職業. ○ 學生 ○ 軍警公教 ○ 服務業 ○ 製造業 ○ 農林漁牧. ○ 退休 ○ 其他_______________. 謝謝您的填寫:感謝您的幫忙!!. 42.
(51) Appendix B:Questionnaire in English Dear subjects: I am a postgraduate and now study in National University of Kaohsiung. This questionnaire is designed to investigate the relationship of consumer and product. Please evaluate the degree of options and check mark according to your perspectives and opinions. Thanks very much!! National University of Kaohsiung Institute of Business and Management Adviser:Dr. Yu-Chi Wu Postgraduate:Chia-Yun Lo. PART 1: This part displays two different product images. According to your feeling, please evaluate the appropriative product image of two sofa’s samples.. The definition of product image:Image as the sum of all product meanings conveyed to the consumer and linkages between characteristics and feelings/emotions. It also as a combination of product aspects that are distinct from the physical product characteristics but are nevertheless identified with the product.. A sofa. hard image □. soft image □. 43.
(52) B sofa. hard image □. soft image □. PART 2: This part is to measure your personality. According to your understanding, please evaluate and answer each of the following items that correspond most. Strongly Disagree. Disagree. Common. Agree. Strongly Agree. closely to your desired response.. 1. I eat faster than other people …………………………… □. □. □. □. □. □. □. □. □. 2. I like to keep two jobs moving forward at the same time……………………………………………………… □. 3. Feels like hurrying speaker……………………………… □ □ □ □ □ 4. I often sets own deadlines……………………………….. □. □. □. □. □. 5. Others rate as hard-driving and competitive…………….. □ □ □ □ □ 6. Others agree-more energy than most people…………….. □. 44. □. □. □. □.
(53) PART 3: A sofa. This part is to measure congruency of your personality and A sofa’s product image. According to your perception, please evaluate and answer each of the following items that correspond most closely to your desired response.. Strongly Disagree. Disagree. Common. Agree. Strongly Agree. 1. A sofa‟s image matches my own personality…………….. □. □. □. □. □. 2. If you consider your own personality and compare it to the description of A sofa‟s image, to the extent are they similar? ................................. □. □. □. □. □. 3. A sofa‟s image is like my own personality………………. □. □. □. □. □. 45.
(54) B sofa. This part is to measure congruency of your personality and B sofa’s product image. According to your perception, please evaluate and answer each of the following items that correspond most closely to your desired response. Strongly Disagree. Disagree. Common. Agree. Strongly Agree. 1. B sofa‟s image matches my own personality…………….. □. □. □. □. □. 2. If you consider your own personality and compare it to the description of B sofa‟s image, to the extent are they similar? ................................. □. □. □. □. □. 3. B sofa‟s image is like my own personality………………. □. □. □. □. □. 46.
(55) PART 4: A sofa. This part is to measure A sofa’s product evaluation. According to your perception, please evaluate and answer each of the following items that correspond most closely to your desired response. Strongly Disagree. Disagree. Common. Agree. Strongly Agree. 1. I think A sofa is good-looking……………………………. □. □. □. □. □. 2. I would like to have A sofa……………………………….. □. □. □. □. □. 3. I think A sofa is attractive me…………………………….. □. □. □. □. □. 4. I think A sofa is a good product………………………. □. □. □. □. □. 47.
數據
+6
相關文件
Finally, adding the discussion of cultural causes and the rise of Rome typeface, the relationship between the gothic script and the renaissance typeface design for the future study
• A sequence of numbers between 1 and d results in a walk on the graph if given the starting node.. – E.g., (1, 3, 2, 2, 1, 3) from
The results indicated that packaging of products which reflects local cultural characteristics has a direct and positive influence on consumers’ purchase
另外價格也是企業對於消費者傳達的另一種訊號,因為價格被視為最重要的外部
另外價格也是企業對於消費者傳達的另一種訊號,因為價格被視為最重要的外部
This research explores the service diversion factors of styles hair consumers, mutual interference among the characteristics, the diversion cost and the degree of
以往運動鞋的相關研究,其研究對象皆以廣大市場消費者為對像,例如:消費者對量
然而實際點閱進入其網頁與粉絲團,卻可發現,裡陎內容雖然有很多活動的 相關影片,但或許是標題不夠引人注目等原因,並沒有得到許多回應,造成網頁點 閱率有
