Performance Evaluation Model for Critical Information Infrastructure Protection Activities
6
0
0
全文
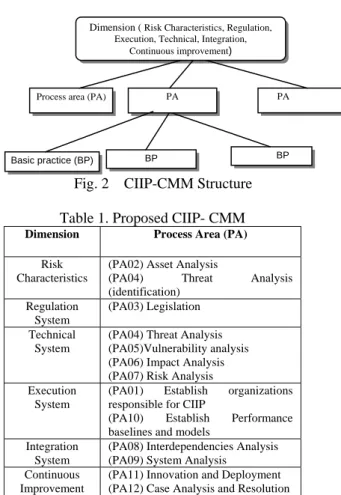
(2) Capability Maturity Model Integration (CMMI) [5] is a comprehensive reference model developed by SEI to assess levels of process capability and maturity for an organizations or a specific process area. It comes in two ways: a staged model and a continuous model. In the research, we use an approach similar to the continuous model. The continuous model rates 24 process areas on a scale from 1 to 6; namely, incomplete, performed, managed, defined, quantitatively managed, and optimized. Each process area has a set of generic goals and a set of specific goals; under which there are generic practices and specific practices, respectively. System Security Engineering Capability Maturity Model (SSE-CMM)[6] focuses on implementing security in IT systems. It provides process areas of security base practices as well as project and organization base practices. Each Process Area (PA) has several Basic Practices (BP). We have adapted some of its security process areas. However, the nature of CIIP is different from system security. Besides security, CIIP needs to consider safety related issues due to potential sabotages after intrusion. Furthermore, interdependency is the key concern for CIIP; while it is not considered in SSE-CMM.. Since infrastructures are connected on the internet, they are highly interdependent. Thus, the integration dimension deals with interdependencies and coordination among different infrastructures and sectors. Finally, continuous improvement addresses the improvement and optimization. It demonstrates the capability to incorporate new techniques and that to correct past defects. CIIP can be evaluated using the above six dimensions. Then evaluation results can be represented using a radar diagram with 5 scales on each dimension, like the one shown in Fig. 1. The radar diagram can highlight CIIP activities’ strength and weakness. An unbalanced shape of the diagram reveals that resource allocation among these dimensions is not balanced. Thus, a reallocation for a more balanced performance diagram may be desired. Regulation System. Risk Characteristics. Technical System. Continuous Improvement. 3: PROPOSED PERFORMANCE MODEL 3.1: Six dimensions for Analysis Integration. We propose using the following six dimensions to analyze CIIP maturity: 1. Risk characteristics 2. Regulation system 3. Technical system 4. Execution 5. Integration 6. Continuous improvement Risks faced by different countries are quite different. Terrorist attacks, for example, are the major risks faced by the US, Britain, and Australia, but this may not be true for other countries. Geographical differences may also incur different kinds of natural risks such as earthquakes, tsunami, hurricanes, forest fires, etc. Thus, Risk characteristics of different countries need to be identified first. Risk characteristics pave the foundations for different protection measures. Besides, CIIP involves private and public sectors, and its execution needs law enforcement; thus, regulation system is needed. Regulation system includes codes, guidelines, and standards for federal/central government, local governments, and private enterprises. Furthermore, technical effort and execution effectiveness of CIIP form the core of evaluation. Technical system dimension of CIIP mainly involve risk analysis activities such as threat analysis, vulnerability analysis, impact analysis, and risk analysis. Different countries have developed their own technical methods for these activities. Execution dimension involves the responsible organizations and the execution process.. Execution. Fig. 1 Performance Radar Diagram. 3.2: The Proposed CIIP-CMM. - 383 -. Dimension ( Risk Characteristics, Regulation, Execution, Technical, Integration, Continuous improvement). PA. PA. Process area (PA). BP. BP. Basic practice (BP). Fig. 2. CIIP-CMM Structure. Table 1. Proposed CIIP- CMM Dimension Risk Characteristics Regulation System Technical System. Execution System. Integration System Continuous Improvement. Process Area (PA) (PA02) Asset Analysis (PA04) Threat (identification) (PA03) Legislation. Analysis. (PA04) Threat Analysis (PA05)Vulnerability analysis (PA06) Impact Analysis (PA07) Risk Analysis (PA01) Establish organizations responsible for CIIP (PA10) Establish Performance baselines and models (PA08) Interdependencies Analysis (PA09) System Analysis (PA11) Innovation and Deployment (PA12) Case Analysis and Resolution.
(3) Based on the above six dimensions, we propose a CIIIP- CMM reference model to evaluate the maturity of each country’s CIIP plan. CIIP-CMM includes several process areas for each of the six dimensions; several Basic Practices (BP) are specified for each Process Areas (PA). This structure is shown in Fig. 2. Twelve process areas are defined; they are listed in Table 1. A style similar like continuous CMMI is used. The proposed process areas and their BPs are presented in the following subsections.. 3.2.1: Risk Characteristics The risk characteristics dimension includes Asset Analysis (PA02) and Threat Analysis (PA04). Asset analysis (PA02) is carried out by first identifying critical sectors, including major departments, sub-departments, their core functions and resources. The rest BPs consists of establishing asset inventories, and establishing a national asset database. These BPs are shown in Table 2. Threat analysis (PA04) includes threat identification and threat analysis. The former belongs to the Risk Characteristics dimension, the latter belongs to Technical System dimension. Threats consist of natural threats, human errors, and human malicious sabotages. The basic practices of this process area, shown in Table 3, include identification of these three types of threats, the development of potential threat scenarios, and threat monitoring at execution time.. 3.2.3: Technical System The analysis part of threat analysis (BP04.04-BP04.05) belongs to the technical dimension, as shown in Table 3 Vulnerability analysis (PA05) refers to the potential weaknesses brought about during system design, development, operation, and maintenance. BPs of this process area (shown in Table 5) include developing vulnerability analysis methods, identifying vulnerabilities, assessing vulnerabilities, and monitoring vulnerabilities. Impact Analysis (PA06) quantifies potential effects for infrastructures under attacks. It is related to threat analysis, vulnerability analysis and interdependency analysis. Its BPs are given in Table 6. Risk Analysis (PA07) is based on threat analysis, vulnerability analysis, impact analysis, and interdependency analysis to calculate the risk, which is the product of the damage cost multiplied by the occurring probability. BPs of PA07 are listed in Table 7. Table 5 BPs of PA05 (vulnerability analysis) BP05.01 BP05.02 BP05.03 BP05.04. BP02.03. Identify critical sectors Establish critical infrastructure sectors asset inventory Establish of National critical infrastructure assets database. Identify natural threats Identify human threats Identify malicious threats Threat scenario analysis Monitor threats. BP07.05 BP07.06 BP07.07. This dimension comprises establishing regulation system process (PA03). The regulation system includes governing laws, regulatory guides, and industrial standards. Thus, the basic practices, shown in Table 4, consist of legislating for governing laws, developing regulatory guidance, and developing industrial standards. Table 4. BPs of PA03 (legislation). Develop risk analysis techniques Identify risks Identify risks related to safety Identify probability of risk exposure Risk analysis Develop risk alleviation and contingency plans Monitor risks. 3.24: Execution. 3.2.2: Regulation System. BP.03.01 BP.03.02 BP.03.03. Identify targets of impacts Define impact metrics Impact scenario analysis Monitor impacts. Table 7 BPs of PA07 (risk analysis) BP07.01 BP07.02 BP07.03 BP07.04. Table 3 BPs of PA04 (threat analysis) BP04.01 BP04.02 BP04.03 BP04.04 BP04.05. analysis. Table 6 BPs of PA06 (impact analysis) BP06.01 BP06.02 BP06.03 BP06.04. Table 2 BPs of PA02 (Asset analysis) BP02.01 BP02.02. Develop vulnerability method Identify vulnerabilities Assess vulnerability Monitor vulnerability. The Execution dimension includes “Establishing responsible organizations” (PA01) and “Establish performance baselines and models” (PA10). Establishing responsible organizations (PA01) has the BPs shown in Table 8, namely, establishing national, local, and sector responsible organizations. Establish performance (PA10) baselines and models process area provides quantitative control for protection measures. Its BPs are given in Table 9.. Legislate for governing laws Develop regulatory guidance Develop industrial standards. - 384 -.
(4) Table 8 BPs of PA01 (Establish responsible organizations) BP01.01. BP01.02 BP01.03. Table 10 BPs of PA08 (interdependency analysis) BP.08.01 Identify types of interdependencies BP.08.02 Identify infrastructure environment BP.08.03 Identify couplings and response among infrastructures BP.08.04 Identify infrastructure characteristics BP.08.05 Identify types of failures BP.08.06 Identify state of operation BP.08.07 Analysis of interdependencies. Establish national organizations responsible for CIIP Establish local organizations responsible for CIIP Establish sector responsible organizations. Table 9 BPs of PA10 (Establish performance baselines and models) BP10.01 BP10.02 BP10.03 BP10.04. Establish performance objectives Establish process performance measures Establish process performance baselines Establish process performance models. Table 11 BPs of PA09 (System analysis) BP09.01 Select critical sectors and their attributes BP09.02 Modeling and simulation. 3.2.5: Integration The integration dimension includes “interdependency analysis” (PA08) and “system analysis” (PA09). Interdependency analysis (PA08) identifies and analyzes the relations among infrastructures and sectors. It is the core of critical infrastructure protection. Rinaldi et al. proposed six dimensions to analyze critical infrastructure interdependencies [7]. Rinaldi’s six dimensions are listed as follows: 1. Types of interdependencies 2. Infrastructure environment 3. Couplings and response among infrastructures 4. Infrastructure characteristics 5. Types of failures 6. State of operation The proposed BPs are : identifying Rinaldi’s six dimensions and then analyzing interdependencies. These are shown in Table 10. System analysis (PA08) uses modeling and simulation to study infrastructure interdependency and potential risk scenarios. Its BPs includes selecting critical sectors and attributes as well as modeling and simulation. These are shown in Table 11.. 3.2.6: Continuous Improvement The Continuous Improvement dimension includes “innovation and deployment” (PA11) and “problem analysis and resolution” (PA12). Solving problems and performing innovation enable CIIP to improve and reach an optimal level. BPs of these two process areas are given in Table 12 and 13, respectively.. 4 APPLICATION To demonstrate the use of the above CIIP-CMM, we have applied it to evaluate CIIP activities of several countries, and to a particular sector, a nuclear power. Table 12 BPs of PA 11 (Innovation and deployment) BP11.01 BP11.02 BP11.03 BP11.04 BP11.05 BP11.06. collect improvement proposals and identify innovations analyze improvement proposals and innovation Pilot improvement select improvement for deployment plan the deployment Measure improvement effects. Table 13 BPs of PA12 (Problem Analysis and Resolutions) BP12.01 BP12.02 BP12.03. Select defect data for analysis Analyze defect causes Implement the action proposal. plant. Due to page limits, we will only show the case studies of USA, Australia, and Taiwan in the paper. Other details can be seen in [8]. Our evaluation of these countries’ CIIP activities is based on the information from CIIP handbooks 2004 [1], 2006[2], and NIPP 2005[3], 2006[4]. Details are not provided in these handbooks; therefore, for country-level assessment, we only evaluate process-area level. While, for sector-level evaluation (a power plant), we have used CMM-CIIP basic practices [8]. Our analyses may not be very accurate due to the limitation of available information. However, our methods should be sound if more information is available. We used process-based evaluation approach, similar to continuous CMMI. Each PA is evaluated as F(fully performed), L (largely performed), P(partially performed), and N (not perform). Then, a 5-scale rating for each proposed dimension can then be assigned. Basically, an average of N evaluation will get level 1, P for level 2, and L for level 3, while F for 5. The middle of L and F will get level 4. The radar diagram for the performance of the proposed six dimensions can then be drawn for comparison.. - 385 -.
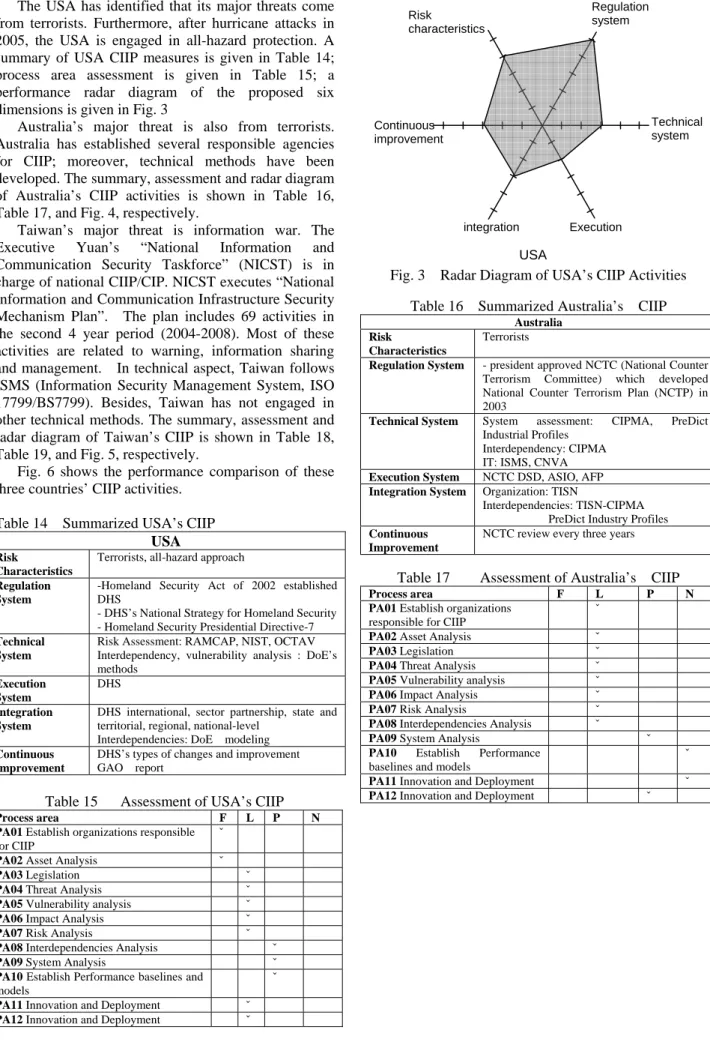
(5) The USA has identified that its major threats come from terrorists. Furthermore, after hurricane attacks in 2005, the USA is engaged in all-hazard protection. A summary of USA CIIP measures is given in Table 14; process area assessment is given in Table 15; a performance radar diagram of the proposed six dimensions is given in Fig. 3 Australia’s major threat is also from terrorists. Australia has established several responsible agencies for CIIP; moreover, technical methods have been developed. The summary, assessment and radar diagram of Australia’s CIIP activities is shown in Table 16, Table 17, and Fig. 4, respectively. Taiwan’s major threat is information war. The Executive Yuan’s “National Information and Communication Security Taskforce” (NICST) is in charge of national CIIP/CIP. NICST executes “National Information and Communication Infrastructure Security Mechanism Plan”. The plan includes 69 activities in the second 4 year period (2004-2008). Most of these activities are related to warning, information sharing and management. In technical aspect, Taiwan follows ISMS (Information Security Management System, ISO 17799/BS7799). Besides, Taiwan has not engaged in other technical methods. The summary, assessment and radar diagram of Taiwan’s CIIP is shown in Table 18, Table 19, and Fig. 5, respectively. Fig. 6 shows the performance comparison of these three countries’ CIIP activities. Table 14 Summarized USA’s CIIP USA Risk Characteristics Regulation System. Technical System Execution System Integration System Continuous Improvement. -Homeland Security Act of 2002 established DHS - DHS’s National Strategy for Homeland Security - Homeland Security Presidential Directive-7 Risk Assessment: RAMCAP, NIST, OCTAV Interdependency, vulnerability analysis : DoE’s methods DHS DHS international, sector partnership, state and territorial, regional, national-level Interdependencies: DoE modeling DHS’s types of changes and improvement GAO report. Table 15. Assessment of USA’s CIIP. Process area PA01 Establish organizations responsible for CIIP PA02 Asset Analysis PA03 Legislation PA04 Threat Analysis PA05 Vulnerability analysis PA06 Impact Analysis PA07 Risk Analysis PA08 Interdependencies Analysis PA09 System Analysis PA10 Establish Performance baselines and models PA11 Innovation and Deployment PA12 Innovation and Deployment. F ˇ. L. P. Technical system. Continuous improvement. integration. Execution. USA. Fig. 3. Radar Diagram of USA’s CIIP Activities. Table 16 Summarized Australia’s Risk Characteristics Regulation System. Technical System. Execution System Integration System. Continuous Improvement. Terrorists, all-hazard approach. Regulation system. Risk characteristics. Table 17. - president approved NCTC (National Counter Terrorism Committee) which developed National Counter Terrorism Plan (NCTP) in 2003 System assessment: CIPMA, PreDict Industrial Profiles Interdependency: CIPMA IT: ISMS, CNVA NCTC DSD, ASIO, AFP Organization: TISN Interdependencies: TISN-CIPMA PreDict Industry Profiles NCTC review every three years. Assessment of Australia’s. Process area PA01 Establish organizations responsible for CIIP PA02 Asset Analysis PA03 Legislation PA04 Threat Analysis PA05 Vulnerability analysis PA06 Impact Analysis PA07 Risk Analysis PA08 Interdependencies Analysis PA09 System Analysis PA10 Establish Performance baselines and models PA11 Innovation and Deployment PA12 Innovation and Deployment. N. ˇ ˇ ˇ ˇ ˇ ˇ ˇ ˇ ˇ ˇ ˇ. - 386 -. CIIP. Australia Terrorists. F. L ˇ. CIIP P. N. ˇ ˇ ˇ ˇ ˇ ˇ ˇ ˇ ˇ ˇ ˇ.
(6) Regulation System. Risk characteristics. Risk characteristics. Technical system. Continuous improvemen. Regulation system. Technical system. Continuous improvement. USA Australia Taiwan. Integration. Integration. execution. Australia. Fig. 4 Radar Diagram of Australia’s CIIP Activities. 5. CONCLUSION. Table 18 Summary of Taiwan’s CIIP Risk Characteristics Regulation System. Technical System Execution System Integration System Continuous Improvement. Taiwan Information war -. “Criteria for maintaining computer and information security for organizations under the Executive Yuan,” 1987 “Guidelines for Information Security for organizations under the Executive Yuan,” 1999 National Information and Communication Infrastructure Security Mechanism Plan, 2000-2004, 2004-2008 Follow ISMS (ISO 17799/BS7799) Executive Yuan’s “National Information and Communication Security Taskforce” (NICST) Organization: NICST Interdependencies: None NICST Regular meeting every half a year. Table19. Assessment of Taiwan’s CIIP F. L ˇ. P. N. ˇ ˇ ˇ ˇ ˇ ˇ ˇ ˇ ˇ ˇ ˇ. Regulation system. Technical system. Continuous improvement. Integration. Fig. 5. Critical Information Infrastructure Protection is vital to national defense. Huge effort has been invested in it in many countries. CIIP effectiveness needs to be analyzed. Moreover, most critical infrastructures are connected on the internet; thus, they are highly interdependent. Consequently, the effectiveness of CIIP of different countries needs to be evaluated and compared collectively. This research proposed a six-dimensional structure for CIIP evaluation; based on these dimensions, a CIIP-CMM has been developed. Preliminary assessment of several countries’ CIIP activities has also been presented. Using CIIP-CMM, CIIP activities of different countries can be assessed qualitatively. This is a step towards potentially quantitative metrics for CIIP evaluation.. REFERENCES. Process area PA01 Establish organizations responsible for CIIP PA02 Asset Analysis PA03 Legislation PA04 Threat Analysis PA05 Vulnerability analysis PA06 Impact Analysis PA07 Risk Analysis PA08 Interdependencies Analysis PA09 System Analysis PA10 Establish Performance baselines and models PA11 Innovation and Deployment PA12 Innovation and Deployment Risk Characteristics. Execution. Fig. 6. Comparison of CIIP Activities Among Nations. [1]Swiss Federal Institute of Technology Zurich, International CIIP Handbook 2004, http://www.isn.ethz.ch/pubs/ph/details.cfm?id=452. [2]International CIIP Handbook 2006, http://www.isn.ethz.ch/crn/_docs/CIIP_Handbook_06_Vol. 1.pdf#search='CIIP%202006. [3]U.S. Department of Homeland Security, DHS- NIPP 2005, http://www.fas.org/irp/agency/dhs/nipp110205.pdf. [4]U.S. Department of Homeland Security, DHS-NIPP 2006, http://www.dhs.gov/interweb/assetlibrary/NIPP_Plan.pdf [5] SSE-CMM, http://www.sse-cmm.org/docs/ssecmmv3final.pdf [6] CMMI, http://www.sei.cmu.edu/publications/documents/05.reports/ 05tr011.html [7] Steven M. Rinaldi, James P. Peerenboom, and Terrence K. Kelly, “Identifying, Understanding, and Analysis Critical Infrastructure Interdependencies”, 2001 Control Systems Magazine, http://www.ce.cmu.edu/~hsm/im2004/readings/CII-Rinaldi. pdf. [8] Chung-Wei Chen, “Development and Application of Effective Assessment Model for Critical Information Infrastructure Protection Measures,” Master’s thesis, Dept. of Computer Science and Engineering, Yuan-Ze U., July 2006. (in Chinese). Execution. Radar Diagram of Taiwan’s CIIP Activities. - 387 -.
(7)
數據


相關文件
Performance metrics, such as memory access time and communication latency, provide the basis for modeling the machine and thence for quantitative analysis of application performance..
important to not just have intuition (building), but know definition (building block).. More on
Envelopment Analysis,” International Institute for Applied Systems Analysis(IIASA), Interim Report, IR-97-079/October. Lye , “Clustering in a Data Envelopment Analysis
Keywords: Balanced Scorecard, Construction Industry, Performance, SWOT Analysis, Five-forces Analysis... 誌
Prioritising improvement of service attributes using impact-range-performance analysis and impact asymmetry analysis. Hospitality and travel
And further, we employed Discriminant Analysis and Logistic Regression analysis to develop pre-warning model for the oral cancer patients’ medical prognosis.. Finally,
Keywords: Standard Hotels, Service Quality, Kano’ s Model, Decision Making Trial and Evaluation Laboratory (DEMATEL), Importance-Performance Analysis
allocate new-table with 2*T.size slots insert all items in T.table into new- table.
