Graduate School of Business Administration
I-Shou University
Master Thesis
Evaluating the Operational Efficiency of
Real Estate Industry in Taiwan
by a Two-Stage DEA
Advisor: Dr. TSAI, MING -CHI (蔡明智)
Graduate Student: TRAN, T.M. TIEN (陳氏美仙)
Acknowledgements
Firstly, I want to thank my advisor, Professor Ming-Chi, Tsai for his helpful
guidance. His advice and encouragement is grateful from the bottom of my heart. I worked
in a happy mood during my stay here at I-Shou University. As a whole in the learning
process of this study, from select data to how to use the software application, analysis
method of the structure, content of articles or concept learning, my teacher was very patient
to me the most detailed and complete instructions. Thank my advisor for your
encouragement and guidance, thank for your patience and tolerance, helps me through this
process make my study successfully completed.
Special thanks are also due to the oral examination committee teachers is professor
Yue-Yang (Ray) Chen and professor Wen- HSin Fang for their unstining help.
Finally, deep gratitude would also go to my favorite parents and my beloved family
in Viet Nam, for their continuing powerful encouragement and support on my study during
the past two years.
Vinny sincerely
Abstract
The Real Estate industry is one of most important field that generally attracted the
most attention of the State as well as the business world to all of countries in the world and
partially in Taiwan.. In recent years the real estate industry in the world has been in trouble,
and Taiwan is not in exception. Most companies still can’t deal with the industry marketing
problem, but the real estate constructions and development companies on and on are
constantly setting up and developing, they are all facing strict market competition. Each
Real estate company must understand the means of relative efficiency in the industry, and
by assessing their advantages and disadvantages they are able to formulate their competitive
strategies.
This study uses a Two-stage Data Envelopment Analysis (DEA), and applies the
information in 2012 (Taiwan's economy research institute industry database, 2012) for
performance evaluation on operational efficiency and marketing efficiency changes of 29
Real Estate companies in Taiwan. The first stage model is to evaluate the operating
efficiency of the company by using total assets, fixed assets, operating costs, operating
expense, non-operating expenses as five input variables, and using net sales and operating
profit as two output variables, in order to measure the Technical efficiency, Pure Technical
efficiency and Scale efficiency of company. Then this study uses slack variable analysis to
provide direction for industry improvement with poor performance, the reference frame and
suggestion and sensitivity analysis to find which factor influence to others. The second
stage is to evaluate the marketing efficiency with net sales and operating profit as two input
variables on one hand, and uses earning per share, equity per share, turnover per share, cash
flow per share, revenue per person, each business interests as six output variables on the
others
Table of Contents
Acknowledgements ... i Abstract ... ii List of Tables ... v List of Figures ... vi Chapter 1 INTRODUCTION ... 11.1 Research Background and Motivation ... 1
1.2 Research Objectives ... 2
1.3 Research Process ... 3
Chapter 2 LITERATURE REVIEW ... 5
2.1 Real Estate Industry ... 5
2.1.1 The Definition of Real Estate ... 5
2.1.2 Real Estate Industrial Development ... 6
2.2 Performance Evaluation ... 7
2.2.1 Definition of Performance Evaluation ... 7
2.2.2 Techniques for Performance Evaluation Method... 8
2.3 Data Envelopment Analysis... 11
2.3.1 CCR Model ... 12
2.3.2 BCC Model ... 14
2.3.3 The Characteristics of Data Envelopment Analysis and Limits ... 15
2.4 Sensitivity Analysis ... 16
2.5 Slack Analysis... 17
2.6 Sorting ... 17
2.7 Two-Stage DEA Model ... 19
Chapter 3 METHODOLOGIES ... 25
3.1 Research Sample Selection ... 25
3.2 The Selection of Input and Output ... 26
3.3 Research Model ... 28
3.4 Analytical Approach ... 29
Chapter 4 RESULT AND DISCUSSION... 32
4.1 The First Stage Efficiency Analysis ... 32
4.1.1 Descriptive Statistics ... 32
4.1.2 Efficiency Analysis ... 32
4.1.3 Efficiency Improvement ... 34
4.1.4 Sensitivity Analysis ... 36
4.1.5 Sorting ... 37
4.2.2 Efficiency Analysis ... 40
4.2.3 Efficiency Improvement ... 42
4.2.4 Sensitivity Analysis ... 44
4.2.5 Sorting ... 45
4.3 The Comparison between Two- stage ... 48
Chapter 5 CONCLUSIONS AND SUGGESTIONS ... 52
5.1 Research Summary ... 52
5.2 Operating Efficiency ... 52
5.3 Marketing Efficiency ... 53
5.4 Research Limitation ... 54
5.5 Future Studies and Suggestion ... 55
Bibliography ... 56
Appendix A: Original data of all Real Estate Companies of the First Stage in Taiwan in 2012 ... 59
Appendix B: Original data of all Real Estate Companies of the First Stage in Taiwan in 2012 ... 61
Appendix C: Improvement suggestion from Slack Analysis of the First Stage ... 63
List of Tables
Table 2-1: The comparison of performance evaluation methods ... 8
Table 2-1: The comparison of performance evaluation methods ( cont ) ... 9
Table 2-1: The comparison of performance evaluation methods ( cont ) ... 10
Table 2-2: Two-stage DEA model used in the empirical research ... 21
Table 2-2: Two-stage DEA model used in the empirical research ( cont ) ... 22
Table 2-3: The papers related with DEA model to measure business performance ... 23
Table 2-3: The papers related with DEA model to measure business performance ( cont ) .... 24
Table 3-1: 29 company profile of the real estate industry ... 25
Table 3-2: Pearson Correlation coefficient of representative significance ... 30
Table 3- 3: The correlation coefficient between inputs, outputs of the first stage ... 30
Table 3- 4: The correlation coefficient between inputs, outputs of the second stage ... 30
Table 4-1: The input, output variables of the First stage ... 32
Table 4-2: The first stage evaluation model of computing efficiency value ... 33
Table 4-3: The first stage for improvement suggestions of input, output ... 34
Table 4-4: The first stage Sensitivity analysis removing variables ... 36
Table 4-5: The comparison of efficiency value at the first stage ... 38
Table 4-6: The input, output variables of the Second stage ... 40
Table 4-7: The second stage evaluation model of computing efficiency value ... 41
Table 4-8: The second stage for improvement suggestions of input, output ... 42
Table 4- 9: The first stage Sensitivity analysis removing variables ... 44
Table 4- 10: The comparison of efficiency value at the second stage ... 45
Table 4- 11: The comparison about different efficiency value of Two-stage ... 48
List of Figures
Figure 1-1: Research process ... 4 Figure 3-1: The First Stage and the Second Stage ... 28 Figure 4-1: Comparison of efficiency value between CCR, CCW and AR at the first stage ... 39 Figure 4-2: Comparison of efficiency value between CCR, CCW and AR at the Second
stage ... 47 Figure 4-3: Comparison of Two-stage in CCW model ... 50
Chapter 1 INTRODUCTION
1.1
Research Background and Motivation
According to the China Credit Information published in 2013, Top 5000 large
enterprises in Taiwan ranking data, sorting by net revenue, Highwealth construction company
still ranks first of 2012 domestic real estate development industry, which extending from 2011
and ranks in the first place. In service industry it ranks for 65.This shows that, in recent years,
the company has been actively hunting to push the case in 2012 the net revenue for the
company is on 20 billion NTD; In fact, in Taipei, Taichung, and Kaohsiung blossoming
schemes strategy worked, and delivered into house peak in 2013, combined with 1 ~ 8 month
revenues scale up to 23.446 billion NTD, more than four times increase annually, under the
level of 2013 full-year estimates. The consolidated revenue for Highwealth Construction is
expected to hit a record high; Overall, Highwealth Construction, whether it's for the group's
strategy layout or attempting to buy land, they are both relatively positive. The company also
used successfully diversification strategy and marketing mode to layout both in Taipei and
Kaohsiung area. For example, the constructions in new north city and locking of the strategy
for the operation of the Taipei first purchase. Therefore the marketing cases are low prices,
low price and low own marketing appeal in contrast Kaohsiung is locked otsubo number and
luxury homebuyers groups. (Taiwan's economy research institute Sankei database, 2014).
Three to ten years real estate development companies in 2012 were compared with the
2011 and had great changes. In December of 2014, it will be upgraded to municipalities
directly under the central government, so the heavy blocks development case, and High Speed
Rail Cingpu special area development theme of fermentation, both made the region the
housing current price went up, leading to the increase in sales for the company. (Taiwan's
In order to obtain more development and more market share, the company in addition
needs to face the reality of the situation including marketing methods, the severe competition
in the market, improvement of their own shortcomings and operational efficiency, reduced
operating costs, and increase of net advantage, will be an issue worthy to be discussed. And
DEA model can simultaneously measure the efficiency of dealing with multiple inputs and
multiple outputs, prior assumptions form the relationship between the production function, the
parameter estimation problem can be avoided, can provide use of DMU and improve the
policy. So, this study applies DEA model to evaluate Taiwan' real estate company's
management efficiency and market capacity, and puts forward improvement suggestions,
further to provide the reference for the poor efficiency of enterprises. It is hope to be able to
effectively improve their management efficiency, management capacity and market
competitiveness eventually.
1.2
Research Objectives
This study applies a Two-stage Data Envelopment Analysis model and analyzes 29
large net operating income of real estate industry in Taiwan as the research object (Taiwan's
economy research institute industry database, 2012) which based on data 2012. The main
purpose of this study has three points:
- Analyze the operational efficiency and the market capacity of Taiwan's real estate
industry
- Find the good and poor performance of the real estate industry
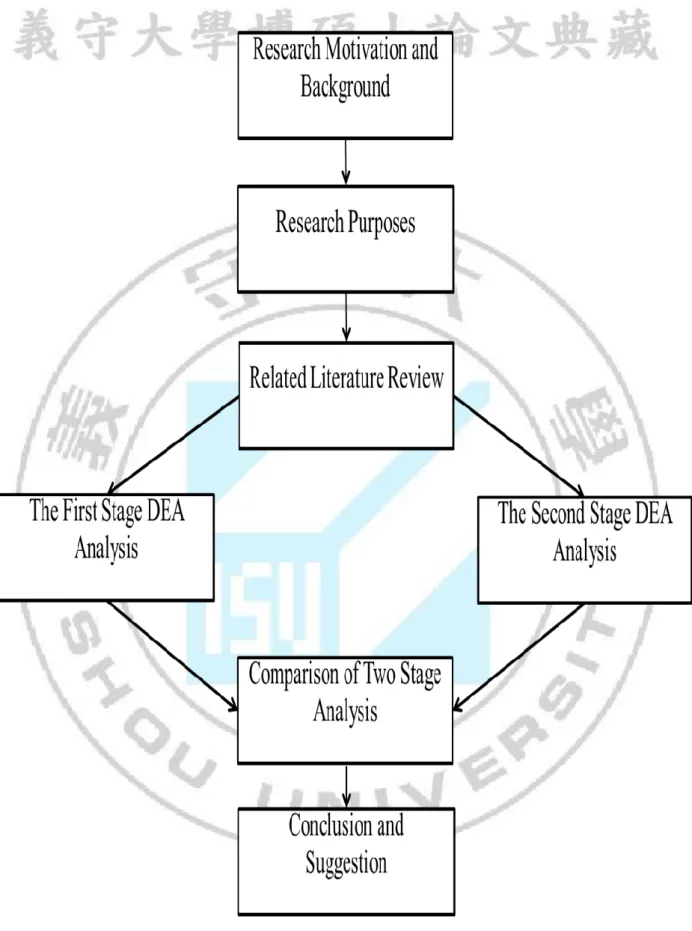
1.3
Research Process
This study uses a Two- stage Data Envelopment Analysis (DEA) to measure Real
Estate company operational efficiency and different efficiency changes. The first stage model
is the evaluation of the operating efficiency by using total assets, fixed assets, operating costs,
operating expense, non-operating expenses as five input variables, and using net sales and
operating profit as two output variables, to measure the companies 's Technical efficiency,
Pure Technical efficiency and Scale efficiency, etc., Then it uses slack variable analysis and
sensitivity analysis to provide direction for improvement for industry with poor performance,
the reference frame and suggestion. The second stage is to evaluate the marketing efficiency
with net sales and operating profit as two input variables on one hand, and uses earning per
share, equity per share, turnover per share, cash flow per share, revenue per person, each
business interests as six output variables on the other.
In the first stage of this study, we determine the direction of the research object,
purpose, scope, also decide the research topics, then collect and discuss the relevant literature.
After that, through the use of the selected inputs and outputs of the collate data envelopment
analysis method, we are to evaluate relative efficiency between those two stages to receive
evaluation unit, and to compare two phase differences. Finally, according to the results of
empirical analysis, it is hoped that we may obtain the conclusion, and puts forward
Chapter 2 LITERATURE REVIEW
2.1
Real Estate Industry
2.1.1 The Definition of Real Estate
Real Estate is a civil law concept. It includes houses on the land, and its buildings are
mobilized which can have a fixed address and therefore also belong to the Real Estate property.
The definition of Real estate legal:
1. "Civil law" the 66th: refers to land and set the content; Property of the product has
not yet been separated, as part of the real estate. That includes the land and buildings
under construction or already completed.
2. "Real Estate Broking Management Act," Section 4: means land, land or houses given
the right material and can be migrated; housing refers to housing, the right to
pre-sold homes and migrated.
3. "Real Estate Securitization Act" Section 4: Refers to the land, buildings, roads,
bridges, tunnels, improved rail, wharf, parking lot and other economic value of land
on the content and facilities of the attachment, but surely if the facilities and the land
and its object are in separation then it cannot create value alone, because the value of
land and the item loss are limited. Real estate-related rights: means the rights of land
and others approved by the central competent authority.
2.1.2 Real Estate Industrial Development
Domestic real estate market was booming from 2003 in the fourth quarter recovery so
far, has entered the first ten years, cyclical time beyond the past history records, with the
recent central bank members meeting suggests that interest rates will go up, such as the United
States near the end of quantitative easing monetary policy information, market started to worry
about driving the wave of the real estate market boom that the maximum kinetic energy of the
capital effect and the low interest rate environment will change, means that the future external
conditions for the housing market will change if not previously lax, this also causes
considerable attention from all walks of life. In addition, domestic real estate economic cycle
is about to enter a turning point. (Taiwan's economy research institute Sankei database, 2014).
In fact, in 2014, the United States quantitative easing monetary policy exit probability
is high. The domestic central bank published hinted that the talk of rate hikes has revealed the
future external conditions for the housing market will not be the same if previous easing occurs.
At the end of September 2013, the central district conference suggests that interest rates will go
up, and reminds that the mortgage needs to keep an eye on the future price risk. And if the
future interest rate changes, it will form the repayment burden; furthermore, general market
forecasts for the first time that the point of raising interest rates would fall in the second quarter
of 2014, although in the past experience, mortgage rates to rise to 3%, and purchases for the
customer will be inductive, 5% will have substantial pressure, but dubious advantage, time and
space environment has changed, the most main point is the real estate market to raise interest
rates at home and abroad, and sensitivity to market volatility has increased more significantly
than ever, which means a long continuous loose monetary policy will increase vulnerability
and sensitivity of the housing market in the face of rising interest rates; In 2014, once the
interest rates turn up, it means that, in the past, for a long time to support the housing market.
2.2
Performance Evaluation
2.2.1 Definition of Performance Evaluation
The significance of performance evaluation is that different scholars have different
explanations whose views can be summarized into the following several points:
1. Performance evaluation can be an objective and the quantitative data collection and
analysis, in terms of a digital or percentage form of its efficiency and effectiveness
(Kantor, 1984).
2. Performance evaluation is a management tool, under a meaningful organization
assessment, can get a tangible performance data (Cronin & Mary, 1985).
3. Performance evaluation is a kind of investigation and analysis of the existing situation,
is also a kind to change the status quo and promote efficiency of the process and
management tools, to make the investigation and analysis of the data to be useful and
in accordance with the purpose of the researchers, be must select the appropriate
evaluation method (McClure, 1986).
Chiao-Pin Bao at the performance evaluation comprehensive application (2008),
present the significance of performance evaluation; to measure, evaluation organization and
members, during a time of job performance.
There are many different methods of performance evaluation method: The Ratio
Analysis (Sun, 2004), the Regression Analysis (Sun, 2004), the Analytic Hierarchy Process
(AHP) (Saaty, 1977, 1980), Grey Relation Analysis, GRA) (Ju-Long Deng, 2003), Balanced
Scorecard (BSC) (Cui-Shuang Gao, 2000), Stochastic Frontier Approach (SFA) ( Aigner et
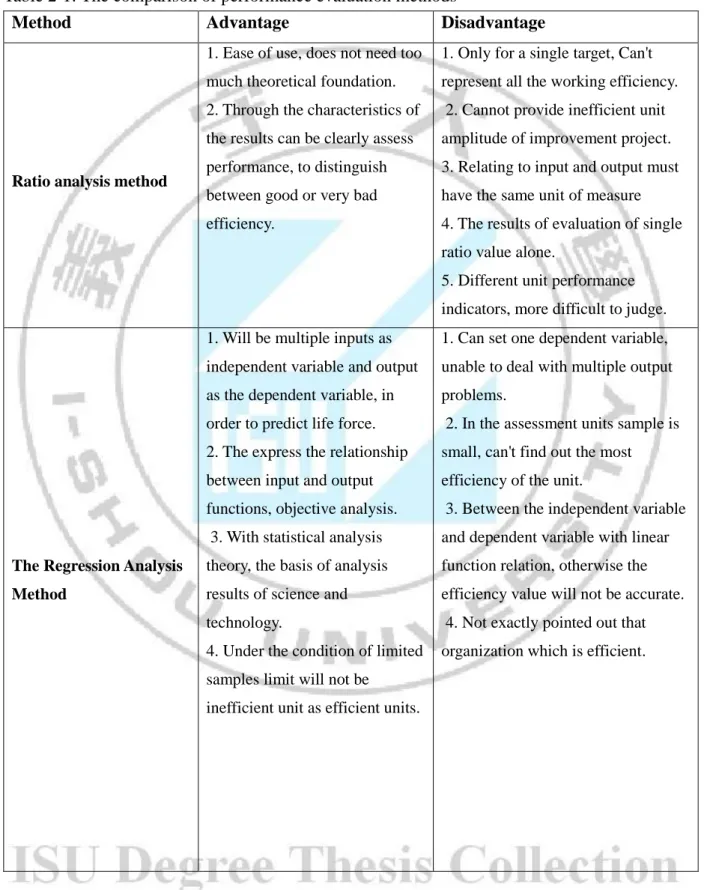
2.2.2 Techniques for Performance Evaluation Method
This section will assess the advantages and disadvantages of the performance
evaluation methods in the following table.
Table 2-1: The comparison of performance evaluation methods
Method Advantage Disadvantage
Ratio analysis method
1. Ease of use, does not need too much theoretical foundation. 2. Through the characteristics of the results can be clearly assess performance, to distinguish between good or very bad efficiency.
1. Only for a single target, Can't represent all the working efficiency. 2. Cannot provide inefficient unit amplitude of improvement project. 3. Relating to input and output must have the same unit of measure 4. The results of evaluation of single ratio value alone.
5. Different unit performance indicators, more difficult to judge.
The Regression Analysis Method
1. Will be multiple inputs as independent variable and output as the dependent variable, in order to predict life force. 2. The express the relationship between input and output functions, objective analysis. 3. With statistical analysis theory, the basis of analysis results of science and technology.
4. Under the condition of limited samples limit will not be
inefficient unit as efficient units.
1. Can set one dependent variable, unable to deal with multiple output problems.
2. In the assessment units sample is small, can't find out the most efficiency of the unit.
3. Between the independent variable and dependent variable with linear function relation, otherwise the efficiency value will not be accurate. 4. Not exactly pointed out that organization which is efficient.
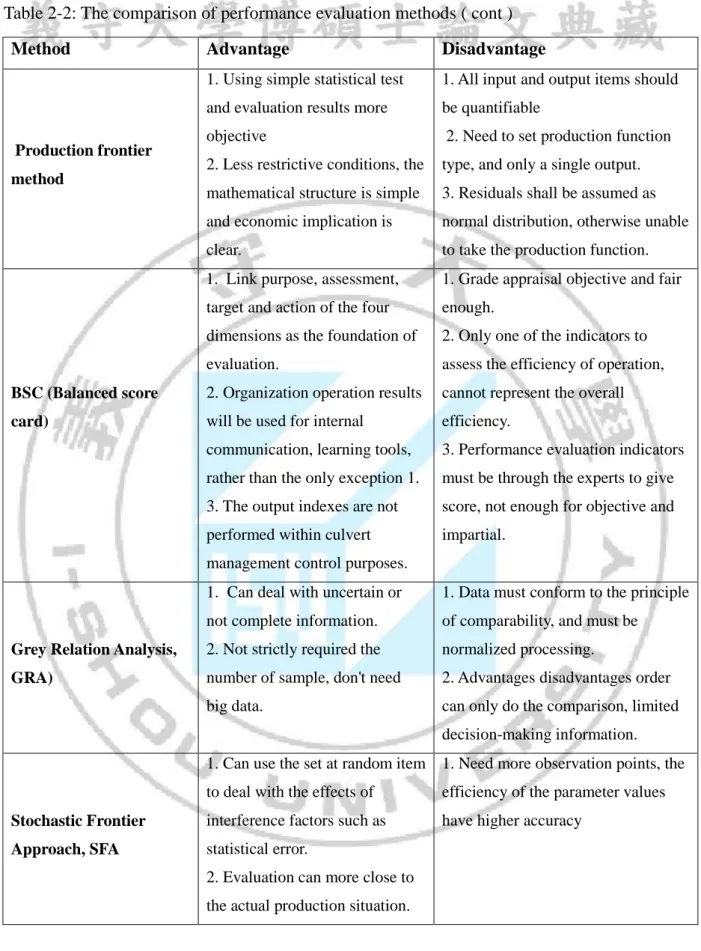
Table 2-2: The comparison of performance evaluation methods ( cont )
Method Advantage Disadvantage
Production frontier method
1. Using simple statistical test and evaluation results more objective
2. Less restrictive conditions, the mathematical structure is simple and economic implication is clear.
1. All input and output items should be quantifiable
2. Need to set production function type, and only a single output. 3. Residuals shall be assumed as normal distribution, otherwise unable to take the production function.
BSC (Balanced score card)
1. Link purpose, assessment, target and action of the four dimensions as the foundation of evaluation.
2. Organization operation results will be used for internal
communication, learning tools, rather than the only exception 1. 3. The output indexes are not performed within culvert management control purposes.
1. Grade appraisal objective and fair enough.
2. Only one of the indicators to assess the efficiency of operation, cannot represent the overall efficiency.
3. Performance evaluation indicators must be through the experts to give score, not enough for objective and impartial.
Grey Relation Analysis, GRA)
1. Can deal with uncertain or not complete information. 2. Not strictly required the number of sample, don't need big data.
1. Data must conform to the principle of comparability, and must be
normalized processing.
2. Advantages disadvantages order can only do the comparison, limited decision-making information.
Stochastic Frontier Approach, SFA
1. Can use the set at random item to deal with the effects of
interference factors such as statistical error.
2. Evaluation can more close to the actual production situation.
1. Need more observation points, the efficiency of the parameter values have higher accuracy
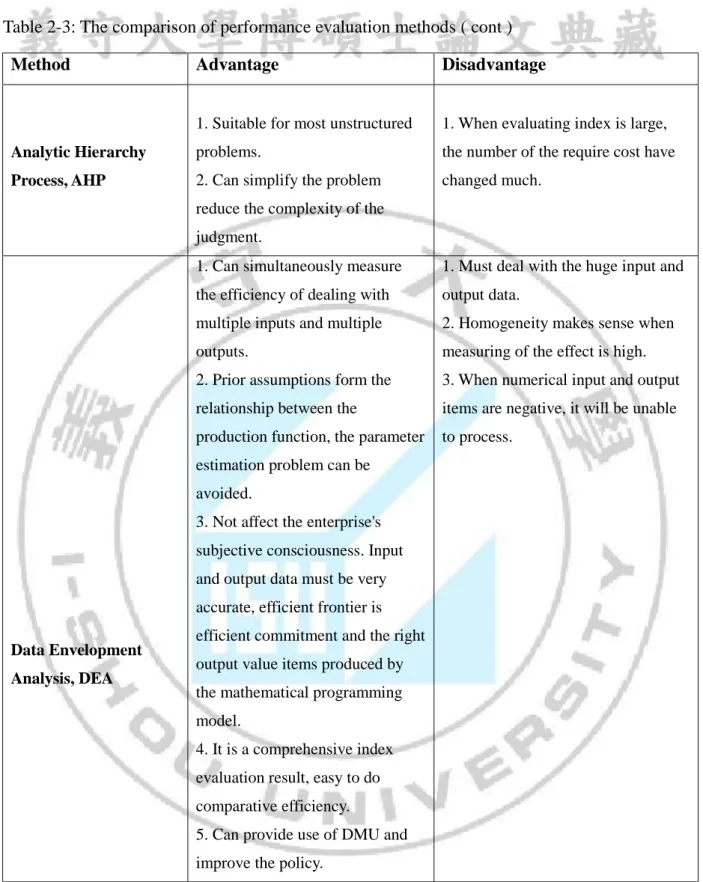
Table 2-3: The comparison of performance evaluation methods ( cont )
Source: Reference (Sun, 2004) and this study summarized
Method Advantage Disadvantage
Analytic Hierarchy Process, AHP
1. Suitable for most unstructured problems.
2. Can simplify the problem reduce the complexity of the judgment.
1. When evaluating index is large, the number of the require cost have changed much.
Data Envelopment Analysis, DEA
1. Can simultaneously measure the efficiency of dealing with multiple inputs and multiple outputs.
2. Prior assumptions form the relationship between the
production function, the parameter estimation problem can be
avoided.
3. Not affect the enterprise's subjective consciousness. Input and output data must be very accurate, efficient frontier is efficient commitment and the right output value items produced by the mathematical programming model.
4. It is a comprehensive index evaluation result, easy to do comparative efficiency.
5. Can provide use of DMU and improve the policy.
1. Must deal with the huge input and output data.
2. Homogeneity makes sense when measuring of the effect is high. 3. When numerical input and output items are negative, it will be unable to process.
2.3
Data Envelopment Analysis
Charnes, Cooper and Rhodes in 1978, published data envelopment analysis method
caused a big shock in management science and economics (Chiang Gao, Nan-Xu Huang,
Toshiyuki, 2003). This method can handle multiple input and output at the same time, because
the efficient frontier of data envelopment analysis, is by each assessment unit and the
combined line is the most favourable conditions. Therefore, in this line as target of other units
which have a compare function, and the result of analysis also is to make each unit be
accepted (Chiao-Pin Bao, 2007).
Basic theory of Data Envelopment Analysis (DEA) derived from Farrell Envelope
Curve in economics (Envelope Curve) principle put forward by the Production front
(Production Frontier), as the basis of Production efficiency measure. Farrell's (1957) research
laid the DEA the default measure efficiency on the basis of production function approach, but
its research is limited to handle the case of a single output, because it needs to solve the
multiple input and output of the problem. .
After the efficiency evaluation of Farrell (1957), followed by Charnes et al. (1978),
they expanded the previous evaluation model with multiple inputs and developed the multiple
output efficiency evaluation model of the modified CCR model. CCR model for input and
output items as fixed scale reward relations is under the overall technical efficiency of
evaluation. But if the production process is not a fixed size consideration, the CCR is not
applicable. So Banker et al. (1984) proposed the BCC model assuming that the size is the limit
of fixed remuneration. The BCC model discusses the relationship between input and output
items to change the size of the compensation, the pure technical efficiency and scale efficiency
rate of the evaluation. In the field of DEA, both CCR model and BCC model are universally
recognized as the most influential models, therefore this study will significantly focus on these
2.3.1 CCR Model
The CCR model is the origin of data envelopment analysis, and the first step in the
field into the DEA. Performance evaluation model (Charnes, Cooper and Rhodes, 1978, 1879
and 1978) proposed by hereinafter referred to as the CCR model, emphasize the fixed size
hypothesis which means that each additional input will increase output. This mode is generally
also called technical efficiency (Technical Efficiency, TE). Content of the discussion is
described as : with n decision making unit of a similar nature (Decision Making Unit, DMU),
each decision unit have m as input item and s as output items with the purpose evaluate the
kth DMUk performance and that considering the position by the critics, emphasized by the
critics of the output relative to the fixed inputs great situation, this is a CCR model of
investment orientation (Chiao-Pin Bao, 2007 ), for the DMUk establish evaluation model are
as follows: , 0 . ,..., 2 , 1 , 1 . 1 1 1 1
ik rk m i ij ik s r rj rk m i ik ik s r rk rk k v u n j x v y u s.t. x v y u h Max (1)hk:The kthDMU of relative efficiency values, k=1, 2,.., n..
yrk:The kthDMU of the rth output items.
xik:The kthDMU of the ith input items.
yrj:The jth DMU of the rth output items.
xij:The jth DMU of the ith input items.
urk:The kthDMU of the rth weight value of the output. νik:The kthDMU of the ith weight value of the intput .
ε is a smallest positive number (Charnes called the Archimedes number, Non-Archimedean small number, standing on the practical application 10-4 or 10-6 ).
Model (1) the efficiency value is under the same output level, compare the efficiency
of the resources input, so called investment efficiency (input-based efficiency). This mode will
limit the ratio of output divided by input of less than 1, in order to meet the definition of
efficiency. The weight ur and vi as unknown, when calculating the target decision-making k
unit, the weight will be selected for a specific values, so that the efficiency value hk is
maximum. When the efficiency of the decision-making unit is 1, compared to other units
known as an efficient decision-making, less than 1 called relatively inefficient (Chiang Gao,
Nan-Xu Huang, Toshiyuki, 2003).
Since the mode (1) as a fraction of the linear programming objective function
(fractional linear programming) type, in addition to the operation is not easy and there are
infinitely many solutions, so will the model is transformed into linear programming model that
also the denominator is set to 1 (Chiang Gao, Nan-Xu Huang, Toshiyuki, 2003). Model as
follows:
ik rk m i ij ik s r rj rk m i ik ik s r rk rk k v u n j x v y u x v s.t. y u h Max. , ,..., 2 , 1 , 0 1 1 1 1 1 (2)(2) formula for each DMU is to find the most advantageous weight to measure the
performance of each DMU, but in (2) formula there is m+s variables, but limit type have m +
n + s + 1, in terms of solving the dual proposition, reducing the number of constraints, making
the model more efficient computing (Boussofiane, Dyson, and Thanassoulis, 1991). (2)
restricted d Unsigne 0 0 0 2 1 , 0 2 1 , 1 1 1 1 θ ; ;s ;s λ ,..m , i s x x ,..s , r y s y s.t. s s h Min. r i j i n j j ij ik rk r n j j rj m i s r r i k
(3) where :si-:The ith input items of slack variables
sr+: The rth output items of surplus variables
(3) formula in addition to calculate more efficient, but also can be see DMU inefficient,
is terms of reference unit efficiency, through CCR efficiency evaluation models, can produce
the following three conditions:
1. θk*<1,the DMUk input, is greater than the weighted average of all DMU input
amounts, operating performance of optimization, the DMUk inficiency with CCR.
2. θk*=1,however si- or sr+ not equal 0, has a divergent efficiency (Radical Efficiency),
also known as the weak efficiency (weak efficiency).
3. θk*>1,with si- and sr+ equal 0, then has the efficiency of called Pareto-Koopmans’
efficiency, refers to an efficient DMU.
2.3.2 BCC Model
Banker, Charnes and Cooper (1984) proposed can measure the Pure Technical
Efficiency (PTE) and the Scale Efficiency (SE) of BCC model, this mode is an extension of
the concept and scope of CCR developed derived. BCC remove the CCR model, with the
assumption of constant returns to scale changed to variable return to Scale (Return to Scale,
VRS), in order to evaluate each decision-making unit of pure technical efficiency. Also the
namely the scale efficiency of decision making units. Its input-oriented programming style scores below: free u v u n j x v u y u s.t. x v u y u h Max ik rk m i ij ik s r rj rk m i ik ik s r rk rk k 0 1 1 0 1 1 0 0 , . ,..., 2 , 1 , 1 .
(4)The (4) model also is not easy to solve, but through the fixed value of the denominator
shall be converted into a linear programming model to form the following model:
free u v u n j u x v y u x v s.t. u y u h Max. ik rk m i ij ik s r rj rk m i ik ik s r rk rk k , ,..., 2 , 1 , 0 1 0 0 1 1 1 1 0
(5)2.3.3
The Characteristics of Data Envelopment Analysis
and Limits
According to Lewin, A. Y. and Minton, J. W.(1989) research, it indicated that DEA
method has the following features in the evaluation which if with comprehensive index, it can
learn about the actual use of resources, and the management for decision analysis.
1. Dealing with multiple inputs and multiple output efficiency evaluation at the same time.
2. Don't need to preset weights and is not affected by subjective factors. Evaluation is
more fair and reasonable in the process.
4. Easy to evaluate relatively efficient or relatively inefficient DMU.
According to Sun (2004) research which indicated that DEA theory limits are as
follows:
1. The purpose is to measure the relative efficiency of input and output, rather than
absolute efficiency.
2. According to the rule of thumb, the number of DMU for input and output of the project
are at least two times.
It is because the input and output value is easily affected by extreme value, we should then
choose input and output values in advance.
2.4
Sensitivity Analysis
DEA is to measure the relative efficiency, but the results are often due to the difference
of input and output variables. In order to understand the impact on efficiency value of
information, Charnes, Cooper, Lewin & Roussean (1985) indicated that: an efficient DMU,
when the input and output variables change, the degree of influence to this DMU efficiency
value must be examined to realize the increase or decrease in the input and output factors of
project, whether the corresponding virtual multiplier close to 0 or not. If close to 0, then all the
efficiency of DMU values are not affected, otherwise, all the efficiency of DMU value will
change. Thus from measurable units, we know some impact factors of the efficiency of
decision-making units. Sensitivity analysis of the impact of the efficiency value can be from
two themes :
1. Increase or decrease DMU:If the increase or decrease for efficient DMU can affect
the efficient frontier, causes a change in the efficiency value, with their DMU as
reference object, changes will produce efficiency value. If the increase or decrease of
inefficient DMU, the value will have no impact on the efficiency of other DMU.
variables will affect the efficiency of DMU value, as for the same DMU efficiency
value how much difference, then see the DMU in the performance of each input or
output variables.
2.5
Slack Analysis
In addition to assess efficiency of the differences between the variables (Slack Analysis)
by the DEA analysis, it can offer guidance for each assessment unit, in order to obtain the best
input and output elements (Luo and Donthu, 2001). For inefficient evaluation units, to achieve
the best efficiency value, it puts forward the need to reduce input or increase the number of
output variables.
From computed result of (3) formula, when si- and sr+ equal 0, it will have CCR
efficiency and resource evaluation unit to be used is appropriate. If si- and sr+ not equal 0, it is
said that the assessment unit still have improve space of resource using, to reduce its inventory
or increase their output. With an inefficient DMUk , it assumes that it’s the ith inputs, the rth
outputs respectively (Xik, Yrk), for improve its efficiency, in the input variables to reduce inventory ΔXik by (Charnes et al., 1985 ) :
ΔXik = Xik - (θ*Xik - si-*), i=1,2,…, m
The output variables need to increase output amount ΔYrk : ΔYrk = (Yrk + sr+*) – Yrk, r=1,2,…, s
2.6
Sorting
DEA model is for each evaluation unit to find out the best interest of its weight, to
carry out performance measurement, often so many review unit is efficient, and thus reduce
the performance evaluation of differential degrees . In order to improve this defect, the
analysis will be based on the reference of the weight of the CCR, developed by compromise
𝑣𝑖∗ =∑ 𝑣𝑖𝑗 𝑛 𝑗=1 𝑛 = 𝑣1 ∗ 𝑢𝑟∗ = ∑ 𝑢𝑟𝑗 𝑛 𝑗=1 𝑛 = 𝑢1 ∗ (6)
After the set of common compromise weight is obtained the efficiency value of kth
DMU can be computed as follow:
𝜃
𝑘=
∑ 𝑢𝑟 ∗ 𝑦𝑟𝑦∑𝑣𝑖∗ 𝑥𝑖𝑘 And
θ
k ∗=
θkmax{θj}
, j = 1,2, … , n
The ith input items of compromise weight is vi*The rth output items of compromise weight is ur*
Because of the efficiency of compromise weight value is less than 1, so will its relative
efficiency value k
, make it at least 1 unit for efficiency unit (Chiao-Pin Bao, Meei-Ying
Tsai, Ming-Chi Tsai, 2012).
The Assurance Region or sometime is called Adding weight restriction, DEA assumes
the weight u1, u2, u3, ..., un for the outputs variables and weights v1, v2, v3, …, vm for the inputs
variables in the model. The AR model includes additional constraints on the relative
magnitude of weight for special items. And these AR are usually expressed in ratios as
example a constraint on the ratio of weight for input i and input j could be added as follows
(Cooper et al., 2000):
𝑖, 𝑉𝑉𝑗
𝑖 𝑖,
Li,j is the lower bound
Ui,j is the upper bound
In general, the efficiency score in the DEA model has been limited to some bounds.
The efficient DMUs now could be found to be inefficient after such constraints have been
2.7
Two-Stage DEA Model
The input and output of operating process of traditional DEA model should be
considered as a single stage, and at the same time , processing multiple input and multiple
output and obtained a comprehensive efficiency value, it can be seen that the overall efficiency
of a DMU, by ignoring the important connotation in the process of industrial production, so
not a deep layer of exploring in the process of industrial production of each process are real
efficiency ( Ming-Zhong Yu, Heng-Zhi Guo, Geng Yi, 2008) .
Chen, Cook, & Zhu (2010) mentioned that recently the DEA method has extended to
two phase process to evaluate efficiency, two-stage DEA seemed to the expansion of the DEA
efficiency evaluation model and import the concept of intermediate goods, will be subjected to
a review of the unit of production process which is divided into two sub DMU. All of the first
stage output wills become the second stage inputs. And the results of the two-stage DEA
model do not only provide overall efficiency value in the whole process, but also can be used
for calculating the value of efficiency for each individual stage,, whereDMU1 and
Sub-DMU2 are acting respectively as input and output to the production process of intermediate
goods as in addition to the efficiency relation of input and output, the two-stage DEA is also
the relationship between the input and the efficiency of intermediate goods, and the efficiency
relationship between money and output. In addition, the basic model of the two-stage DEA
and DEA model are the same, all can be used to evaluate efficiency of CCR model and BCC
model (Jih-Hwa Wu, Bai-Zheng He, 2008).
Because of traditional DEA method cannot fully reflect the production stage in the
process of the management information, Seiford and Zhu (1999) are the first people using data
envelopment analysis, puts forward two stages of the production process of DEA analysis
method to analyze the former U.S. 55 Banks' Profitability and market capacity (Marketability).
and market capacity into second order section. The number of employees, assets, and
shareholders equity are three variables as input in the first stage. Then to measure profitability,
revenues and profits after tax are two variables as output. The input of the second stage
contains revenues, profits after taxes, and market value, and the total reward of investment and
earnings per share as output to measure the market efficiency. This research aims to explain
the banking profitability and market capacity. Study found that nearly 90% of bank
profitability and market capacity is inefficient; and large Banks profitability performance is
better than small Banks in the market; in addition, the large Banks show increasing state on
profitability pay scale, and decreasing on ability to pay in the market scale which point out
what the Bank of America said size presents negative correlation with the ability to market
efficiency.
Zhu (2000) inherited Seiford and Zhu (1999) for the two-stage data envelopment
analysis method used to analyze revenue in the U.S. Fortune magazine ranked 500 companies
financial performance. In practice, the first stage and second stage present by Seiford and Zhu
(1999) is similar to the first stage of which is a measure of profitability to the number of
employees, assets and shareholder equity as three input variables, revenues and profits after
taxes for the output variables; second stage is to measure the ability of the market with two
inputs is revenues and net income, market value, the output of the three variable is total return
to investors and earnings per shares. The results show that there is not necessarily higher
yielding corporate profitability and marketability in terms of good performance and
diminishing returns to scale showing. The state also found that most companies presenting
serious technical and scale inefficiencies. Furthermore studies have shown that by reducing the
existing staff, assets and equity can actually increase revenue and profit levels.
Afterwards Luo (2003) also adopts the same assessment method, discusses the 245
large bank profit efficiency (Profitability Efficiency), and the market efficiency (Marketability
input variables of profit efficiency for the number of employees, assets and shareholders
equity, output variables for revenue and profit; assess the input variables of market efficiency
for revenue and profit, output variables with market value, earnings per share and stock price.
Study found that the inefficient problem for large Banks really comes from the market
inefficiency there are 34 (i.e. 14%) Banks have high profit but they have no efficiency to
market, so the bank should put emphasis on the value of the produce market activities; In
addition, the results also refers to the position of the bank for a profit or the impact of market
efficiency is not significant, and find the overall technical efficiency of profit efficiency of
profit efficiency rate can predict bank failure.
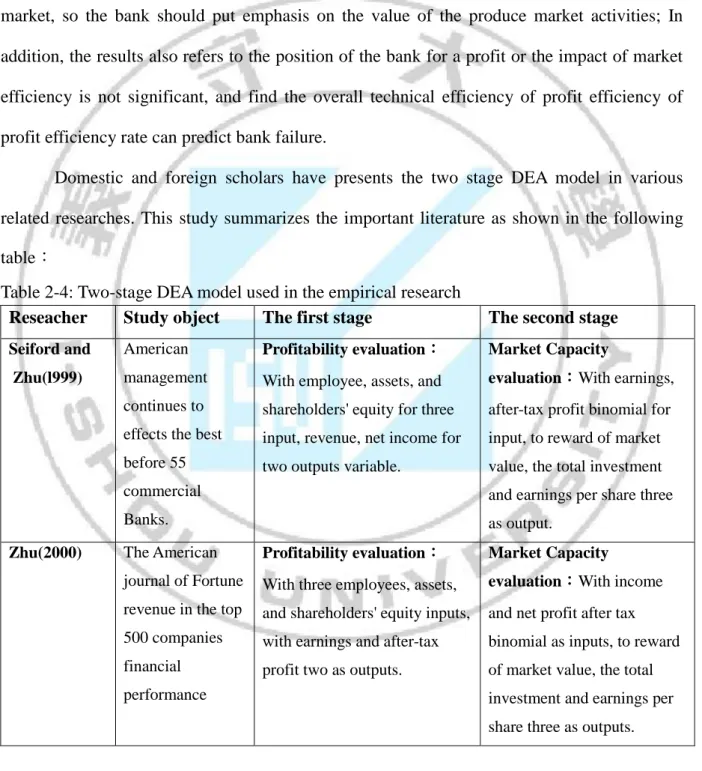
Domestic and foreign scholars have presents the two stage DEA model in various
related researches. This study summarizes the important literature as shown in the following
table:
Table 2-4: Two-stage DEA model used in the empirical research
Reseacher Study object The first stage The second stage
Seiford and Zhu(l999)
American management continues to effects the best before 55 commercial Banks.
Profitability evaluation:
With employee, assets, and shareholders' equity for three input, revenue, net income for two outputs variable.
Market Capacity
evaluation:With earnings,
after-tax profit binomial for input, to reward of market value, the total investment and earnings per share three as output.
Zhu(2000) The American
journal of Fortune revenue in the top 500 companies financial performance
Profitability evaluation:
With three employees, assets, and shareholders' equity inputs, with earnings and after-tax profit two as outputs.
Market Capacity
evaluation:With income
and net profit after tax binomial as inputs, to reward of market value, the total investment and earnings per share three as outputs.
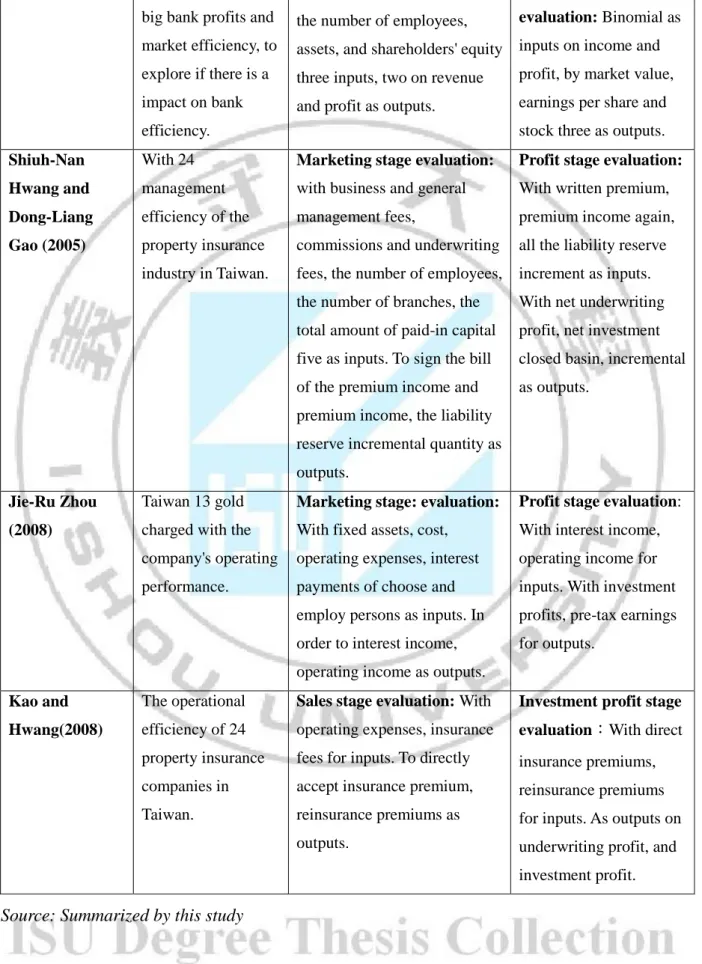
Table 2-5: Two-stage DEA model used in the empirical research ( cont )
Source: Summarized by this study
Reseacher Study object The first stage The second stage
Luo(2003) The American 245
big bank profits and market efficiency, to explore if there is a impact on bank efficiency.
Profitability evaluation:For
the number of employees, assets, and shareholders' equity three inputs, two on revenue and profit as outputs.
Market Capacity evaluation: Binomial as
inputs on income and profit, by market value, earnings per share and stock three as outputs.
Shiuh-Nan Hwang and Dong-Liang Gao (2005) With 24 management efficiency of the property insurance industry in Taiwan.
Marketing stage evaluation:
with business and general management fees,
commissions and underwriting fees, the number of employees, the number of branches, the total amount of paid-in capital five as inputs. To sign the bill of the premium income and premium income, the liability reserve incremental quantity as outputs.
Profit stage evaluation:
With written premium, premium income again, all the liability reserve increment as inputs. With net underwriting profit, net investment closed basin, incremental as outputs.
Jie-Ru Zhou (2008)
Taiwan 13 gold charged with the company's operating performance.
Marketing stage: evaluation:
With fixed assets, cost, operating expenses, interest payments of choose and employ persons as inputs. In order to interest income, operating income as outputs.
Profit stage evaluation:
With interest income, operating income for inputs. With investment profits, pre-tax earnings for outputs. Kao and Hwang(2008) The operational efficiency of 24 property insurance companies in Taiwan.
Sales stage evaluation: With
operating expenses, insurance fees for inputs. To directly accept insurance premium, reinsurance premiums as outputs.
Investment profit stage evaluation:With direct
insurance premiums, reinsurance premiums for inputs. As outputs on underwriting profit, and investment profit.
Variables are selected in the two stage of this study including input variables, i.e. total
assets, fixed assets, operating cost, operating expenses, non-business expenses and output
variables, i.e. net sales, operating profits. In the second stage, the net sales and operating profit
are two input variables, and earning per share, equity per share, turnover per share, cash flow
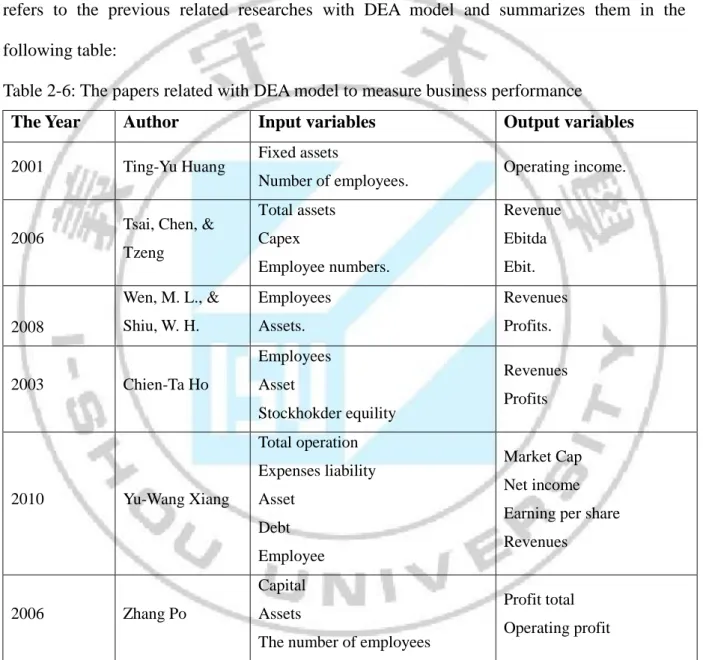
per share, revenue per person and each business interests are six output variables.This study
refers to the previous related researches with DEA model and summarizes them in the
following table:
Table 2-6: The papers related with DEA model to measure business performance
The Year Author Input variables Output variables
2001 Ting-Yu Huang Fixed assets
Number of employees. Operating income. 2006 Tsai, Chen, &
Tzeng Total assets Capex Employee numbers. Revenue Ebitda Ebit. 2008 Wen, M. L., & Shiu, W. H. Employees Assets. Revenues Profits. 2003 Chien-Ta Ho Employees Asset Stockhokder equility Revenues Profits 2010 Yu-Wang Xiang Total operation Expenses liability Asset Debt Employee Market Cap Net income Earning per share Revenues
2006 Zhang Po
Capital Assets
The number of employees
Profit total Operating profit
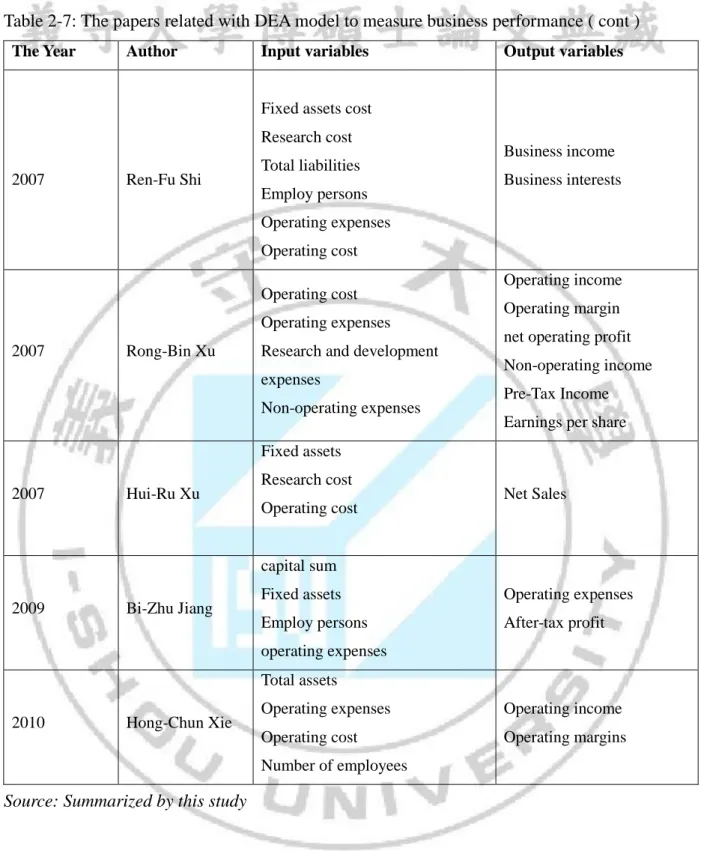
Table 2-7: The papers related with DEA model to measure business performance ( cont )
The Year Author Input variables Output variables
2007 Ren-Fu Shi
Fixed assets cost Research cost Total liabilities Employ persons Operating expenses Operating cost Business income Business interests 2007 Rong-Bin Xu Operating cost Operating expenses Research and development expenses
Non-operating expenses
Operating income Operating margin net operating profit Non-operating income Pre-Tax Income Earnings per share
2007 Hui-Ru Xu
Fixed assets Research cost
Operating cost Net Sales
2009 Bi-Zhu Jiang capital sum Fixed assets Employ persons operating expenses Operating expenses After-tax profit 2010 Hong-Chun Xie Total assets Operating expenses Operating cost Number of employees Operating income Operating margins
Chapter 3 METHODOLOGIES
3.1
Research Sample Selection
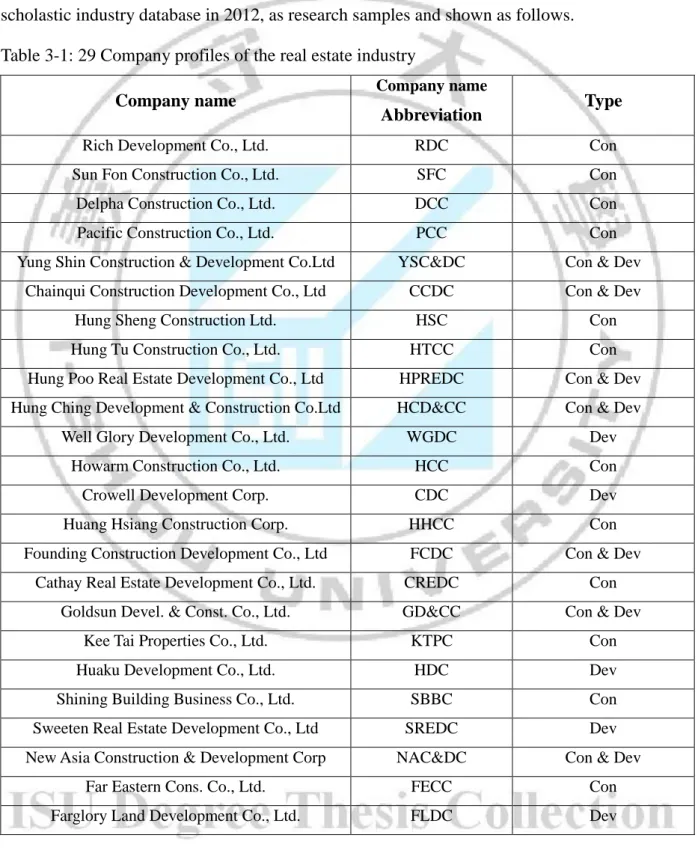
This study takes 29 of the Real Estate industry in the builder of the data from Taiwan
scholastic industry database in 2012, as research samples and shown as follows.
Table 3-1: 29 Company profiles of the real estate industry
Company name Company name
Abbreviation Type
Rich Development Co., Ltd. RDC Con Sun Fon Construction Co., Ltd. SFC Con Delpha Construction Co., Ltd. DCC Con Pacific Construction Co., Ltd. PCC Con Yung Shin Construction & Development Co.Ltd YSC&DC Con & Dev
Chainqui Construction Development Co., Ltd CCDC Con & Dev Hung Sheng Construction Ltd. HSC Con Hung Tu Construction Co., Ltd. HTCC Con Hung Poo Real Estate Development Co., Ltd HPREDC Con & Dev Hung Ching Development & Construction Co.Ltd HCD&CC Con & Dev
Well Glory Development Co., Ltd. WGDC Dev Howarm Construction Co., Ltd. HCC Con Crowell Development Corp. CDC Dev Huang Hsiang Construction Corp. HHCC Con Founding Construction Development Co., Ltd FCDC Con & Dev
Cathay Real Estate Development Co., Ltd. CREDC Con Goldsun Devel. & Const. Co., Ltd. GD&CC Con & Dev
Kee Tai Properties Co., Ltd. KTPC Con Huaku Development Co., Ltd. HDC Dev Shining Building Business Co., Ltd. SBBC Con Sweeten Real Estate Development Co., Ltd SREDC Dev New Asia Construction & Development Corp NAC&DC Con & Dev
Far Eastern Cons. Co., Ltd. FECC Con Farglory Land Development Co., Ltd. FLDC Dev
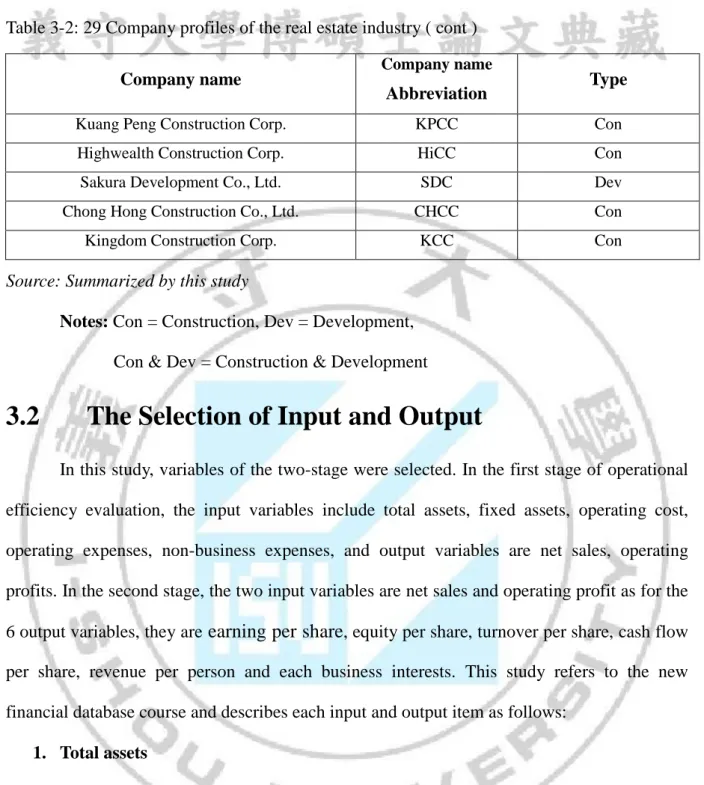
Table 3-2: 29 Company profiles of the real estate industry ( cont )
Source: Summarized by this study
Notes: Con = Construction, Dev = Development,
Con & Dev = Construction & Development
3.2
The Selection of Input and Output
In this study, variables of the two-stage were selected. In the first stage of operational
efficiency evaluation, the input variables include total assets, fixed assets, operating cost,
operating expenses, non-business expenses, and output variables are net sales, operating
profits. In the second stage, the two input variables are net sales and operating profit as for the
6 output variables, they are earning per share, equity per share, turnover per share, cash flow
per share, revenue per person and each business interests. This study refers to the new
financial database course and describes each input and output item as follows:
1. Total assets
Refers to the enterprise formed by past transactions or other events that are owned or
controlled by the enterprise, is expected to bring economic benefits to the enterprise resources.
Business profits = current assets + long-term investments, fixed assets and other assets
2. Fixed assets
Use fixed number of year in more than one year, and it is used in a business, and not to
ship for the purpose of tangible assets.
Company name Company name
Abbreviation Type
Kuang Peng Construction Corp. KPCC Con Highwealth Construction Corp. HiCC Con Sakura Development Co., Ltd. SDC Dev Chong Hong Construction Co., Ltd. CHCC Con Kingdom Construction Corp. KCC Con
3. Operating cost
For sales when the cost of the shipment of goods
4. Operating expenses
Operating expenses = operating margin + affiliate companies have (not) to implement
sales gross margin
5. Non-business expenses
The costs of not directly related to the business, such as interest payments, exchange
risk, sell assets loss, etc.
6. Net sales
Gross revenues - sales returns and allowances
7. Business profits
Business profits = has achieved sales gross margin - operating expenses
8. Earnings per share
Consolidated profit after deducting special stock dividends, according to the weighted
average number of shares of the current earnings per share.
9. Equity per share
The Unconsolidated: equity per share = shareholders equity/(common stock shares +
special stock number of shares (equity) under + share proceeds in advance (shareholders
equity) under about when issuing shares held by the parent company - the parent company and
subsidiary stock shares called).
The consolidated: equity per share = (shareholders' equity - a minority stake)/(common
stock shares + special stock number of shares (equity) under + items (under a shareholder's
rights) in advance about when the issue of shares held by the parent company - the parent
10. Turnover per share
Turnover per share is defined as the turnover divided by the number of ordinary shares
in issue, expressed in pence. The formula is the following:
Turnover per share = (turnover / shares in issue) * 100
11. Cash flow per share
Is the company's operating cash flow per share business brought about by the net cash
flow minus preferred stock dividends and the ratio of the number of shares outstanding
common stock
Cash flow per share = (net cash flow from operating business - preferred stock
dividends)/number of shares outstanding common stock
12. Revenue per person
Each revenue = operating income/the number of employees
13. Each business interests
Each business interests = business profit /the number of employees
3.3
Research Model
This study uses data envelopment analysis for assessment of the effectiveness of
enterprises, including enterprise's profitability, market capacity and phase model conceptual
framework, profitability and the market capacity to evaluate business performance (Seiford
and Zhu, 1999; Zhu, 2000; Luo, 2003). The first stage has five input items which are total
assets, fixed assets, operating cost, operating expenses, non-business expenses, and has net
sales, operating profits as two output items as the evaluation of the efficiency to operate. The
second stage has net sales, operating profits as two input variables, earning per share, equity
per share, turnover per share, cash flow per share, revenue per person and each business
Figure 3-1: The First Stage and the Second Stage
3.4
Analytical Approach
This study uses a two-stage Data Envelopment Analysis to evaluate Operating
efficiency and Marketing efficiency of 29 Taiwanese Real Estate companies. Based on data in
2012, we apply DEA-Solver software to calculate the technical efficiency (TE), pure technical
efficiency (PTE) and scale efficiency (SE) of the efficiency value. Accordingly, it can be
determined that which Real Estate company has achieved the best operational efficiency, and whether or not each real estate company’s efficiency has performance in average. For the poor performance of Real Estate providers, this study may provide the Real Estate companies in
Taiwan with the information that which inputs and outputs should be reduced or added, , and
present suggestions including area for improvement. .
It is required that performance input and output data be non-negativity numbers and at
least one input and output be greater than 0. When the unit of negative value is rarely, the
output of negative value can be replaced by a smallest positive number economics (Chiang
Gao, Nan-Xu Huang, Toshiyuki, 2003). In the process of gathering data, this study also shows
negative input and output data. Therefore this research uses 10-6 instead of the negative
The relationship between the input and output items must Isotonicity that is, in the
same conditions, when the inputs increase, the output does not reduce (Qiao-Pin Bao, 2005).
And this study applies Pearson’ the Correlation coefficient analysis and its value represent the
significance as following table:
Table 3-3: Pearson Correlation coefficient of representative significance
In the first stage this study presents the results of a preliminary analysis of input and
output correlation coefficient as following table:
Table 3-4: The correlation coefficient between inputs, outputs of the first stage
Total assets Fixed assets Operating costs Operating expenses Non-Operating expenses
Net Sales Operating profit Total assets 1 Fixed assets 0.374 1 Operating costs 0.815 0.358 1 Operating expenses 0.911 0.271 0.785 1 Non-Operating expenses 0.704 0.058 0.453 0.661 1 Net Sales 0.890 0.278 0.947 0.873 0.560 1 Operating profit 0.781 0.080 0.641 0.764 0.580 0.849 1
Source: Summarized by this study
Correlation coefficient (r) Degree of correlation
Above 0.8 Extremely high
0.6~0.8 High
0.4~0.6 Average
0.2.~0.4 Low
Table 3-1: The correlation coefficient between inputs, outputs of the second stage Net Sales Operating profit Earning Per share Equity Per Share Turnover per share Cash flow per share Revenue per person Each business interests Net Sales 1 Operating profit 0.849 1 Earning Per share 0.401 0.709 1 Equity Per Share 0.619 0.826 0.766 1 Turnover per share 0.648 0.686 0.783 0.697 1 Cash flow per
share 0.032 0.253 0.754 0.449 0.592 1 Revenue per
person 0.505 0.620 0.562 0.563 0.521 0.204 1 Each business
interests 0.474 0.767 0.857 0.732 0.644 0.418 0.807 1
Chapter 4 RESULT AND DISCUSSION
4.1
The First Stage Efficiency Analysis
4.1.1 Descriptive Statistics
At the first stage, this study directs at Taiwan 29 Real Estate companies, analyze the
relative operational efficiency with descriptive statistics of each DMU input and output
variables as table 4-1:
Table 4-1: The input, output variables of the First stage
X1 (Billion NTD ) X2 (Billion NTD ) X3 (Billion NTD ) X4 (Billion NTD ) X5 (Billion NTD ) M1 (Billion NTD ) M2 (Billion NTD ) Max 73.751 8.759 12.568 2.171 0.589 20.665 6.083 Min 0.697 0.008 0.000 0.025 0.001 0.000 0.000 Average 18.008 1.029 2.800 0.377 0.116 4.522 1.318 SD 18.213 1.751 3.089 0.442 0.137 4.892 1.838
Source: Summarized by this study
Notes:
X1 = Total assets, X2 = Fixed assets, X3 = Operating costs,X4 = Operating expenses, X5 = Non-Operating expenses,
M1 = Net Sales, M1 = Operating profit
4.1.2 Efficiency Analysis
From table 3-3 we can see that, in this study, we select input and output variables to
ensure compliance with relevant evaluation criteria. Therefore, we can apply the DEA-solver
software to calculate the efficiency value of Technical Efficiency (TE), Pure Technical
Efficiency (PTE) and Scale Efficiency (SE). But the results of Technical Efficiency are
calculated sorting as table 4-2. In the CCR model, when efficiency value equal 1, on behalf of
see, 29 Real Estate companies in the first stage efficiency evaluation relatively efficient
companies, respectively YSC&DC, WGDC, CDC, HHCC, KTPC, HDC, NAC&DC, FECC and CHCC 9 companies ( 31,03 %), on behalf of its input and output in the current has the best
configuration, on the business is also more efficient. The remaining 21 companies obviously
have inefficient units (68.97%).
From the foregoing, most of the evaluation units in the first stage of DEA are in
efficient and inefficient states.
Table 4-2: The first stage evaluation model of computing efficiency value
DMU TE PTE SE RTS RDC 0.689 0.730 0.943 Constant SFC 0.745 1 0.745 Increasing DCC 0.541 0.845 0.640 Increasing PCC 0.509 0.509 1 Constant YSC&DC 1 1 1 Constant CCDC 0.644 0.717 0.897 Increasing HSC 0.714 0.715 0.999 Constant HTCC 0.409 1 0.409 Increasing HPREDC 0.642 0.676 0.949 Increasing HCD&CC 0.608 0.904 0.673 Increasing WGDC 1 1 1 Constant HCC 0.455 0.523 0.869 Increasing CDC 1 1 1 Constant HHCC 1 1 1 Constant FCDC 0.608 0.613 0.992 Increasing CREDC 0.522 0.522 1 Constant GD&CC 0.640 0.773 0.828 Decreasing KTPC 1 1 1 Constant HDC 1 1 1 Constant SBBC 0.815 0.934 0.872 Increasing SREDC 0.538 0.552 0.975 Increasing NAC&DC 1 1 1 Constant FECC 1 1 1 Constant FLDC 0.623 1 0.623 Decreasing KPCC 0.588 1 0.588 Increasing HiCC 0.793 1 0.793 Decreasing
SDC 0.493 1 0.493 Increasing
CHCC 1 1 1 Constant
KCC 0.524 0.524 0.999 Increasing
Average value 0.728 0.846 0.872 -
Source: Summarized by this study
Because of the technical efficiency (TE)= pure technical efficiency (PTE)* scale
efficiency (SE), so this study apply DEA-Solver software with CCR model to calculated TE
and BCC model to calculated PTE, to obtain the scale efficiency (SE) and scale reward
situation, to learn more about the reasons of the management inefficiency. The results of
Increasing return to scale (IRS), Constant return to scale (CRS) and Decreasing return to scale
(DRS) all settled as table 4-2. In the table 4-2, 29 real estate companies get the average pure
technical efficiency is 0.846 that mean resource configuration and administrative decision
were good, so got the good operational efficiency, the average scale efficiency is 0.872, higher
than the average pure technical efficiency, so if we want to improve the operational efficiency
situation, then we can adjust the pure technology, to have a good the improvement strategy.
4.1.3 Efficiency Improvement
At the first stage of the DEA analysis, there are total 20 companies not equal 1,
indicates that both the relative inefficiency and in the business there is still room for
improvement. This study is using the slack analysis of the CCR model, against the first stage
of each assessment unit of input, output variables and provide improvement advice and the
relevant suggestions as the table 4-3 below:
Table 4-3: The first stage for improvement suggestions of input, output
DMU Score X1 X2 X3 X4 X5 M1 M2 S-1 S -2 S -3 S -4 S -5 S + 1 S + 2 RDC 0.689 6.118 1.574 0.000 0.000 0.026 0.000 1.552 SFC 0.745 0.034 0.313 0.000 0.025 0.000 0.000 0.150 DCC 0.541 1.641 0.003 0.000 0.019 0.000 0.000 0.153 PCC 0.509 2.105 1.188 0.000 0.190 0.087 0.000 1.083
YSC&DC 1 0.000 0.000 0.000 0.000 0.000 0.000 0.000 CCDC 0.644 0.000 0.328 0.000 0.179 0.014 0.000 0.590 HSC 0.714 9.945 0.833 0.000 0.000 0.018 0.000 0.052 HTCC 0.409 0.138 0.051 0.000 0.000 0.140 0.000 0.069 HPREDC 0.642 0.000 0.000 0.000 0.027 0.063 0.000 1.147 HCD&CC 0.608 5.584 0.002 0.000 0.000 0.065 0.000 0.519 WGDC 1 0.000 0.000 0.000 0.000 0.000 0.000 0.000 HCC 0.455 1.467 0.000 0.000 0.053 0.062 0.000 0.202 CDC 1 0.000 0.000 0.000 0.000 0.000 0.000 0.000 HHCC 1 0.000 0.000 0.000 0.000 0.000 0.000 0.000 FCDC 0.608 0.000 0.845 0.000 0.000 0.022 0.000 1.089 CREDC 0.522 0.000 4.235 0.000 0.071 0.011 0.000 2.955 GD&CC 0.640 7.352 1.974 0.000 0.000 0.017 0.000 3.146 KTPC 1 0.000 0.000 0.000 0.000 0.000 0.000 0.000 HDC 1 0.000 0.000 0.000 0.000 0.000 0.000 0.000 SBBC 0.815 7.214 0.000 0.000 0.271 0.024 0.000 0.613 SREDC 0.538 0.000 0.116 0.000 0.006 0.000 0.000 0.913 NAC&DC 1 0.000 0.000 0.000 0.000 0.000 0.000 0.000 FECC 1 0.000 0.000 0.000 0.000 0.000 0.000 0.000 FLDC 0.623 0.000 0.904 0.000 0.042 0.322 0.000 4.021 KPCC 0.588 0.000 0.068 0.000 0.004 0.000 0.000 0.094 HiCC 0.793 0.000 0.000 0.000 0.486 0.000 0.000 3.114 SDC 0.493 0.586 0.024 0.000 0.005 0.000 0.000 0.261 CHCC 1 0.000 0.000 0.000 0.000 0.000 0.000 0.000 KCC 0.524 5.544 0.056 0.000 0.000 0.081 0.000 1.464
Source: Summarized by this study
Notes:
X1 = Total assets, X2 = Fixed assets, X3 = Operating costs,
X4 = Operating expenses, X5 = Non-Operating expenses,
M1 = Net Sales, M1 = Operating profit
From table 4-3 and the Appendix C, the improvement suggestion of inefficiency DMU
as RDC in total asset have to reduce 12.925 billion NTD, Fixed assets reduce 2.405 billion
NTD, Non-Operating expenses reduce 0.044 billion NTD and the Operating profit have to
increase 1.552 billion NTD, So can be relatively efficient, and by parity of reasoning. Can