三項分配下共同基金經理人之從眾行
為-以台灣股票型基金為例
Estimation of Fund Managers’ Herding Behavior by
Trinomial Distribution Method: An Empirical
Investigation of Equity Mutual Fund in Taiwan
呂素蓮 Su-Lien Lu*
國立聯合大學 財務金融學系
Department of Finance, National United University
李世英 Si-In Lee
新光銀行 消費金融部
Taiwan Shin Kong Commercial Bank Department of Consumer Financial Business
摘 要:近年來台灣理財觀念普及,投資標的發展日新月異,然而,大多數 投資人缺乏時間及資訊,共同基金逐漸成為社會大眾重要的理財工具,為了 更深入探究股票市場上共同基金經理人之投資行為,本研究透過三項分配驗 證國內基金經理人之從眾行為。由於過去研究多以二項分配衡量基金經理人 的從眾行為,亦即只考慮到買入、賣出兩個交易方向,忽略了持有之交易方 向,故本研究主要貢獻在於考慮持有之交易行為,進而將傳統的二項分配擴 充為三項分配,共包含:買入、賣出與持有三種交易方向,以三項分配求算從 眾行為指標,並且與二項分配之從眾行為指標值相互比較。 *
Corresponding author: Department of Finance, National United University, Miao-Li, Taiwan E-mail: [email protected]
首先,本研究發現台灣基金經理人的確存在從眾行為,此外,三項分配 所求出之從眾行為指標值明顯小於二項分配所求之值,顯示二項分配下可能 會高估從眾行為指標值。其次,公司規模、當期股票報酬、基金績效皆會導 致基金經理人產生從眾行為,一般而言,由於規模較小公司之資訊取得不易, 因此有較明顯的從眾行為;至於當期股票報酬高者,買入從眾現象較為顯著, 而當期股票報酬低者,則賣出從眾較明顯;而基金績效差者,基金經理人基 於聲譽風險的考量,會採用從眾策略。最後,根據從眾行為所建構之投資組 合,發現買入從眾與賣出從眾所形成之投資組合的超額報酬存在顯著差異 性,然而,此差異性會隨時間經過逐漸遞減,因此,就長期而言,台灣基金 經理人之從眾行為具有穩定股票市場股價之功能。 關鍵詞:從眾行為、三項分配、二項分配
Abstract : The purpose of this paper is to examine the herding behavior of fund
managers by using a trinomial distribution method, extended from the traditional binomial distribution one. The trinomial distribution method considers three trade directions, namely buy, sell and hold. However, previous studies often neglected the trade direction of hold..
The empirical results show that the herding behavior is closely related to the firm size, stock returns and mutual fund performance. First, we find significant herding behavior of equity mutual fund managers in Taiwan. Furthermore, we find that the binomial distribution may overestimate the herding behavior owing to ignoring the trade direction - hold. Second, the detected level of herding is higher for the smallest size stock, as was found by Wermers (1999). Third, buy-herding is strong in high current-return stocks and sell-herding is strong in low current-return stocks. Therefore managers tend to adopt positive-feedback strategy to buy winners and sell losers. Fourth, managers tend to herd in funds with worse performance based on reputation, as was found by Scharfstein and Stein (1990). Finally, the herding behaviors of fund managers may stabilize the stock market for a long time.
Keywords:Herding behavior; Trinomial distribution; Binomial distribution
1. Introduction
Mutual funds pool the resources of many small investors by selling those shares in the fund and investing in diversified portfolios assets. Through the asset transformation process of issuing shares in small denominations and buying large blocks of securities, mutual funds can take advantage of volume discounts on brokerage commissions and can purchase diversified portfolios of securities. Mutual funds allow small investors to obtain the benefits of lower transaction costs in purchasing securities and to take advantage of a reduction in risk by diversifying their portfolios.
Recently, there has been a tremendous growth in Taiwan’s mutual fund industry. Since the first four investment-trust corporations were founded in 1983, the number of mutual fund corporations has increased to 45 by May 2006, which altogether manage 504 mutual funds, whose market value is 1,961,771 million. Among them are 249 equity funds with a market value of 412,889 million. On the other hand, there are many classes of mutual funds that are available to investors such as balanced funds and bond funds.
In general, there are two aspects of investigation of mutual funds. One is to investigate mutual fund performance, such as traditional performance valuing model (Treynor, 1965;Sharp, 1966;Jensen, 1968), market timing model (Fama, 1972;Henriksson and Merton, 1981), and studies of funds’ cash flow and performance (Ippolito, 1992;Sirri and Tufano, 1998).
The other aspect is to investigate the fund manager’s investment decision and behavior. Under certain circumstances, managers may simply mimic the
investment decisions of other managers and ignore substantive private information. Although this behavior is inefficient from a social standpoint, it can be rational from the perspective of managers who are concerned about their reputation. Therefore managers might follow other managers’ decisions and trade together, which is called herding behavior.
There are several reasons for herding behavior. First, managers may trade together based on reputation (Scharfstein and Stein, 1990;Lakonishok et al., 1992 ;Devenow and Welch, 1996). Second, managers may infer information about the quality of investments from each other and result in herding, which is called information cascade (Shiller and Pound 1989;Banerjee, 1992;Bikhchandani et al., 1992). Third, managers may trade together because they receive similar information for doing the same decisions (Froot et al., 1992; Hirshleifer et al., 1994). Fourth, from the managers’ perspective, the strategy of adding winners to the portfolio and eliminating loser has the added advantage of removing embarrassments from the portfolio for the sake of sponsors. Therefore they may trade together due to window dressing (Lakonishok et al., 1991).
Wylie (2005) finds that Lakonishok et al. (1992) assume the ex-ante probability of a manager buying rather than selling a stock, that is, they exclude short selling stocks, which is unsuitable for real data sets. Thus Wylie (2005) suppose initial stock holding as a dummy variable and employ logit regression to estimate herding measures. This paper relaxes the prior assumptions by adding another trade direction - hold. If we ignore this trade, the estimated results may be distorted. Consequently, this study considers three trade directions: buy, sell and hold, and extend traditional binomial distribution to trinomial distribution to investigate the herding behavior of equality mutual fund managers in Taiwan.
binomial distribution to trinomial distribution, including three trade directions: buy, sell and hold. Wylie (2005) suggests nonzero level of herding, even when no herding exists, because of the invalid assumption that all managers can’t short sell all stocks. However, this study focuses on a trade direction - hold, which is different from the point of Wylie (2005), who emphasizes that managers can short sell stocks. Unlike Wylie (2005), this study does not employ dummy variables and the logit regression.
Second, several firm characteristics have impacted on manager’s herding behavior, such as firm size (Lakonishok et al., 1992;Choe et al., 1999;Wermers, 1999), stock returns (Shiller and Pound, 1989;Banerjee, 1992;Bikhchandani et al., 1992;Warther, 1995;Sias and Starks, 1997), and mutual fund performance (Scharfstein and Stein, 1990;Devenow and Welch, 1996). Thus this study estimates the manager’s herding behavior by grouping sample into several subgroups that are ranked by firm size, stock returns and mutual fund performance.
Finally, this study forms 10 portfolios that are ranked by sell-herding and buy-herding to investigate whether the manager’s herding behavior stabilize or destabilize stock market. Consequently, this study estimates the manager’s herding behavior by trinomial distribution and compares those estimated by binomial distribution. We expect that the findings of this paper are more meaningful for investigating mutual funds in Taiwan.
This paper is organized as follows. Section 1 is introduction, and section 2 describes the related references. Section 3 suggests hypotheses about herding. Section 4 describes the data and methodology used to compute the herding measure under binomial and trinomial distributions. Sample data are presented in section 5. Empirical results are presented in section 6, and the paper is concluded
in section 7.
2. Literature Review
There are several reasons for explaining the herding behavior of fund managers. For Keynes (1936), investors may be reluctant to act according to their own information and beliefs due to the fear that their contrarian behavior will damage their reputation. Thus Keynes suggests that professional managers will trade with the crowd if they are concerned about how others will assess their ability to make sound judgments.
Recently, the reason for herding behavior is not just the reputation of Keynes (1936). There are four popular theories explaining why managers might trade together. First, managers may disregard their private information and mimic other managers due to the reputation risk and sharing-the-blame (Scharfstein and Stein, 1990). Furthermore, Lakonishok et al. (1992) and Devenow and Welch (1996) found that managers might trade with the crowd and make similar decisions resulting from protecting their reputation from attack.
Second, managers may trade together simply because they receive correlated private information, perhaps from analyzing the same indicators (Froot et al., 1992; Hirshleifer et al., 1994). Third, managers may infer private information from the prior trades of better-information managers and trade in the same direction ( Banerjee, 1992;Bikhchandani et al., 1992;Welch, 1992). Fourth, managers may adopt the trading strategy of adding winners to the portfolio and eliminating losers has the added advantage of removing embarrassments from the portfolio for the sake of the sponsors (Lakonishok et al., 1991).
Studies of the trading of fund managers are a large part of the empirical literature on herding. Lakonishok et al. (1992) use 769 tax-exempt (predominantly pension) funds to evaluate the manager’s trading behavior. They address two aspects of trading by these managers: herding, which refers to buying (selling)
simultaneously the same stocks as other managers buy (sell), and positive-feedback trading, which refers to buying past winners and selling past losers. They find that managers have significant herding behavior and adopt positive-feedback strategy. Wermers (1999) modified herding measures to conditional herding measures, buy-herding and sell-herding, to measure 20 years of U.S. mutual funds data and found substantial herding. He found that stocks strongly bought by herds outperform those strongly sold by herds, which is especially pronounced among small stocks and herd in growth-oriented funds is related to positive-feedback trading strategies. Further, managers herd on new information about the future prospects of firms and help to speed the incorporation of this new information into prices. Choe et al. (1999) found surprisingly large levels of herding in the Korean equity market in 1997 by herding measures of Lakonishok et al. (1992). Chang et al. (2000) studied herding by fund managers in the United States, Hong Kong, South Korea, and Japan and found evidence of herding in South Korea and Taiwan but not elsewhere.
Wylie (2005) found that the herding statistics of Lakonishok et al. (1992) should be expected to a nonzero level, even when no herding exists, since Lakonishok et al. (1992) assume that managers cannot short sell all stocks.On the other hand, when the propensity to buy is conditioned by a fund manager’s initial holding in a stock, the number of managers who buy the stock is no longer a binomially distribution with a constant propensity to buy, and the expected value of the herding measures of Lakonishok et al. (1992) may be nonzero. However, Wylie (2005) doesn’t extend the binomial distribution; he employs logit regression that treats the dependent variables as outcomes. That is, he emphasizes that managers can short sell without emphasizing the trade direction - hold.
Lakonishok et al. (1992) find that managers adopt positive-feedback trading strategy that tends to buy winners and sell losers when they trade with the herd. Grinblatt et al. (1995) find that 77 percent managers are momentum investors by
buying stocks that were past winners. On average, funds that invested on momentum realized significantly better performance than other funds. Christie and Huang (1995) examine the investment behavior of market participants in the U.S. equity market by utilizing the cross-sectional standard deviation of returns (CSSD) and they develop a test of herd behavior. They find no evidence of herding when stock prices are extremely volatile. Chang et al. (2000) modify CSSD, they examine the presence of herding across both developed and developing financial markets including the U.S., Hong Kong, Japan, South Korea, and Taiwan. They found no evidence of herding on the part of market participants in the U.S. and Hong Kong, but partial evidence of herding in Japan. However, for South Korea and Taiwan, the two emerging markets in their sample document significant evidence of herding.
Consequently, this paper focuses on three aspects as follows. First, we will extend traditional binomial distribution to trinomial distribution for testing the equality mutual fund manager’s herding behavior in Taiwan. Second, we further group mutual funds into several subgroups that are ranked by stock size, stock returns, and mutual fund performance to test the manager’s herding behavior. Furthermore, we compare the differences of herding between binomial and trinomial distributions. Finally, we also investigate whether the herding behavior tends to stabilize or destabilize stock market.
3. Hypotheses
A part of previous studies found significant evidences of herding behavior of fund managers. Several factors such as firm size, stock returns, and mutual fund performance have influence on herding. On the other hand, the positive-feedback trading strategy may interfere with stock market. Therefore we postulate several hypotheses for testing the herding behavior of managers.
(1) Manager’s herding behavior estimated by binomial distribution and trinomial distribution in Taiwan
Scharfstein and Stein (1990), Banerjee (1992), Bikhchandani et al. (1992), Froot et al. (1992), Lakonishok et al. (1992), Hirshleifer et al. (1994), Devenow and Welch (1996), Wermers (1999) and Wylie (2005) all find that fund managers may herd due to several reasons, such as window-dressing and reputation. First, we present a measure of herding under binomial distribution and trinomial distribution to test whether Taiwanese managers tend to exhibit herd behavior and postulate the first hypothesis (H1) as follow.
H1: The equity mutual fund managers tend to trade with the herd in Taiwan.
On the other hand, this study extends binomial distribution to trinomial distribution by adding a trade direction - hold. Wylie (2005) suggests that the herding measure will decrease if conditioned by the manager’s initial holding. Thus, we postulate the second hypothesis (H2) as follow.
H2: The herding measure estimated by trinomial distribution will be lower than
that estimated by binomial distribution.
(2) Firm size and herding behavior
Lakonishok et al. (1992), Wermers (1999) and Choe et al. (1999) found that managers prefer to herd on small stocks than on large stocks due to small stocks have incomplete information and illiquidity. Therefore, to avoid falling behind a peer group by following a unique investment strategy, they have an incentive to hold the same stocks as other managers (Scharfstein and Stein, 1990). Thus, we postulate the third hypothesis (H3) as follow.
H3: The managers tend to herd on small stocks.
Warther (1995) and Sias and Starks (1997) suggest that stock return is related to fund manager’s herding behavior. Shiller and Pound (1989) Banerjee (1992) and Bikhchandani et al. (1992) found that managers might infer private information, such as stock return, from other managers and trade together. Wermers (1999) find that U.K. mutual fund managers tend to herd on stocks with high returns. Therefore, we address fourth and fifth hypotheses to test whether or not past stock returns and current stock returns have impact on the manager’s herding behavior.
H4: The managers tend to herd on stocks with high current return.
H5: The managers tend to herd on stocks with high past return.
(4) Mutual fund performance and herding behavior
Since managers are concerned about the reputation and sharing-the-blame, they will trade with the crowd. Thus, if mutual funds have worst performance, managers may have significant herding behavior (Scharfstein and Stein, 1990). On the other hand, managers will momentum invest funds with better performance, but they don’t sell funds with worse performance. That non-linear relationship exists between mutual fund performance and herding behavior (Ippolito, 1992; Brown et al., 1996; Gruber, 1996; Carhart, 1997; Chevalier and Ellison, 1997). Thus we postulate the sixth hypothesis (H6) by one year fund performance to test whether or not the fund performance has influence on herding behavior. The sixth hypothesis means that managers will follow other managers’ trading strategy based on reputation (Scharfstein and Stein, 1990). Contrary to the sixth hypothesis, if funds have worse performance, they will lapse from other managers’ trade strategy. That is, their trading strategy will oppose those strategies of other managers.
H6: If mutual funds have worse performance, managers have more significant
(5) Market stabilization and herding behavior
Lakonishok and Smidt (1986) find that managers tend to buy past winners to earn abnormal return. Lakonishok et al. (1992) and Grinblatt et al. (1995) suggest that institution investors tend to adopt positive-feedback trading strategy to earn abnormal return. Wermers (1999) develops two conditional herding measures: buy-herding and sell-herding measures. He found different returns between stocks sold by herds and stocks bought by herds. However, these differences will decrease gradually. In other words, the herding behavior plays a beneficial role to stabilize the stock market.
Sias and Starks (1997) found some evidence that the manager’s trading reflects information and increase the speed of daily stock price adjustment. Therefore, this study uses conditional herding measures, buy-herding and sell-herding, to form several portfolios. Then we postulate the seventh hypothesis (H7) for testing whether herding behavior stabilizes or destabilizes the stock market.
H7: The manager’s herding behavior can stabilize stock market.
4. Methodology
4.1 Measurement of herding
For testing the herding behavior of managers, we use the measure of herding designed by Lakonishok et al. (1992). Letting is the measure of herding of stock i in period t, this measure is expressed as
t , i HM
( )
i,t i,t( )
i,t t , i t , i p E p Ep E p HM = − − − (1) t , i t , i t , i t , i S B B p + = (2)where, is the proportion of all mutual funds trading stock i in period t, including buyers and sellers; is the number of managers who buy stock i in period t (net buyers); is the number of managers who sell stock i in period t (net sellers); t , i p t , i B t , i S
( )
pi,tE is the expected proportion of buyers. We use the proportion of all stock trades by funds that are purchased during period t as a proxy for
( )
pi,tE . This proxy for the expected proportion of “buyers” is constant across all stocks during a given month and change only over time.
In particular, Epi,t −E
( )
pi,t is an adjustment factor under the nullhypothesis of no herding, which is easily calculated by using the assumption that trade directions are buy and sell as
( )
∑
(
( )
)
(
( )
)
( )
= − ⎭ ⎬ ⎫ ⎩ ⎨ ⎧ − ⋅ − ⋅ ⋅ = − N 0 B t , i t , i B N t , i B t , i N B t , i t , i t , i t , i t , i t , i N E p B p E 1 p E C p E p E (3)where N is the total mutual funds traded in the stock, including buy and sell. The herding measures are computed for each stock and then averaged across different subgroups. Thus, a positive and significant average HM is the evidence in favor of herding by funds.
According to previous studies, there are two trade directions, buy and sell. However, they ignore another trade direction - hold. This study develops a test of herding following trinomial distribution, which includes trade directions: buy, sell and hold. We assume that hold means number of managers who trade the stock is unchanged or below 20. Thus the adjustment factor Epi,t −E
( )
pi,t will follow trinomial distribution and can be modified as( )
{
(
( )
)
(
( )
)
( ) ( )
(
)
( )
⎭ ⎬ ⎫ − ⋅ − − × ⋅ ⋅ ⋅ = − − − − = − =∑ ∑
t , i t , i t , i t , i t , i t , i t , i t , i t , i t , i t , i t , i t , i t , i t , i B t , i S B N S B S S B B B N S N 0 B B N 0 S N B t , i t , i p E N B p E p E 1 p E p E C C p E p E (4)t , i t , i t , i t , i B H S B B p t , i = + + (5) t , i t , i t , i t , i S H S B S p t , i = + + (6)
where N is the total mutual funds trading the stock, including buy, sell and hold. The definitions of and are given above. In particular, is the number of managers who hold stock i in period t.
t , i B Si,t Hi,t
( )
pSi,t E is the expected proportions of buyers and( )
t , i
B
p
E is the expected proportions of sellers. Comparing equations (3) and (4), herding measures are different due to different adjustment factors. Consequently, this paper compares the differences of herding measures between binomial distribution ( ) and trinomial distribution
( ). t , i HM t , i M H ′
4.2 Measurement of buy- and sell-herding
Wermers (1999) modifies herding measures to conditional herding measures, which we call “buy herding measure” (BHM) and “sell herding measure” (SHM). They are described as
( )
i,t t , i t , i t , i HM p E p BHM = > (7)( )
i,t t , i t , i t , i HM p E p SHM = < (8)Equations (7) and (8) means there are only two trade directions: buy and sell under binomial distribution. Therefore, if mutual funds tend to sell stocks in herds much more frequently than they buy in herds, then SHM will be much larger than BHM. These conditional measures are also useful in analyzing stock returns following buying versus selling by a herd.
Wermers (1999) extends herding measure of Lakonishok et al. (1992) to conditional herding measures, buy- and sell-herding, based on binomial
distribution. This paper develops a test of herding based on trinomial distribution as follows.
( )
i,t t , i B B t , i t , i HM p Ep M BH ′ = ′ > (9)( )
i,t t , i S S t , i t , i HM p E p M SH ′ = ′ > (10)where BHM′i,t (SHM′i,t) is buy-herding (sell-herding) measure, which
means that the proportion of buyers (sellers) who buy (sell) stock i in period t is larger than HM′i,t. Consequently, averaging BHMi′,t separately from SHM′i,t is
useful in analyzing herding funds into stocks separately from herding out of stock.
5. Data
The sample data is obtained from two databases. One is the mutual fund database of Taiwan Economic Journal (TEJ), including portfolio holdings of equity funds, capital size and performance of mutual funds. The other one is the database of InforTimes Corporation, which include stock market capitalization, stock returns and market returns. There are 51 monthly data and 8,093 observations from January 2001 to March 2005. We omit three types of samples. First, we exclude prefer stocks, convertible bonds and warrants due to illiquidity. Second, we exclude stocks with price below 10 dollar that may distort the estimated results. Third, since the initial public offerings in the honeymoon period could take positive and significant cumulative abnormal return, this may result in buy-herding and distort the estimated results and we exclude such stocks.
On the other hand, we investigate the manager’s herding behavior from several aspects. Then we group the actual data set into several subgroups that are ranked by firm size, stock returns and mutual fund performance and are described in the following.
(1) Firm size: All stocks are ranked by current capitalization, which take as a proxy of firm size and then assigned to 5 subgroups.
(2) Stock returns: We form 5 subgroups by ranking past stock returns and current stock returns. The stock returns are calculated as
(
) (
)
(
)
[
1 r 1 r 1 r]
1 return stock = + 1 × + 2 ×L× + t −(
)
[
i /i 1]
*100 rt = t t−1 −where is the daily return in time t, t=1,…,T and is the closed price in time t.
t
r it
(3) Mutual fund performance: We group sample into 5 subgroups are ranked by past year cumulative returns.
6. Empirical results and analysis
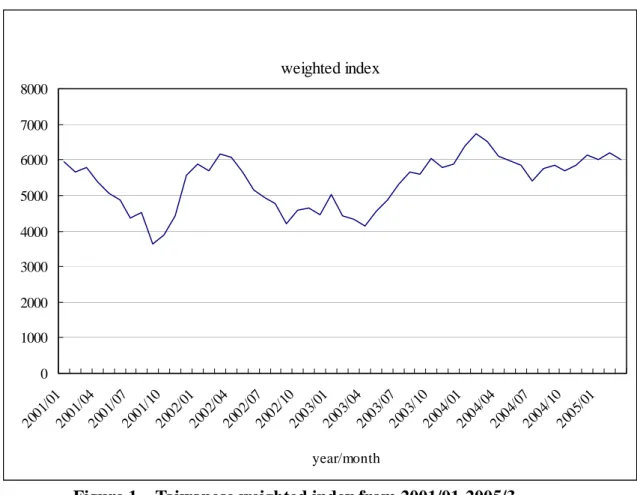
Figure 1 is the trend of Taiwanese weighted index from January 2001 to March 2005. The sample period contain complete cycle of Taiwanese stock market, including bear market and bull market. There was business recession in 2001 and then turn from trough to peak. Therefore, it is worth investigating managers’ herding behavior in this period. We will analyze managers’ herding behavior from several subjects as follows.
6.1 The managers’ herding behavior in Taiwan
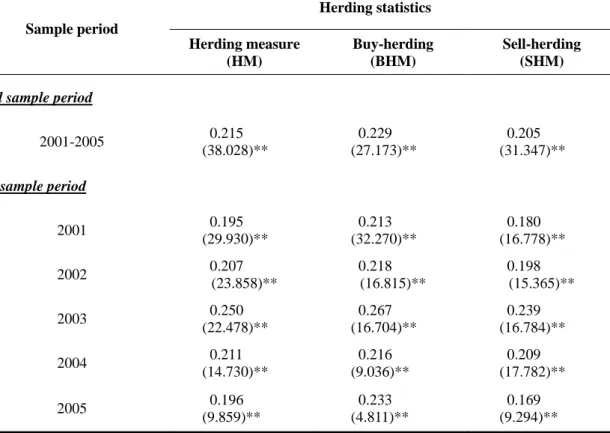
Tables 1 and 2 are herding statistics estimated by binomial distribution and trinomial distribution, respectively. The empirical results of herding statistics are significant on herding measures (HM andHM′), buy-herding (BHM and ) or sell-herding (SHM and ). These findings are consistent with Scharfstein and Stein (1990), Banerjee (1992), Bikhchandani et al. (1992), Froot et al. (1992), Lakonishok et al. (1992), Hirshleifer et al. (1994), Devenow and Welch (1996), Wermers (1999) and Wylie (2005). Consequently, the first hypothesis (H1) is proved.
M BH ′ M
weighted index 0 1000 2000 3000 4000 5000 6000 7000 8000 200 1/01 200 1/04 2001/ 07 2001/ 10 2002/ 01 2002/ 04 2002/ 07 2002/ 10 2003/ 01 2003/ 04 2003/ 07 2003 /10 2004 /01 2004 /04 200 4/07 2004/ 10 2005/ 01 year/month
Figure 1 Taiwanese weighted index from 2001/01-2005/3
Although there are many shocks, such as SARS (Severe Acute Respiratory Syndrome) and Iraq War, these shocks were temporary. There was business recession in 2001, and business cycle turn from the trough to peak in three years.
Furthermore, the government enacts policy to improve prosperousness, such as reduce tax rate. Thus, the empirical results show that statistics of buy-herding are higher than the statistics of sell-herding in the sample period.
Table 1 Herding statistics under binomial distribution
Herding statistics Sample period Herding measure (HM) Buy-herding (BHM) Sell-herding (SHM)Full sample period
2001-2005 0.215 (38.028)** 0.229 (27.173)** 0.205 (31.347)** Subsample period 2001 0.195 (29.930)** 0.213 (32.270)** 0.180 (16.778)** 2002 0.207 (23.858)** 0.218 (16.815)** 0.198 (15.365)** 2003 0.250 (22.478)** 0.267 (16.704)** 0.239 (16.784)** 2004 0.211 (14.730)** 0.216 (9.036)** 0.209 (17.782)** 2005 0.196 (9.859)** 0.233 (4.811)** 0.169 (9.294)**
Note 1. The values in parentheses are t-statistics.
2. (*) and (**) are denoted significant at 5% and 1% level, respectively.
Wylie (2005) suggests that the initial holding may reduce herding statistics, which means that the trade directions have impact on herding statistics. From Tables 1 and 2, herding statistics estimated by binomial distribution are higher than those statistics estimated by trinomial distribution. We conjecture the phenomenon due to ignore the trade direction - hold. That is, if we neglect the trade direction, hold, we may overestimate herding statistics that is consistent with Wylie (2005) and the second hypothesis (H2) in proved.
Table 2 Herding statistics under trinomial distribution
Sample Herding statistics period Herding measure
(H ′M ) Buy-herding (BHM′) Sell-herding (SHM′) Hold-herding (HHM′)
Full sample period
2001-2005 0.038 (7.576)** 0.107 (11.385)** 0.088 (14.680)** 0.055 (8.935)** Subsample period 2001 0.077 (7.101)** 0.107 (6.959)** 0.086 (8.295)** 0.119 (11.415)** 2002 0.045 (5.119)** 0.088 (6.955)** 0.094 (8.311)** 0.061 (6.971)** 2003 0.020 (3.660)** 0.111 (11.587)** 0.088 (5.934)** 0.021 (6.279)** 2004 0.018 (2.284)* 0.118 (8.405)** 0.083 (7.027)** 0.035 (6.770)** 2005 0.014 (3.711)** 0.121 (10.589)** 0.095 (8.713)** 0.022 (3.566)**
Note 1. The values in parentheses are t-statistics.
2. (*) and (**) are denoted significant at 5% and 1% level, respectively. 3.HHM′ is hold herding measure, which calculated as
) p ( E p M H M HH t , i t , i H H t , i t , i = ′ > ′
That means the proportion of managers who hold stock i in period t larger than HM′i,t.
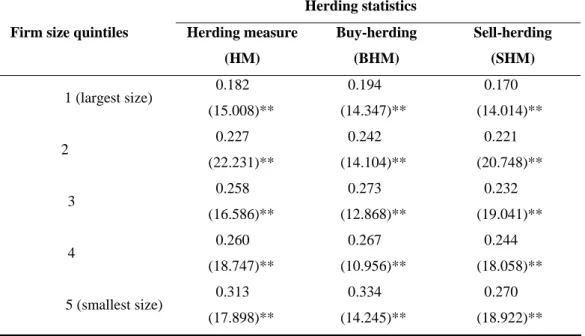
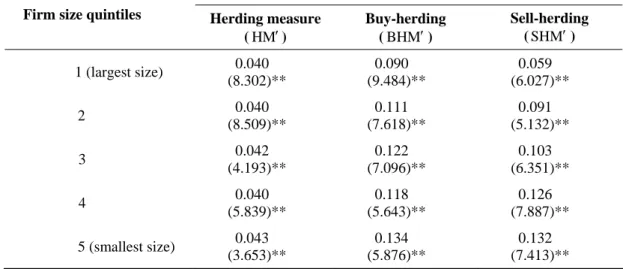
6.2 Firm size and herding behavior
In general, small firms disclose less information and stocks are more illiquid, which result in managers to follow other managers’ trading strategy and trade with the crowd. Tables 3 and 4 are herding statistics estimated by binomial and trinomial distributions and group sample into five subgroups that are ranked by firm size. Empirical results show that herding statistics are higher of small firms than those statistics of larger firms either in Table 3 or Table 4. For
example, the herding statistics are largest in quintile 5 (smallest firm). These findings are consistent with Lakonishok et al. (1992), Wermers (1999) and Choe et al. (1999) and the third hypothesis (H3) is proved.
6.3 Stock returns and herding behavior
Stock returns are the references of investors and managers for investment, that is, stock returns will affect the trading behavior of managers (Shiller and Pound, 1989;Banerjee, 1992;Bikhchandani et al., 1992;Warther, 1995;Sias and Starks, 1997;Wermers, 1999). Therefore, we analyze the managers’ herding behavior by grouping sample into 5 subgroups that are ranked by current stock returns and past stock returns.
Table 3 Herding statistics by firm size quintile under
binomial distribution
Herding statistics
Firm size quintiles Herding measure (HM) Buy-herding (BHM) Sell-herding (SHM) 1 (largest size) 0.182 (15.008)** 0.194 (14.347)** 0.170 (14.014)** 2 0.227 (22.231)** 0.242 (14.104)** 0.221 (20.748)** 3 0.258 (16.586)** 0.273 (12.868)** 0.232 (19.041)** 4 0.260 (18.747)** 0.267 (10.956)** 0.244 (18.058)** 5 (smallest size) 0.313 (17.898)** 0.334 (14.245)** 0.270 (18.922)** Note 1. The values in parentheses are t-statistics.
Table 4 Herding statistics by firm size quintile under trinomial
distribution
Herding statistics Firm size quintiles Herding measure
(H ′M ) Buy-herding (BHM′) Sell-herding (SHM′) 1 (largest size) 0.040 (8.302)** 0.090 (9.484)** 0.059 (6.027)** 2 0.040 (8.509)** 0.111 (7.618)** 0.091 (5.132)** 3 0.042 (4.193)** 0.122 (7.096)** 0.103 (6.351)** 4 0.040 (5.839)** 0.118 (5.643)** 0.126 (7.887)** 5 (smallest size) 0.043 (3.653)** 0.134 (5.876)** 0.132 (7.413)**
Note 1. The values in parentheses are t-statistics.
2. (*) and (**) are denoted significant at 5% and 1% level, respectively.
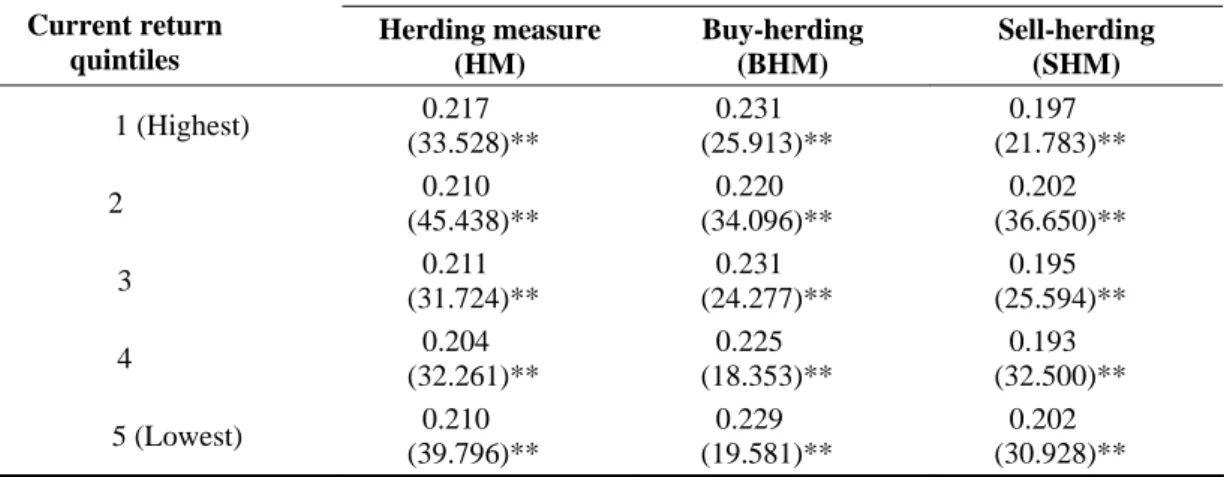
Tables 5 and 6 are herding statistics estimated by binomial and trinomial distributions that are ranked by current stock returns. For HM statistics, empirical results show that higher stock returns with higher HM means that the current stock returns affect the manager’s herding behavior. However, we find that there are no monotonic relationships among current stock returns, buy-herding and sell-herding in Table 5. In the example of buy-herding, the statistics of quintile 5 (lowest current-return stocks) is 0.229, which is higher than the statistics of quintile 2 (0.220). On the other hand, the statistics of quintile 1 (0.231) is higher than that of quintile 2 (0.220). In general, stock returns are the references of rate of return on investment, implying that investors prefer stock with high returns. Furthermore, we find that buy-herding measures (BHM) are higher than
Table 5 Herding statistics by current return quintile
under binomial distribution
Herding statistics Current return quintiles Herding measure (HM) Buy-herding (BHM) Sell-herding (SHM) 1 (Highest) 0.217 (33.528)** 0.231 (25.913)** 0.197 (21.783)** 2 0.210 (45.438)** 0.220 (34.096)** 0.202 (36.650)** 3 0.211 (31.724)** 0.231 (24.277)** 0.195 (25.594)** 4 0.204 (32.261)** 0.225 (18.353)** 0.193 (32.500)** 5 (Lowest) 0.210 (39.796)** 0.229 (19.581)** 0.202 (30.928)**
Note 1. The values in parentheses are t-statistics.
2. (*) and (**) are denoted significant at 5% and 1% level, respectively.
Table 6 Herding statistics by current return quintile under
trinomial distribution
Herding statistics Current returns quintiles Herding measure
(H ′M ) Buy-herding (BHM′) Sell-herding (SHM′) 1 (Highest) 0.061 (12.477)** 0.133 (17.572)** 0.063 (6.866)** 2 0.047 (12.953)** 0.114 (13.692)** 0.074 (9.084)** 3 0.042 (10.647)** 0.089 (11.089)** 0.077 (10.897)** 4 0.036 (10.182)** 0.081 (8.045)** 0.087 (12.651)** 5 (Lowest) 0.040 (9.968)** 0.079 (5.606)** 0.100 (13.435)**
Note 1. The values in parentheses are t-statistics.
sell-herding measures (SHM) of either high stock return or low stock return. These findings estimated by binomial distribution are more unreasonable.
For the empirical results estimated by trinomial distribution, the statistics of high stock return classes (quintile 1-3 in Table 6) show that buy-herding measures are larger than sell-herding measures. On the contrary, the low stock return classes (quintile 4-5 in Table 6) show that the sell-herding measures are larger than buy-herding measures. These findings in Table 6 are more reasonable, implying that managers buy winners and sell losers (Lakonishok and Smidt, 1986;Grinblatt et al., 1995;Wermers, 1999). On the other hand, buy-herding measures rise monotonously with increasing stock returns. Similarly, sell-herding measures descend monotonously with decreasing stock returns. Consequently, if we ignore the trade direction, hold, the estimate result may be distorted. That is, the trade direction, hold, plays an important role while investigating managers’ herding behavior. Consequently, the fourth hypothesis (H4) is proved in Table 6.
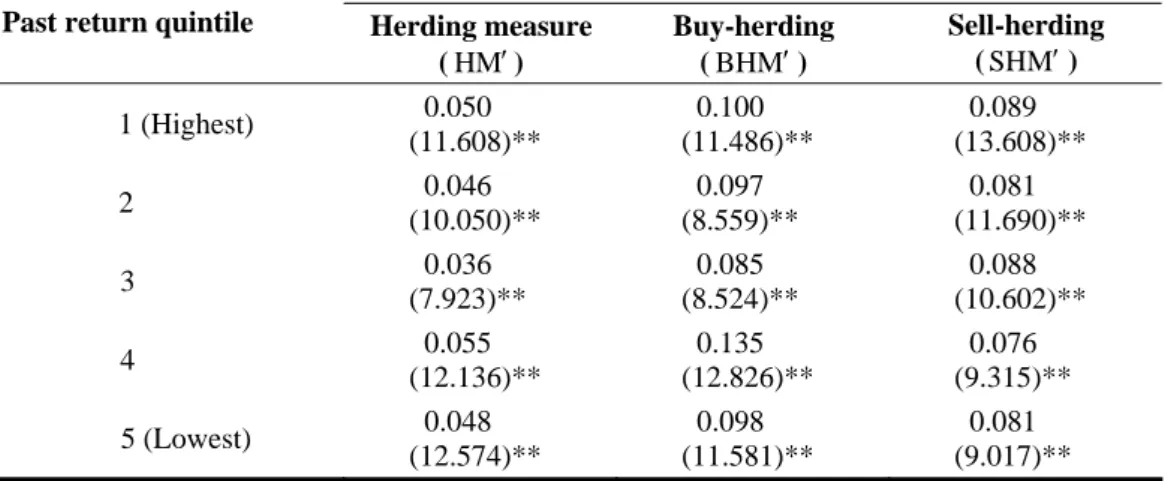
Tables 7 and 8 show herding statistics estimated by binomial and trinomial distributions that are grouped into 5 subgroups that are ranked by past stock returns. We find that there are no significant relationships between herding behavior and past stock return level from Table 7 or 8. These findings violate the fifth hypothesis. We conjecture that the stock market in Taiwan is affected by timing information, and managers usually emphasize instantaneous information and ignore past information. Therefore, managers’ herding behavior is significantly affected by the current stock returns and not by the past stock returns.
Table 7 Herding statistics by past return quintile under binomial
distribution
Herding statistics Past return quintiles Herding measure
(HM) Buy-herding (BHM) Sell-herding (SHM) 1 (Highest) 0.203 (34.580)** 0.225 (36.010)** 0.186 (25.964)** 2 0.190 (30.202)** 0.209 (21.763)** 0.177 (21.613)** 3 0.206 (36.671)** 0.212 (20.967)** 0.202 (27.534)** 4 0.220 (37.637)** 0.242 (27.013)** 0.200 (30.409)** 5 (Lowest) 0.221 (35.637)** 0.227 (22.557)** 0.215 (30.139)**
Note 1. The values in parentheses are t-statistics.
2. (*) and (**) are denoted significant at 5% and 1% level, respectively.
Table 8 Herding statistics by past return quintile under
trinomial distribution
Herding statistics Past return quintile Herding measure
(H ′M ) Buy-herding (BHM′) Sell-herding (SHM′) 1 (Highest) 0.050 (11.608)** 0.100 (11.486)** 0.089 (13.608)** 2 0.046 (10.050)** 0.097 (8.559)** 0.081 (11.690)** 3 0.036 (7.923)** 0.085 (8.524)** 0.088 (10.602)** 4 0.055 (12.136)** 0.135 (12.826)** 0.076 (9.315)** 5 (Lowest) 0.048 (12.574)** 0.098 (11.581)** 0.081 (9.017)**
Note 1. The values in parentheses are t-statistics.
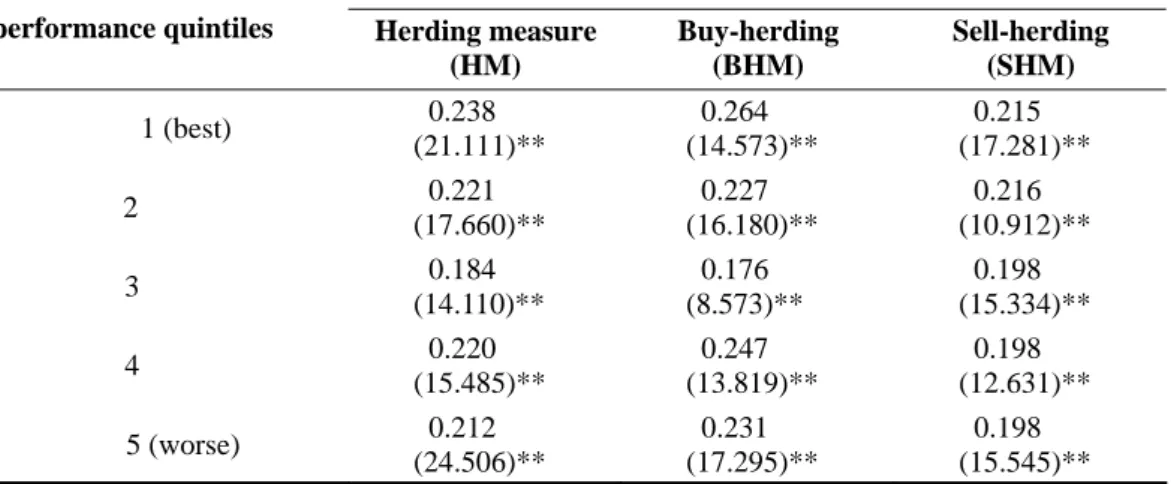
6.4 Mutual fund performance and herding behavior
Managers’ herding behavior is affected by mutual fund performance; they may follow others’ trading strategy for reputation and sharing-the-blame. We group the sample into 5 subgroups by ranking one-year mutual fund performance and show herding statistics in Tables 9 and 10. For the result in Table 9 estimated by binomial distribution, the sixth hypothesis doesn’t hold, since we can’t infer any significant relationship between fund performances and herding behavior from herding statistics in Table 9. We conjecture that herding statistics estimated by the binomial distribution ignore the trade direction, hold, which result in distorting herding statistics.
The result inTable 10 is estimated by adding another trade direction - hold. We find that the manager’s herding behavior is affected by mutual fund performance that are consistent with Scharfstein and Stein (1990), Lakonishok et al. (1992) and Devenow and Welch (1996). Therefore, the sixth hypothesis is proved. For mutual funds with worse performance, managers don’t lapse from other managers’ trading strategy and don’t decrease their herding behavior.
6.5 Market stabilization and herding behavior
Wermers (1999) found significant differences of abnormal return between stocks in the buy- and sell-herding. However, the differences decrease in the long-run. A temporary price adjustment reveals the destabilization of stock price by the herding. However, a permanent impact would indicate that herding plays a more beneficial role in stock markets by increasing the speed of price adjustment to new information.
Table 9 Herding statistics by mutual fund performance quintile
under binomial distribution
Herding statistics
performance quintiles Herding measure (HM) Buy-herding (BHM) Sell-herding (SHM) 1 (best) 0.238 (21.111)** 0.264 (14.573)** 0.215 (17.281)** 2 0.221 (17.660)** 0.227 (16.180)** 0.216 (10.912)** 3 0.184 (14.110)** 0.176 (8.573)** 0.198 (15.334)** 4 0.220 (15.485)** 0.247 (13.819)** 0.198 (12.631)** 5 (worse) 0.212 (24.506)** 0.231 (17.295)** 0.198 (15.545)**
Note 1. The values in parentheses are t-statistics.
2. (*) and (**) are denoted significant at 5% and 1% level, respectively.
Table 10. Herding statistics by mutual fund performance quintile
under trinomial distribution
Herding statistics
Performance quintiles Herding measure (H ′M ) Buy-herding (BHM′) Sell-herding (SHM′) 1 (best) 0.021 (3.018)** 0.097 (5.728)** 0.097 (6.048)** 2 0.022 (5.738)** 0.110 (8.369)** 0.085 (8.394)** 3 0.029 (2.723)** 0.110 (5.952)** 0.073 (4.067)** 4 0.047 (2.571)** 0.104 (10.513)** 0.085 (7.651)** 5 (worse) 0.071 (4.958)** 0.112 (9.791)** 0.100 (9.048)**
Note 1. The values in parentheses are t-statistics.
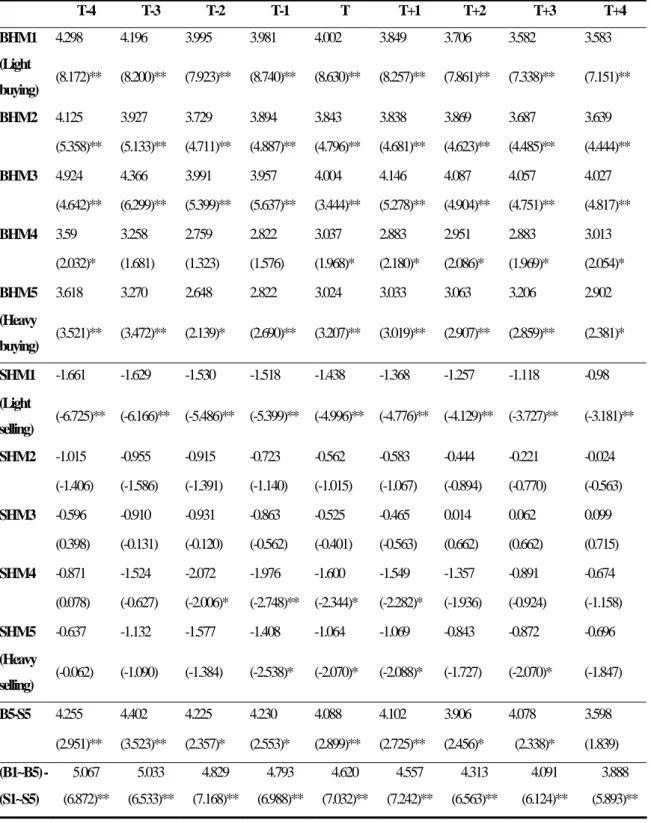
We group the sample into several portfolios by ranking buy-herding measures and sell-herding measures. That is, stocks in the buy-herding subgroup are ranked by , and quintile portfolios are formed. Thus, the top quintile portfolio (BHM1) contains stocks that lightly buy in herds, and the bottom portfolio (BHM5) contains stocks that strongly buy. This procedure is repeated for stocks in the sell-herding subgroup and is ranked by following the formation of quintile portfolios. In other words, the top portfolio (SHM1) contains stocks that slightly sell in herds, and the bottom portfolio (SHM5) contains stocks that strongly sell. Therefore, we form 10 portfolios. Then we calculate the abnormal returns of 10 portfolios during the period.
t , i BHM t , i SHM
Table 11 shows the abnormal returns for portfolios BHM1 through SHM1 from January 2001 to March 2005. For example, the abnormal return shown for portfolio BHM1 in the period T represents the monthly average abnormal return that would accrue to investing on January 2001. In other words, we hold an equal-weighted portfolio of stocks that most lightly buy in herds and then rebalancing to hold this portfolio during the following months. This process is repeated until the end of March 2005. Similarly, same processes are calculated for portfolios form by SHMi,t.
From Table 11, last two rows, (B5-S5) and ((B1~B5)-(S1-S5)), show that there are significant differences of abnormal returns between stocks in the buy- and sell-herding. However, the differences of abnormal return will decrease gradually. Therefore, the herding doesn’t increase the stock market volatility that is consistent with Sias and Starks (1997). Consequently, the seventh hypothesis is proved in Table 11.
Table 11 Market stabilization and herding behavior
T-4 T-3 T-2 T-1 T T+1 T+2 T+3 T+4 BHM1 4.298 4.196 3.995 3.981 4.002 3.849 3.706 3.582 3.583 (Light buying) (8.172)** (8.200)** (7.923)** (8.740)** (8.630)** (8.257)** (7.861)** (7.338)** (7.151)** BHM2 4.125 3.927 3.729 3.894 3.843 3.838 3.869 3.687 3.639 (5.358)** (5.133)** (4.711)** (4.887)** (4.796)** (4.681)** (4.623)** (4.485)** (4.444)** BHM3 4.924 4.366 3.991 3.957 4.004 4.146 4.087 4.057 4.027 (4.642)** (6.299)** (5.399)** (5.637)** (3.444)** (5.278)** (4.904)** (4.751)** (4.817)** BHM4 3.59 3.258 2.759 2.822 3.037 2.883 2.951 2.883 3.013 (2.032)* (1.681) (1.323) (1.576) (1.968)* (2.180)* (2.086)* (1.969)* (2.054)* BHM5 3.618 3.270 2.648 2.822 3.024 3.033 3.063 3.206 2.902 (Heavy buying) (3.521)** (3.472)** (2.139)* (2.690)** (3.207)** (3.019)** (2.907)** (2.859)** (2.381)* SHM1 -1.661 -1.629 -1.530 -1.518 -1.438 -1.368 -1.257 -1.118 -0.98 (Light selling) (-6.725)** (-6.166)** (-5.486)** (-5.399)** (-4.996)** (-4.776)** (-4.129)** (-3.727)** (-3.181)** SHM2 -1.015 -0.955 -0.915 -0.723 -0.562 -0.583 -0.444 -0.221 -0.024 (-1.406) (-1.586) (-1.391) (-1.140) (-1.015) (-1.067) (-0.894) (-0.770) (-0.563) SHM3 -0.596 -0.910 -0.931 -0.863 -0.525 -0.465 0.014 0.062 0.099 (0.398) (-0.131) (-0.120) (-0.562) (-0.401) (-0.563) (0.662) (0.662) (0.715) SHM4 -0.871 -1.524 -2.072 -1.976 -1.600 -1.549 -1.357 -0.891 -0.674 (0.078) (-0.627) (-2.006)* (-2.748)** (-2.344)* (-2.282)* (-1.936) (-0.924) (-1.158) SHM5 -0.637 -1.132 -1.577 -1.408 -1.064 -1.069 -0.843 -0.872 -0.696 (Heavy selling) (-0.062) (-1.090) (-1.384) (-2.538)* (-2.070)* (-2.088)* (-1.727) (-2.070)* (-1.847) B5-S5 4.255 4.402 4.225 4.230 4.088 4.102 3.906 4.078 3.598 (2.951)** (3.523)** (2.357)* (2.553)* (2.899)** (2.725)** (2.456)* (2.338)* (1.839) (B1~B5) - 5.067 5.033 4.829 4.793 4.620 4.557 4.313 4.091 3.888 (S1~S5) (6.872)** (6.533)** (7.168)** (6.988)** (7.032)** (7.242)** (6.563)** (6.124)** (5.893)**Note 1.BHM1 (BHM5) contains stocks that slightly (strongly) buy in herd. Similarly, SHM1 (SHM5) contains stocks that slightly (strongly) sell in herd.
2. B5-S5 represents the abnormal return of BHM5 portfolio minus the abnormal return of SHM5 portfolio. 3. (B1~B5)-(S1~S5) represents abnormal returns that equally weights long position in BHM1 through
BHM5 and equally weights short positions in SHM1 through SHM5.
4. T is average 51 monthly abnormal returns starting on January 2001 and reinvest until March 2005. 5. The values in parentheses are t-statistics. On the other hand, (*) and (**) are denoted significant at 5%
and 1% level, respectively.
7. Conclusions
This paper extends traditional binomial distribution to trinomial distribution, including buy, sell and hold, to investigate the manager’s herding behavior. We analyze the herding behavior by grouping the sample into several subgroups that are ranked by firm size, stock returns and mutual fund performance. Finally, we analyze whether the manager’s herding behavior stabilize or destabilize stock market.
For the first empirical result, we find significant herding behavior of managers from 2001 to 2005 in Taiwan, especially for buy-herding. Since the economy state enter a boom, the buy-herding is more significant than sell-herding for equity funds. Second, the herding statistics estimated by trinomial distribution are smaller than those statistics estimated by binomial distribution as a result of disregarding another trade direction - hold. Thus, we infer that herding statistics under binomial distribution may overestimate managers’ herding behavior. Third, for small firms, managers will follow other managers’ trading strategy because small firms disclose less information and stocks are usually illiquidity. Fourth, herding on the buy-side is strongest in high current-return stocks and herding on the sell-side is strongest in low current-return stocks. In other words, managers adopt positive-feedback trading strategy to buy past winners and sell past losers.
However, there are no significant relationship between past stock returns and herding behavior. Fifth, for funds with worse performance, managers have more significant herding behavior due to the reputation and sharing-the-blame. Finally, we form 10 portfolios by grouping stocks in the buy- and sell-herding and they are ranked by BHM and SHM. We find that there are significantly different abnormal returns between stock in buy-herding subgroups and sell-herding subgroups. However, these differences will decrease gradually. Therefore, managers’ herding behavior doesn’t destabilize stock market. In contrast, the manager’s herding behavior can increase the speed of price adjustment to a reasonable price.
The trade direction, hold, is always ignored in previous studies, which only consider two trade directions: buy and sell. This paper develops a test of herding to test the manager’s herding behavior by postulating and proving seven hypotheses under trinomial distribution, including three trade directions: buy, sell and hold. Consequently, we hope that this paper can help investors to understand mutual funds market more deeply.
Acknowledgements
The authors would like to thank the editor, anonymous referees, Professor Yi-Chun Huang and Ying-Feng Chen for their helpful comments, suggestions and corrections in revising this paper.
8. Reference
Banerjee, A. V. (1992), “A Simple Model of Herd Behavior,” Quarterly Journal of Economics, 108(3), 797-817.
Bikhchandani, S., Hirshleifer, D. and Welch, I. (1992), “A Theory of Fads, Fashion, Custom, and Cultural Change as Informational Cascades,”
Journal of Political Economy, 100(5), 992-1026.
Brown, K., Harlow, V. and Stark, L. (1996), “Of Tournaments and Temptations: An Analysis of Managerial Incentives in the Mutual Fund Industry,” Journal of Finance, 51(1), 85-110.
Carhart, M. (1997), “On Persistence in Mutual Fund Performance,” Journal of Finance, 52(1), 57-82.
Chevalier, J. and Ellison, G. (1997), “Risk Taking by Mutual Funds as a Response to Incentives,” Journal of Political Economy, 105(6), 1167-1200.
Christie, W. G. and Huang, R. D. (1995), “Following the Pied Piper: Do Individual Returns Herd around the Market ?” Financial Analysts Journal, 51(4), 31-37.
Choe, H., Kho, B. C. and Stulz, R. M. (1999), “Do Foreign Investor Destabilize Stock Markets? The Korean Experience in 1997,” Journal of Financial Economics, 54(2), 227-264.
Chang, E. C., Cheng, J. W. and Khorana, A. (2000), “An Examination of Herd Behavior in Equity Markets: An International Perspective,” Journal of Banking & Finance, 24(10), 1651-1679.
Devenow A. and Welch, I. (1996), “Rational Herding in Financial Economics,” European Economic Review, 40(3-5), 603-615.
Fama, E. F. (1972), “Components of Investment Performance,” Journal of Finance, 27(3), 551-567.
Froot M. C., Scharfstein, D. S. and Stein, J. C. (1992), “Herd on the Street: Informational Inefficiencies in a Market with Short-term Speculation,” Journal of Finance, 47(4), 1461-1481.
Grinblatt, M. S., Titman, S. and Wermers, R. (1995), “Momentum Investment Strategies, Portfolio Performance and Herding: A Study of Mutual Fund Behavior,” American Economic Review, 85(5), 1088-1105.
Funds,” Journal of Finance, 51(3),783-810.
Henriksson, R. D. and Merton, R. C. (1981), “On Market Timing and Investment Performance Statistical Procedures for Evaluating Forecasting Skill,” Journal of Business, 54(4), 513-533.
Hirshleifer, D., Subrahmanyam, A. and Titman, S. (1994), “Security Analysis and Trading Patterns when some Investors Receive Information before Others,” Journal of Finance, 49(5), 1665-1698.
Ippolito, R. A. (1992), “Consumer Reaction to Measures of Poor Quality: Evidence from the Mutual Fund Industry,” Journal of Law and Economics, 35(1), 45-70.
Jensen, M. C. (1968), “The Performance of Mutual Funds in the Period 1945-1964,” Journal of Finance, 23(2), 389- 416.
Keynes, J. M. (1936), The General Theory of Employment Interest and Money, London, Macmillan.
Lakonishok, J. and Smidt, S. (1986), “Volume for Winners and Losers: Taxation and Other Motives for Stock Trading,” Journal of Finance, 41(4), 951-974. Lakonishok, J., Shleifer, A., Thaler, R. and Vishny, R. W. (1991), “Window
Dressing by Pension Fund Managers,” American Economic Review, 81(2), 227-231.
Lakonishok, J., Shleifer, A. and Vishny, R. W. (1992), “The Impact of Institutional Trading on Stock Prices,” Journal of Financial Economics, 32(1), 23-43.
Scharfstein, D. S. and Stein, J. C. (1990), “Herd Behavior and Investment,” American Economic Review, 80(3), 465-479.
Sharp, W. (1966), “Mutual Funds Performance,” Journal of Business, 39(1), 119-138.
Shiller, R. J. and Pound, J. (1989), “Survey Evidence on Diffusion of Interest and Information among Investors,” Journal of Economic Behavior and
Organization, 11(1), 47-66.
Sias, R. W. and Starks, L. T. (1997), “Return Autocorrelation and Institutional Investors,” Journal of Financial Economics, 46(1), 103-131.
Sirri, E. R. and Tufano, P. (1998), “Costly Search and Mutual Fund Flows,” Journal of Finance, 53(5), 1589-1621.
Treynor, J. L. (1965), “How to Rate Management of Investment Funds,” Harvard Business Review, 43(1), 63-75.
Warther, V. A., (1995), “Aggregate Mutual Fund Flows and Security Returns,” Journal of Financial Economics, 39(2), 209-235.
Welch, I. (1992), “Sequential Sales, Learning, and Cascades,” Journal of Finance, 47(2), 695-732.
Wermers, R. (1999), “Mutual Fund Herding and Impact on Stock Prices,” Journal of finance, 54(2), 581-621.
Wylie, S. (2005), “Fund Manager Herding: A Test of the Accuracy of Empirical lts Using U.K. Data,” Journal of Business, 78(1), 381-403.