行政院國家科學委員會專題研究計畫 成果報告
所得均等或成長? 教育券制度和同儕素質對人力資本累積
的影響
計畫類別: 個別型計畫 計畫編號: NSC92-2415-H-002-017- 執行期間: 92 年 08 月 01 日至 93 年 07 月 31 日 執行單位: 國立臺灣大學經濟學系暨研究所 計畫主持人: 陳虹如 報告類型: 精簡報告 處理方式: 本計畫可公開查詢中 華 民 國 93 年 7 月 6 日
行政院國家科學委員會補助專題研究計畫
■ 成 果 報 告 □期中進度報告(計畫名稱)
所得均等或成長?教育券制度和同儕素質對人力資本累積
的影響
計畫類別:■ 個別型計畫 □ 整合型計畫
計畫編號:NSC 92 - 2415 - H - 002 - 017 -
執行期間: 92 年 8 月 1 日 至 93 年 7 月 31 日
計畫主持人:陳虹如
共同主持人:
計畫參與人員:
成果報告類型(依經費核定清單規定繳交):
□精簡報告 ■完整報告
本成果報告包括以下應繳交之附件:
□赴國外出差或研習心得報告一份
□赴大陸地區出差或研習心得報告一份
□出席國際學術會議心得報告及發表之論文各一份
□國際合作研究計畫國外研究報告書一份
處理方式:除產學合作研究計畫、提升產業技術及人才培育
研究計畫、列管計畫及下列情形者外,得立即公
開查詢
□涉及專利或其他智慧財產權,□一年□二年後可公開查詢
執行單位:台大經濟系
中 華 民 國 93 年 7 月 7 日
Growth and Inequality: The Impacts of Voucher
Programs When Peer Group Effects Matter
Hung- ju Chen
*
*
Department of Economics, National Taiwan University, 21 Hsu-Chow Road, Taipei 100, Taiwan. Tel: 886-2-23519641 ext. 457. Fax: 886-2-23511826. E-mail: [email protected].
I am grateful to Costas Azariadis and Gary Hansen for their comments and suggestions. Financial support from the Taiwan National Science Council (grant number: NSC 92-2415-H-002-017) is also gratefully acknowledged. Any errors remain my sole responsibility.
ABSTRACT
This study constructs a dynamic model with the coexistence of public and private schools to study the impacts of voucher programs when there are peer group effects. The government provides public schools as well as tuition vouchers for households attending private schools. School quality depends on expenditure per student and peer quality within the school.
With linear peer quality, an increase in the amount of vouchers will lower the public school enrollment rate, which will in turn raise income inequality; however, its impacts on economic growth will depend on the strength of the peer group effects. With weak peer group effects, an increase in the scale of vouchers will raise economic growth, whereas, with strong peer group effects, an increase in the amount of vouchers will reduce the growth rate. When peer quality is exhibited as nonlinear, more agents will choose public schools if peer quality is more substitutable, whereas more agents will attend private schools if peer quality is more complementary.
JEL Classification: H52, I21, O11.
中文摘要 此研究計畫在推導一個理論和可量化的人力財的累積模型。在模型中,我假設公 私立學校同時存在,且借貸市場是不完全的。個人的差別在於他們的天賦和與生 俱有的能力。人力財的累積和個人的投入(學習能力),學校素質(每個學生的花費 和同儕素質),家庭投入(父母親的教育程度),及外部性(社區的平均人力財)有 關。政府提供公立學校並對選擇私立學校的人加以補助(教育券計畫)。本研究計 畫的重點在於分析教育券計畫的等級及涵蓋範圍和引入同儕素質所帶來的影 響。我發現提高教育券計畫的等級後,原本選擇私立學校的人會提高對教育的投 資,而一部份原本選擇公立學校的人會轉而選擇私立學校。因此,提高教育券計 畫的等級會同時提高經濟成長率和所得分配不均。另一方面,提高教育券計畫的 涵蓋範圍可以幫助一些因為不完全借貸市場的存在而少量投資在人力財上的人 使他們能夠增加在教育方面的投資。這樣做使得經濟成長率和所得分配不均有可 能是上升或是下降的。同儕素質的加入會加強教育券制度對教育投資的影響。 關鍵詞: 所得不均度;不完全借貸市場; 教育券制度; 同儕素質。
1.
INTRODUCTIONThe provision of vouchers seems to have become quite common in many countries over recent years; however, concerns surrounding the ‘cream skimming’ effect which is brought about by voucher programs have attracted considerable debate on the pros and cons of such programs. Supporters of voucher programs claim that they provide the necessary assistance that will allow children from poor families to attend high-quality private schools. On the other hand, those against voucher programs argue that these programs will tend to lower public school quality and worsen the problem of segregation. Since school quality is not only determined by expenditure per student, but also by the composition of the student body within a school, a study which analyzes the ways in which these two aspects are affected by voucher programs within both public and private schools is a necessary element in the overall evaluation of the consequences of educational reform.
Although there has already been quite a substantial body of literature on economic growth through the accumulation of human capital (Uzawa, 1965; Loury, 1981; Lucas, 1988; and Becker, et. al., 1990), very few of these studies have paid attention to the impacts of the educational system on economic performance.1 Public schools differ from private schools in the sense that the quality of public schools is homogeneous, whereas private schools provide heterogeneous school quality. Agents can choose between tuition-free public schools and tuition-based private schools. Furthermore, with the coexistence of public and private schools, the public/private school enrollment rate becomes an important determinant of economic performance because the human capital accumulation for students attending public or private schools will be different because of the differences in school qualities. Increasing the public school enrollment rate will lower income inequality since more agents will receive the same school quality; however, the relationship between the public school enrollment rate and growth is not clear, because this will depend largely on public school expenditure per student and peer group effects.
Papers studying the transition of growth and income distribution under a public and a private education regime include Glomm and Ravikumar (1992), Zhang (1996) and Glomm (1997). The economic performance, when both private and public schools
1 There are three types of educational systems: a public education regime, a private education regime, or
exist, is analyzed by Chen (2004). However, the school quality, which should be measured by the expenditure per pupil and peer group quality, is not considered in any of these studies. In this paper we set out to analyze the ways in which voucher programs affect the educational decisions of households when there are peer group effects, and how the accumulation of human capital will affect growth and income inequality. The model simulation allows us to quantify the impacts of voucher programs on economic performance, with our quantitative evaluation indicating that peer group effects matter.
The prior theoretical studies have tended to use either innate ability or parental human capital as a measure of peer quality. Some assume that innate ability is revealed before each individual makes a choice over schools and therefore go on to use the average innate ability within a school to measure peer quality (Epple and Romano, 1998, 2002; Caucutt, 2002). Others argue that using parental human capital to represent peer quality can determine the quality-adjusted involvement in school activities by parents (Nechyba, 1996; Benabou, 1996; and Snipes, 1998).2
We begin by assuming an equal contribution to peer quality from both high- and low-ability students, and follow the measure of peer quality adopted by Epple and Romano (1998, 2002). Epple and Romano (1998) explored household decisions on schooling, with vouchers being introduced into the model as lump-sum transfers. Their computational results showed that high-ability students would benefit more from the voucher systems than students of low ability; thus demonstrating that voucher programs would lead to further cream skimming. Epple and Romano (2002) extended their previous work by introducing vouchers that were conditional on student ability. Their results showed that without any restrictions on school policies, the conditional vouchers failed to significantly reduce the impacts of cream skimming.
Our work differs from the Epple and Romano theme in two specific ways since we present a dynamic rather than a static model, and along with the use of mean ability as the peer measure (linear peer quality), we also study cases with non-linear peer quality. In this paper, we show that with linear peer quality, income inequality will increase with an increase in the amount of vouchers while the impacts on economic growth will depend on the strength of the peer group effect. With a weak
2 According to Snipes (1998), one example of a school activity involving parents that would upgrade
peer group effect, an increase in the amount of vouchers will raise economic growth, whereas, with a strong peer group effect, increasing the amount of vouchers will reduce the growth rate.
We then proceed by relaxing the assumption of linearity of peer quality. In order to allow for the possibility that high-ability students may contribute more to peer quality, or that low-ability students may, to some extent, bring down peer quality, we adopt a non-linear function form of peer quality as proposed by Benabou (1996). The assumption of a non-linear form of peer quality allows for the substitutability or complementarity3 of an individual’s innate ability. The former is referred to in this study as the ‘role model’ type peer group effect, whilst the latter is referred to as the ‘bad apple’ type peer group effect. We find that with non-linear peer quality, there is an increase in the enrollment rate in public schools, along with an increase in the degree of substitutability or a decrease in the degree of complementarity. That is, more agents will attend public schools if peer quality is more substitutable, and more atents will attend private schools if peer quality is more complementary. An increase in the public school enrollment rate will, in turn, reduce income inequality. When peer quality becomes more substitutable (or less complementary), this will enhance school quality, and thereby lead to an increase in economic growth.
We construct a dynamic model in order to analyze the transition of growth, income inequality and school choice, with the accumulation of human capital being dependent on innate ability, school quality (expenditure per student and the peer quality within the school), parental human capital and average human capital. The government provides all public schooling and transfers public funds to families attending private schools through voucher programs. Vouchers are defined as a fraction (scale) of public school expenditure per student, and the voucher programs are implemented when the government transfers the tax revenue to the selected households.4
3 Following Benabou (1996), we say that peer quality is more substitutable if high-ability students
may contribute more to peer quality and peer quality is more complementary if low-ability students may contribute more to peer quality.
4 The government can either transfer the public funds to the selected households or to the school.
Several issues of voucher programs are discussed in Bradford and Shaviro (1999). These issues include factors determining a voucher’s case-equivalence, reasons for giving non-case-equivalence vouchers rather than cash, optimal tax rates, and the choice between vouchers and other policies. In their paper, vouchers are defined as ‘grants earmarked for particular commodities, such as medical care or education, given to individuals’ (Rosen (1995)). Hence, they discuss several areas where the government might implement voucher systems. This includes education, housing, food stamps and Medicare.
In order to study the dynamics of human capital, the prior literature in this area has usually assumed that human capital is log-normally distributed. A computational method is therefore needed to study the dynamic consequences of education policies, so as to allow the study of school choice for agents and to quantify the impacts of voucher programs when there are peer group effects. Hence, we simulate our model to evaluate the effects of several voucher programs of different scales, examining both linear and non-linear peer quality, with peer quality being measured by the innate ability of the student body within a school.
The next section presents models of different educational systems, along with a general discussion of voucher programs. In order to study the impacts of voucher programs on both economic growth and income inequality, we need to simulate the equilibrium; therefore, the calibration of the parameters is provided in the subsequent section, along with the results of the simulation. A mixed educational system with non-linear peer group effects is studied in the penultimate section, followed by provision of the conclusions drawn from this study in the final section.
2. THE MODEL
We adopt an infinite-horizon, discrete time overlapping generations model where agents live for two periods. Each period covers approximately 30 years, corresponding to childhood and adulthood. Every adult (parent) gives birth to a child and there is no population growth, thus, we normalize the population size to one. For family i, earnings for an adult are equal to his/her human capital, hti, and parents make school decisions on behalf of their children. Young agents differ from each other by their parental human capital and innate abilities (zti), both of which are
public knowledge.
We assume that both public and private schools exist in the economy and that parents need to decide which type of school their children will attend. Additionally, if they choose to send their children to private schools, they also need to decide how much they wish to spend on their children’s education. We begin by describing the school types and how school quality is determined.
A school ( j) is characterized by its quality, and we make the following assumptions of schools:
Assumption of Schools (AS1). Schools earn zero profit.
Assumption of Schools (AS2). Private schools cannot reject any students who are
willing to pay for tuition and public schools cannot reject any students who are willing to attend.
Assumption of Schools (AS3). School quality is measured by its expenditure per
student (mtj) and the quality of its students ( j t p ). We use mtrj and uj t
m to denote the expenditure per student for a private school and a public school in period t , respectively.
Assumption of Schools (AS4). For any level of educational expenditure chosen by
a parent, there always exists a private school to accept his/her child.
Assumption of Schools (AS5). A private school charges the same tuition for all types of students attending the school.
Due to the coexistence of public and private schools, parents need to decide which type of schools to send their children to. Because public schools are provided by the government, attendance at these schools is free. From Assumption (AS1), we know that mtuj is the same for all public schools and is determined by the government
( u
t uj t m
m = ). From assumption (AS2), we can take it that there is only one public school in society.5
Although households who choose to send their children to private schools need to pay tuition fees, they can also choose the quality of the school. Assumption (AS1) demonstrates that all tuition fees charged by private schools will be used to teach students; hence, the level of tuition fee equals the expenditure per student of a private school. Assumption (AS3) states that aside from the expenditure per student, school quality also depends on the quality of its students (peer quality). We assume that school quality (qtj) is a Cobb-Douglas function of the expenditure per student and
peer quality, ptj.
5 If there are several public schools in the economy, households will choose to attend the one with
2 1( ) ) ( tj ς tj ς j t m p q = , ς1,ς2∈(0,1). (1)
We assume that the peer quality of a school is measured by the average innate ability of the student body within the school (linear peer quality).
p =
∫
z gj z dz t i t j t ( ) (2)where gtj(z) is the probability distribution function of innate ability for students attending school j in period t . As we will see later, the educational expenditure is an increasing function of parental human capital and innate ability.6 Hence, the educational expenditure of rich, low-ability agents may be the same as that for poorer, high-ability agents; however, assumption (AS5) demonstrates that there is no price discrimination between students in a school.7 Hence, poorer, but more able students do not have any incentive to attend private schools with rich, less able students due to the peer group effects. Because of the homogeneous peer quality of private schools, this will be equal to the innate ability of its students, zti. Therefore, private schools are perfectly segregated and can be characterized by the student type (z ,ti hti). We use
ri t
m to represent the educational expenditure chosen by family i. The peer group effect for private schools and public schools can therefore be written as:
= u t i t j t p z p if public j private j = = , (3)
where ptu represents peer group quality of the public school. After defining the school quality, we are now able to define the accumulation function of human capital.
6 Note that a rich student will choose a higher educational expenditure than a poor student with the
same innate ability. Also, an able student will choose a higher educational expenditure than a less able student with the same parental human capital
7 Rothschild and White (1995) and Caucutt (2002) analyzed models where schools can price
discriminate among students. The results show that rich, less able individuals will subsidize poor, able individuals.
Human Capital Accumulation Function
Following the literature (Uzawa, 1965; Locus, 1988; Glomm and Ravikumar, 1992; and Glomm, 1997), we assume that human capital is accumulated according to a Cobb-Douglas learning technology:
ψ δ γ t i t j t i t i t z q h H h +1 = ( ) ( ) , γ,δ,ψ ∈(0,1). (4) Human capital in the next period depends on innate ability (zti), school quality (qtj), parental human capital (hti)and the average human capital of society (Ht). The parameters γ , δ , and ψ are the corresponding elasticity of ,qt ht, and Ht to future human capital. We restrict all factors devoted to the accumulation of human capital in order to exhibit diminishing returns. Substituting equations (1) and (3) into equation (4), we can rewrite the human capital accumulation function as:
= + + γ γ δ ψ ψ δ γ γ t i t u t u t i t t i t ri t i t i t H h p m z H h m z h ) ( ) ( ) ( ) ( ) ( ) ( 2 1 1 2 1 1 if public j private j = = , (5)
where γ1 =γς1 and γ2 =γς2. We assume that the human capital accumulation function exhibits constant returns to scale (that is, γ1 +δ +ψ =1) to allow for a constant growth rate along the balanced growth path under a private education regime and a public education regime.8
Let )ft(h,z represent a joint distribution of human capital and innate ability in period t . The average human capital in this economy is defined as
∫∫
= h f h z dhdz H t i t t ( , ) , (6)We assume that the accumulation of human capital does not affect the realization of innate ability. The distribution of learning ability (gt(z)) is invariant over time and is represented by a log-normal distribution with mean µz and variance
2
z
σ . The
8 Proposition 1 demonstrates that a constant growth rate exists along the balanced growth path under
private schooling. The existence of a constant growth rate along the balanced growth path under public schooling is presented in Proposition 2.
initial distribution of human capital ( g1(h) ) is log-normal with mean µh1 and variance σ . h21 ) , ( ~ z z2 i t LN z µ σ , h1i ~LN(µh1,σh21).
Households’ Maximization Problem
We assume parents care about their consumption (cti) and their children’s human capital (hti+1). All agents have the same utility function over their life cycle, which is:
i t i t i t c h u = +β +1, (7) where β represents the number of consumption units that gives the same utility as one unit of a child’s human capital.
Parents must pay income tax, and they also have to decide how much they want to spend on consumption (cti) and which type of school their children will attend. We assume that the tax rate is constant (τt =τ ∀t ) and that the government runs a
balanced budget. Tax revenues are used to support public schools and to reimburse students attending private schools as a lump-sum transfer, by means of vouchers (V ). t
Let eti( j) and Vti( j) respectively represent the expenditure of households on education and the vouchers they receive in period t . The budget constraint for adults
is: )} ( ), ( min{ ) 1 ( ) (j h e j V j e c ti i t i t i t i t + = −τ + , (8) where = 0 ) ( ri t i t m j e and = 0 ) ( t i t V j V if public j private j = = . (9)
In equation (8), the term min{eti(j),Vti(j)} demonstrates that vouchers can only be used for education. Under this assumption, the educational expenditure (mtri) for
those individuals who attend private schools will be higher than the amount of vouchers.
We then analyze the accumulation of human capital under different education regimes. We start from a private school regime when there are no vouchers, then we turn to study an economy under a public school regime. Finally, we examine economic performance under a mixed educational system when there are voucher programs.
2.1 A Private School Regime Without Vouchers
We first consider the situation where there is no voucher program.9 For parents who choose to send their children to private schools, the optimal school tuition fees that they will pay for their children’s education are:
1 2 1 1 1 1( ) ( ) ] [βγ +γ δ ψ −γ = t i t i t ri t z h H m . (10)
Equation (10) shows that educational expenditure increases along with an increase in parental human capital, or innate ability, or aggregate human capital. By substituting mtri within the human capital accumulation function of equation (4), the
law of motion of human capital becomes:
1 1 2 1 1 1 1 1 [( ) ( ) ( ) ] γ ψ δ γ γ βγ − + + = t i t i t i t z h H h . (11)
Equation (11) shows that the human capital accumulation function is an increasing function of innate ability, parental human capital and aggregate human capital, all other things being held constant. We define gt+1 as the growth rate of average human
capital/income from period t to period t+1 (
t t t H H g 1 1 +
+ = ); z is the average learning
ability and t i t t H h
b = is the relative human capital. Following de la Croix and Doepke (2003), a balanced growth path is described by b =1, t zti = z ∀t (i.e. the difference between agents vanishes).
9 Because we assume that the government runs a balanced budget and tax revenues are only spent on
Proposition 1. Under a private education regime, a balanced growth path with a constant growth rate (g*) exists and 2 1 1 1
1 1 1 ] ) ( ) [( *= z +γ βγ γ −γ g .
Proof: From equation (11), we have:
t t t i t i t t i t H H H h z H h 1 1 1 1 1 1 1 1 1 1 1 2( ) ( ) ] ) [( + − − + + + + = γ βγ γ δ ψ γ γ . Thus, 1 1 1 1 1 1 1 1 2( ) ] ) [( + − + + = t t i t t g b z b γ δ γ γ βγ . (12)
Along the balanced growth path, b =1 and t z z i
t = for all t . From equation (12),
this implies: 1 1 2 1 1 1 1 1 [( ) ( ) ] γ γ γ βγ − + − + = z gt . Q.E.D.
2.2 A Public School Regime
Because we assume that the government runs a balanced budget, the expenditure per student in a public school is equal to the total tax revenue:
t u t H
m =τ .
The accumulation of human capital for an individual attending a public school is:
ψ γ δ γ γ τ + +1 = 1( ) 2( ) t1 i t u t i t i t z p h H h . (13)
Proposition 2. Under a public education regime, a balanced growth path exists
with a constant growth rate ( g* ) and
2 1( )1
*=τγ z +γ
g .
Proof. By using equation (13), the human capital accumulation function can be written as: ψ γ δ γ γ τ + +1 = 1( ) 2( ) t1 i t u t i t i t z p h H h .
Thus, 1 1 1 1 1 1 ) ( ) ( ) ( ) ( 2 1 1 2 1 + − + − + + + + = = = t t i t u t i t t t t i t u t i t t i t t g H h p z H H H h p z H h b δ δ γ γ ψ γ δ γ γ τ τ . (14)
Along the balanced growth path, b =1 and t zti = for all t . From equation (14), z
this implies: 1 1 2 1 1 2 1 ( ) ( ) γ γ δ γ γ τ τ − + − + + = z b = z gt t . Q.E.D.
2.3 A Mixed Educational Systems with Voucher Programs
We now turn to study an economy where both private and public schools exist. In order to encourage poor parents with high-ability children to spend more on their children’s education, the government could consider implementing voucher programs. The educational policies that the government can use to allocate resources (tax revenues) between public schools, and vouchers to reimburse parents who send their children to private schools, are public school expenditure and the amount of vouchers. A survey conducted by West (1997) showed that the amount of vouchers is usually a fraction of the educational cost per student at a public school, with this fraction ranging from 30 per cent to 100 per cent. In this paper we define the scale of voucher programs as the ‘fraction’ (scale) of per student expenditure at a public school, and denote it as υ. We then examine the implications of voucher programs when the scale is equal to 0 per cent (no vouchers), 50 per cent and 80 per cent.
Government
Let dtu represent the public school enrollment rate. Assuming that the government runs a balanced budget and the amount of vouchers is equal to a fraction of per student expenditure at a public school, we can write the government’s budget constraint as: u t u t u t u t t u t u t u t t d m d V d m d m H υ τ = +(1− ) = +(1− ) . (15) Note that equation (15) shows that once the scale of vouchers is determined, if the budget for the government is balanced, the government cannot control mtu.
Choice of School Type
Under a mixed educational system, parents make school decisions on behalf of their children based on their utility. Without any voucher programs, the lifetime utility for parents who choose private schools for their children is:
ri t i t i pri h m u 1 1 1 ) 1 ( γ γ τ + − − = , (16) where mtri is given by equation (10). The lifetime utility for parents who choose public schools for their children is:
=(1−τ) +β τγ1( )γ2( )δ γ1+ψ t i t u t i t i t i pub h z p h H u . (17)
Comparing uipri with uipub, we find that given zti and Ht, uipri >uipub if:
t i t u t i t H z p h 1 2 1 1 1 1 2 1 1 1 1 1 1 ) 1 ( ) 1 ( ] ) ( ) ( ) 1 ( ) ( [ γ γ γ γ δγ γ γ γ γ βγ γ τ + − − − − > . (18)
On the other hand, given hti and Ht, uipri >uipub if:
2 1 1 1 1 1 1 2 1 1 1 1 1 1 ) 1 ( ) 1 ( ] ) ( ) ( ) 1 ( ) ( [ γ γ δγ γ γ δγ γ γ γ γ βγ γ τ + − − − − > i t t u t i t h H p z . (19)
Equations (18) and (19) demonstrate that young agents with high parental human capital, or high innate abilities, or both, will attend private schools. Appendix 1 describes how to distinguish the types of children attending private or public schools.
Given that only those parents whose children’s desired educational spending is higher than the public education spending will choose to send their children to private schools, the tuition of a private school will always be higher than the expenditure per pupil of the public school.
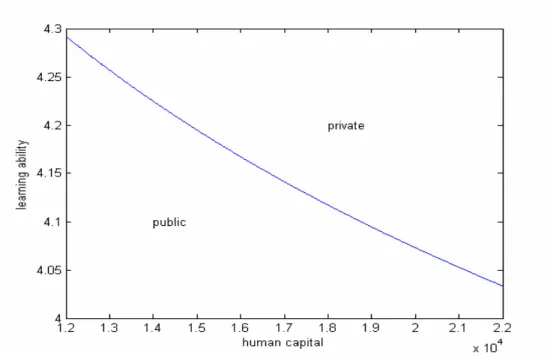
Based upon the parameter values calibrated in the next section, Figure 1 shows which type of agents will choose public or private schools. As can be seen from the figure, rich or able children will attend private schools because their desired educational investment is higher, whilst poor children, or those with lower abilities, will choose a public school.
Figure 1 School choice
With the existence of voucher programs, some students with low parental human capital, but high innate ability will switch from public schools to private schools. Hence, we see that the curve representing uipri =uipub in Figure 1 will shift to the left and the area for students attending private schools will become larger. Figure 2 presents school choice under a mixed educational system, when there are no vouchers and when there are vouchers, with a scale of 50 per cent.
3. EXPERIMENTS
Having constructed the model, our intention is to study its long-run implications for growth and inequality. Hence, we simulate the model to quantify the effects of voucher programs on growth and income inequality through school choice and the accumulation of human capital.10 Before performing a simulation, we need to calibrate the parameter values.
3.1 Calibration
The parameter values are calibrated to 1980 US data. We first calibrate values of the parameters for the human capital accumulation function. The parameters γ1 and δ represent the respective income elasticity of expenditure on education and parental income. The results of an empirical study by Johnson and Stafford (1973) showed income elasticity of school expenditure to be 0.198. The number used by Fernandez and Rogerson (1997), based on Card and Kreuger (1992) estimates, was 0.2. Since these two numbers differ by only a very small margin, we set γ1 equal to 0.2. The study by Rosenzweig and Wolpin (1994) also found that a 10 per cent increase in a parent’s education would cause a 2.4 per cent increase in his/her child’s test score; hence, we set δ as equal to 0.2. Accordingly, ψ is set to 0.6. The parameter γ2 is calibrated to 0.19 to match the public school enrollment rate, equal to 88 per cent. Because the intention of this paper is to study the implications of voucher programs when peer group effects exist, we also examine cases when γ2 is equal to 0 and 0.4.
We use, as our baseline model, an economy with a mixed educational system with no voucher programs. The distributions that we need to calibrate are log-normal distributions of both innate ability and initial human capital. We calibrate µh1 and
1
h
σ to match the median of US household income ($17,710)11 and the Gini coefficient (35.2 per cent)12 in 1980. Because we assume that the initial human capital stock is log-normally distributed, the median of human capital is exp(µh1). Accordingly, µh1 is set to 9.782 and σh1 is set to 0.51. The average annual growth rate of per capita output for the US from 1960 to 1998 is around 2 per cent. Choosing a mean of innate
10 Appendix 2 describes the computational process in detail. 11 Data source: US Census Bureau.
12
ability equal to 2.595 approximates the growth rate of income as being equal to (1.02)30 along the balanced growth path under public schooling. We calibrate the variance of log(z) so that the Gini coefficient is roughly constant over time.
The parameter β is calibrated to 0.185 so that the annual growth rate along the balanced growth path under private schooling is the same as that under public schooling. The ratio of public spending on education to GNP in 1980 was 6.7 per cent.13 Accordingly, we set τ equal to 6.7 per cent so that under the baseline model, the ratio of public spending on education to GNP matches the data.
3.2 Simulation Results
In this section we present the simulation results of our model, examining the scale of vouchers at 0 per cent, 50 per cent, and 80 per cent when there are no peer group effects (γ2 =0), moderate peer group effects (γ2 =0.19), and strong peer group effects (γ2 =0.4).
Note that 0 per cent on the scale indicates the model of a mixed educational system with no voucher system in place. The baseline model is referred to as a mixed education system without vouchers with moderate peer group effects (γ2 =0.19 and
% 0 =
υ ).
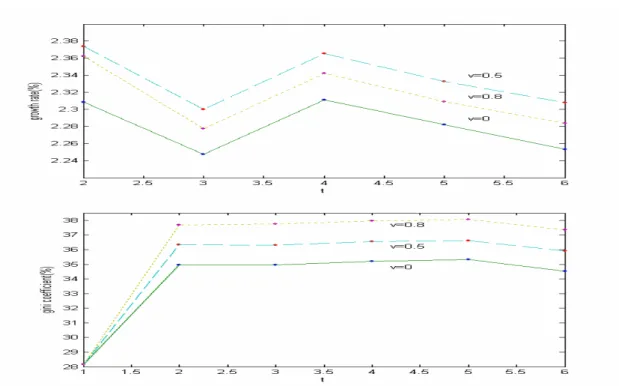
Figure 3 Transitions of the growth rate and income inequality
13
Transitions of the growth rate and Gini coefficient over six periods under three different voucher scales when γ2 =0.19 are presented in Figure 1. Because over the whole six periods, the comparison of the economic performance between these three voucher programs will give the same result no matter which period we choose, we show the statistics in the 4th period (equivalent to 120 years) in Table 1.14 The statistics we present are the public school enrollment rate, peer quality in a public school, the economic growth rate and the Gini coefficient. The computational results under our baseline model are highlighted.
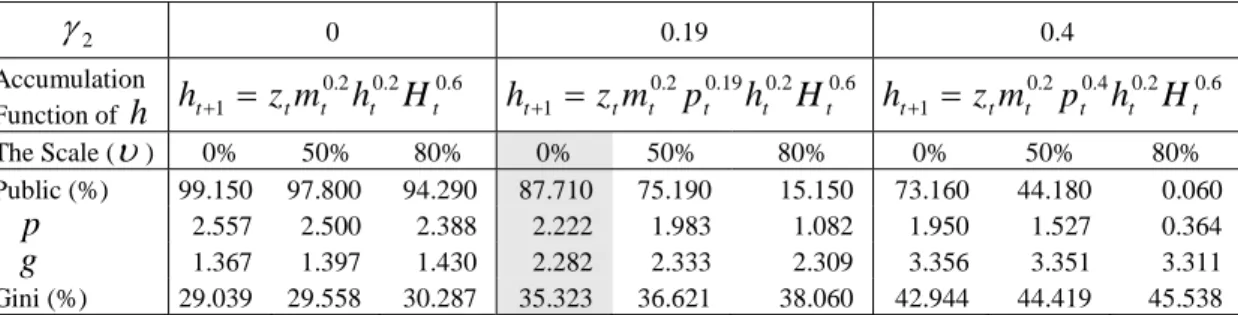
Table 1 Voucher programs
2 γ 0 0.19 0.4 Accumulation Function of h 6 . 0 2 . 0 2 . 0 1 t t t t t z m h H h+ = ht+1 =ztmt0.2pt0.19ht0.2Ht0.6 ht+1 = ztmt0.2pt0.4ht0.2Ht0.6 The Scale (υ) 0% 50% 80% 0% 50% 80% 0% 50% 80% Public (%) 99.150 97.800 94.290 87.710 75.190 15.150 73.160 44.180 0.060 p 2.557 2.500 2.388 2.222 1.983 1.082 1.950 1.527 0.364 g 1.367 1.397 1.430 2.282 2.333 2.309 3.356 3.351 3.311 Gini (%) 29.039 29.558 30.287 35.323 36.621 38.060 42.944 44.419 45.538
Note: 1. Definition of variables: % public = the percentage of the public school enrollment rate in the 4th period; p= peer quality in the public school in the 4th period; g= economic growth rate from the 4th period to the 5th period; Gini (%) = the percentage of the Gini coefficient at the end of 4th period.
2. The indexation of agents and schools when writing the human capital accumulation function in Table 1 are omitted.
Table 1 demonstrates that for all three magnitudes of γ2, increasing the scale of vouchers will reduce the public school enrollment rate. Peer quality within public schools becomes lower because the implementation of voucher programs will allow able students from poor families to switch to private schools. With more high-ability students attending private schools, income inequality will increase; although an increase in υ will allow more able students to attend private schools to accumulate their human capital more rapidly, it also means that there will be a decline in public school quality and this will be to the detriment of the human capital accumulation for students remaining within the public school system. If the former dominates the latter, then the economic growth rate will increase, and vice versa. Our simulation results show that with weak peer group effects (γ2 =0), an increase in υ will enhance
14 Another reason to use the 4th period to present the statistics is that it allows us to study the economic
economic growth; however, when peer group effects are strong (γ2 =0.4), increasing
υ will lower the economic growth rate. With moderate peer group effects, the growth rate will rise if υ increases from 0 to 50 per cent, and will fall if υ increases from 50 per cent to 80 per cent.
Table 1 exhibits that with the same scale of vouchers (say, υ =50%), an increase in the peer group effects will lower the public school enrollment rate as well as the peer group quality within public schools. When more students with high innate ability or high parental human capital start attending private schools in order to accumulate more human capital, both the economic growth rate and income inequality will rise along with an increase in γ2. Similar results are found when there are no vouchers, and when υ =80%.
4. NON-LINEAR PEER GROUP QUALITY
So far we have used mean innate ability of the student body within a school to measure peer quality; however, some empirical studies have shown high- and low-ability students may provide unequal contributions to peer quality; Henderson, et. al. (1978) for example, found that peer quality was non-linear. They noted that as a result of the concavity of peer quality, the gain for low-ability students would be greater than the loss for high-ability students. Glewwe (1997) expressed an opposing view, arguing that the potential achievements of students with high innate ability would be undermined by students with low innate ability, more than offsetting the gain of low-ability students from high-low-ability students.
The theoretical literature in this area has tended to use innate learning ability or parental human capital as a measure of peer quality. Epple and Romano (1998) and Caucutt (2002) both defined peer quality as the average innate ability within a school, in line with Equation (2). However, studies by Nechyba (1996), Benabou (1996) and Snipes (1998) assumed that peer quality was determined by parental human capital. Nechyba (1996) defined peer quality as the average parental human capital of students within a school so as to analyze the mobility between communities, whilst Benabou (1996) and Snipes (1998) both assumed that peer quality was non-linear in order to allow for the complementarity or substitutability between individual contributions.
We assume that peer quality is dependent on the individual’s innate ability, with the nature of the function for peer quality being a simple version of that defined in
Benabou (1996). In order to allow for the flexibility of peer quality, we define non-linear peer quality as:
∫
= θ θ1 ) ) ( ) ( ( z g z dz p tj i t j t , θ ∈(−∞,∞). (20)The parameter θ controls the complementarity or substitutability of individual innate ability. When θ = 1, Equation (20) is the same as Equation (2); thus peer quality is determined by the average innate ability of students within the same school. If θ >1, then the amount of school quality enhanced by students with high innate ability is more than the amount brought down by students with low ability. This implies that individual innate ability is more substitutable and this is referred to here as the ‘role model’ type of peer quality. On the other hand, if θ <1, then the amount of school quality brought down by students with low innate ability will be more than the amount raised by students with high ability. This is referred to as the ‘bad apple’ type of peer quality because it implies that individual innate ability is more complementary.15
4.1 ‘Role Model’ and ‘Bad Apple’ Peer Quality
We go on to explore the sensitivity of non-linear peer quality, analyzing both the ‘role model’ and ‘bad apple’ types of peer quality. The peer group effect (γ2) is assigned to its value in the baseline model (0.19). To study the impacts of the ‘role model’ type of peer quality, we set θ = 1.1, 1.8 and 2.5. To analyze the impacts of the ‘bad apple’ type of peer quality, we assign θ = 0.9, 0.2 and –0.5. For each type of peer quality, we study the case both with and without voucher programs with a scale equal to 50 per cent. Tables 2 and 3 present details of economic performance under non-linear peer quality at the end of the 4th period. The variables p and lp represent non-linear peer quality and the mean ability (θ =1) within the public school in the 4th period, respectively.
4.1.1 ‘Role model’ type of peer quality
Table 2 exhibits the simulation results with ‘role model’ type peer quality. The higher the magnitude of θ , the greater the substitutability for an individual’s ability; the
15
Following Snipes (1998), we use the term ‘role model’ and ‘bad apple’ type peer quality to represent the situation for θ > 1 and for θ < 1.
substitutability of each individual’s innate ability becomes clear when we compare p
with lp . As Table 2 shows, p is higher than lp because high-ability students contribute more to school quality than low-ability students.
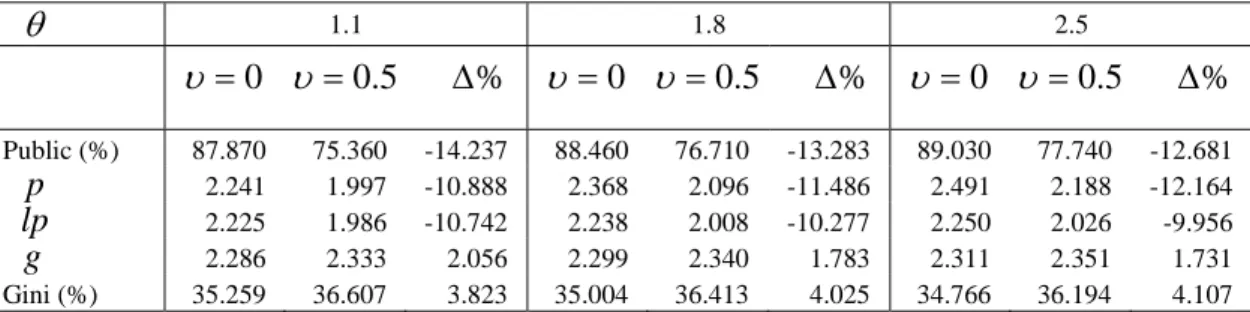
Table 2 ‘Role model’ type of peer quality (γ2 =0.19)
θ 1.1 1.8 2.5 0 = υ υ =0.5 ∆% υ =0 υ =0.5 ∆% υ =0 υ =0.5 ∆% Public (%) 87.870 75.360 -14.237 88.460 76.710 -13.283 89.030 77.740 -12.681 p 2.241 1.997 -10.888 2.368 2.096 -11.486 2.491 2.188 -12.164 lp 2.225 1.986 -10.742 2.238 2.008 -10.277 2.250 2.026 -9.956 g 2.286 2.333 2.056 2.299 2.340 1.783 2.311 2.351 1.731 Gini (%) 35.259 36.607 3.823 35.004 36.413 4.025 34.766 36.194 4.107
Note: * Definition of variables: lp= average innate ability of student body in the public school in the 4th period; for other variables: see Table 1.
For each assigned value of θ , the implementation of voucher programs will reduce the enrollment rate and the peer quality in public schools because more able students and children with richer parents will switch to private schools. Consequently, there will be an increase in both the growth rate and income inequality.
In order to explore the sensitivity of non-linear peer group qualities, we examine the statistics under a mixed educational system, with no voucher program in place, when the substitutability of each individual’s innate ability is equal to 1.1, 1.8 and 2.5. As θ increases, there is a rise in the magnitude of the contribution from high-ability students to public school quality, and thus, more families are willing to send their children to public schools. We find that as θ increases from 1.1, to 1.8, and finally to 2.5, the public school enrollment rate rises from 87.87 per cent, to 88.46 per cent, and then to 89.03 per cent. An increase in θ raises peer quality within a school and hence, also raises school quality. Therefore, an increase in θ will also lead to an increase in economic growth. With more students attending public schools due to an increase in θ , there is a corresponding decline in income inequality. A similar scenario can also be found when voucher programs are introduced.16
We now turn to an examination of the impacts of voucher programs for various levels of θ . The parameter ∆% represents the percentage change in the
16
With vouchers at a scale of 50 per cent, as θ increases from 1.1, to 1.8, and 2.5, the respective public school enrollment rate increases from 75.36 per cent, to 76.71 per cent, and 77.74 per cent.
corresponding statistics, with and without vouchers. Comparing the economic growth before and after the implementation of voucher programs, we find that the higher the level of θ , the smaller the percentage reduction in the public school enrollment rate and the greater the level of income inequality. This is because when θ is high, the human capital accumulation of students remaining in public schools will be enhanced by able students, and hence, more students will remain in public schools after the implementation of voucher programs. Although an increase in θ implies that students in public schools can accumulate more human capital, with a lower percentage increase in the private school enrollment rate, this will reduce the overall increase in economic growth both before and after the implementation of voucher programs.17
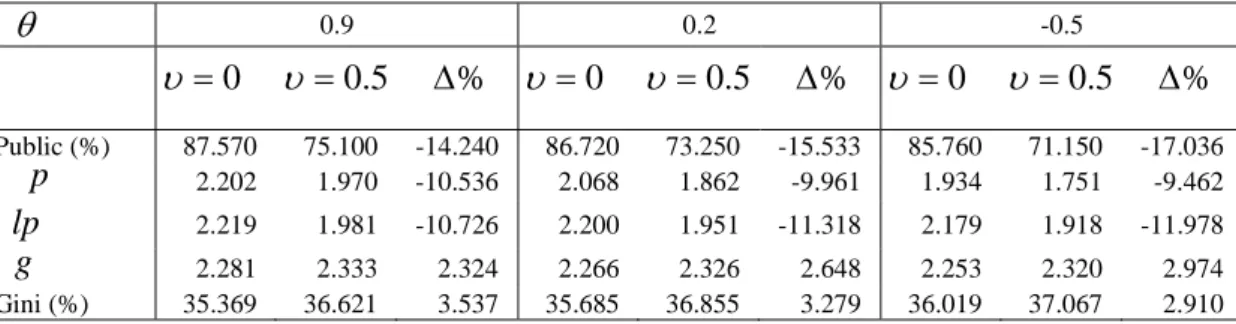
4.1.2 ‘Bad apple’ type of peer quality
In contrast to the ‘role model’ type of peer quality, when θ is less than 1, school quality is brought down by students with low innate ability, largely offsetting the enhancements to school quality provided by students with high innate ability. The statistics on school quality under the ‘bad apple’ type of peer quality are provided in Table 3.
Table 3 ‘Bad apple’ type of peer quality (γ2 =0.19)
θ 0.9 0.2 -0.5 0 = υ υ =0.5 ∆% υ =0 υ =0.5 ∆% υ =0 υ =0.5 ∆% Public (%) 87.570 75.100 -14.240 86.720 73.250 -15.533 85.760 71.150 -17.036 p 2.202 1.970 -10.536 2.068 1.862 -9.961 1.934 1.751 -9.462 lp 2.219 1.981 -10.726 2.200 1.951 -11.318 2.179 1.918 -11.978 g 2.281 2.333 2.324 2.266 2.326 2.648 2.253 2.320 2.974 Gini (%) 35.369 36.621 3.537 35.685 36.855 3.279 36.019 37.067 2.910
Note: * For definition of variables: see Tables 1 and 2.
The lower the magnitude of θ , the greater the level of complementarity will be for an individual’s ability. Due to the impacts of the ‘bad apple’ type of peer quality on school quality, p is smaller than lp, as shown in the table. For a fixed value of θ ,
the enrollment rate in public schools declines when vouchers are introduced.
17 This is because only those students with high parental human capital, or high ability, or both, will
The complementary of innate ability within public schools will push high-ability students to leave public schools, thereby further worsening peer quality within public schools. Those attending private schools will accumulate more human capital whilst those staying in public schools will accumulate less human capital. If the former dominates the latter, then implementation of voucher programs will raise the growth rate, and vice versa. The simulation results show that the implementation of voucher programs will lower peer quality within public schools, whilst increasing both the growth rate and income inequality in all three cases.
Comparing the statistics under a mixed educational system, for different magnitudes of θ , and with no voucher program in place, we find that enrollment in public schools declines with a decrease in θ ; as θ declines from 0.9, to 0.2, and finally to –0.5, the public school enrollment rate declines from 87.57 per cent, to 86.72 per cent, and then to 85.76 per cent. A decrease in θ reduces peer quality within a school and hence, lowers school quality; as θ decreases, there is a corresponding reduction in the economic growth rate. With fewer students attending public schools, as θ decreases, there is a corresponding increase in income inequality. The story is also very similar under a mixed educational system with voucher programs.18
We now turn to an examination of the impacts of voucher programs for various levels of θ. Comparing the economic growth rate before and after the implementation of voucher programs, we find that the smaller the level of θ , the greater the percentage increase in the public school enrollment rate and the economic growth rate. This is because when θ is low, the human capital of students remaining in public schools will be lowered by students of low ability. Hence, the implementation of voucher programs will cause more students to leave public schools for private schools and this will, in turn, raise the economic growth rate.
Comparing Table 2 with Table 3, we find that with the same scale of vouchers, the public school enrollment rate is higher under ‘role model’ peer quality than under ‘bad apple’ peer quality. This implies that the public school is more preferable when peer quality is more substitutable, as opposed to when it is more complementary. Figure 4 presents the economic growth rate and income inequality in the 4th period for
18 With vouchers at a scale of 50 per cent, as θ decreases from 0.9, to 0.2, and finally to -0.5, the
respective public school enrollment rate declines from 75.10 per cent, to 73.25 per cent, and then to 71.15 per cent.
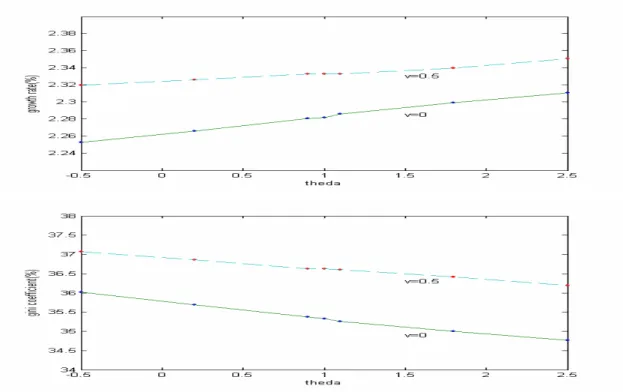
values of θ considered in Tables 1, 2 and 3 when there is no vouchers and when the scale of vouchers equals 5%. It shows that the growth rate goes up with an increase in θ while Gini coefficient goes down with an increase in θ .
Figure 4 Economic performance under different values of θ
5. CONCLUSIONS
A simple dynamic model is constructed in this paper, under a mixed educational system, to explore the impacts of voucher programs on economic performance when there are peer group effects. The government provides all public schooling, as well as tuition vouchers for households attending private schools. With the coexistence of public and private schools, the public/private school enrollment rate is an important determinant of the pattern of growth and inequality. Therefore, a policy of intervention in the educational system would seem to be a necessary element of government policy when targeted growth rates or inequality levels are being pursued, and thus, the impacts of educational reform will be of crucial concern for a government. The two most common instruments used by governments to affect an individual’s decision on education are income tax and vouchers. Changing the tax rate will affect the return on human capital whilst the scale of voucher programs will
determine the public/private school enrollment rate. This paper focuses on the second issue with an examination of several voucher programs.
This study differs from much of the literature relating to vouchers since it analyzes the impact of vouchers on growth and inequality when there are peer group effects. In addition to the problem of segregation, our computation results indicate that an increase in the scale of vouchers will raise income inequality, and suggests further that this is not always growth enhancing. With strong peer group effects, increasing the scale of vouchers will in fact lower the economic growth rate.
In addition to linear peer quality, we also examine cases for non-linear peer quality and find that the impacts of voucher programs on economic performance are sensitive both to the magnitude of the peer group effects in the human capital accumulation function, and the way in which peer interactions affect school quality. Our study indicates that in any future study, a more accurate estimation of the human capital accumulation function and peer quality formulation will be necessary.
APPENDIX 1
School Choice
We first derive the curve to separate parents choosing private and public schools. Note that parents are indifferent between sending their children to public or private schools if ipub i pri u u = , that is: 2 1 1 2 1 1 2 2 1 1 1 1 1 1 2 1 1 ) ( ) ( ] ) ( ) ( ) 1 ( ) ( [ ) 1 ( 1 1 1 1 ) 1 ( ) 1 ( γ γ δγ γ γ γ γ γ γ δγ γ γ δγ γ γ γ γ βγ γ τ + − + − + − − − Γ = − = i t u t t i t t u t i t p h h H p z , (A1) where 1 2 1 1 1 1 1 1 1 1 1 ) 1 ( ] ) ( ) 1 ( [ γ γ γ γ δγ γ γ βγ γ τ + − − − = Γ t t H .
We then determine how much lower zti should be, as hti increases, for parents to be indifferent between sending their children to public or private schools. Taking the total derivatives with respect to zti and hti in equation (A1), we get:
i t i t u t t i t p h dh dz 1 ) 1 ( 2 1 1 1 2 1 2 1 1 2 ) ( ) ( − + − + − Γ + − = γ γ δγ γ γ γ γ γ γ δγ i t i t u t i t u t t dz dz dp h p 1 2 1 2 1 1 2 ) ( ) ( ) 1 ( (1 ) 1 2 1 1 2 γ γ δγ γ γ γ γ γ γ γ γ + − − + − Γ + − + . (A2)
Assuming that that there are enough students in public schools so that a slight change in zti does not affect
u t p : i ≈0 t u t dz dp
, then Equation (A2) becomes:
ti i t u t t i t p h dh dz 1 ) 1 ( 2 1 1 1 2 1 2 1 1 2 ) ( ) ( − + − + − Γ + − = γ γ δγ γ γ γ γ γ γ δγ . Hence, ( ) ( ) 0 1 ) 1 ( 2 1 1 1 2 1 2 1 1 2 < Γ + − = + − − + − γ γ δγ γ γ γ γ γ γ δγ i t u t t i t i t h p dh dz , that is, ( ti) i t h z is a
downward-sloping curve, as shown in Figure 1. From Equations (18) and (19), we know that children with high hti, or high zti, or both, will attend private schools. Hence, the upper right area represents types of children attending private schools whilst the lower left area represents types of children who choose to attend public schools.
APPENDIX 2
Computation of the equilibrium under a mixed educational system in period t
1. First of all, we guess the amount of public education expenditure per student, mtu.
2. Secondly, we assign the peer group effect (ptu) of public schools.
3. Given the tax rate, parental human capital, innate ability, educational policies and values of mtu and
u t
p assigned in steps 1 and 2, parents will optimize their utility by their choice of the school regime and school tuition if they choose to send their children to private schools.
4. We then compute the actual peer group effect ( a t
p ) in public schools after households have made their school decisions.
(i) If ptu = pta, go to step 5.
(ii) If ptu > pta, go back to step 2 and guess a lower peer group effect, ptu. (iii) If ptu < pta, go back to step 2 and guess a higher peer group effect, ptu. 5. Finally, we check the government’s budget.
(i) If the budget is balanced, then stop.
(ii) If there is a budget surplus, then we increase mtu and repeat steps 3 to 5.
(iii) If there is a budget deficit, then we decrease mtu and repeat steps 3 to 5.
6. Based on the values of ptu , u t
m computed in steps 4 to 5, we then calculate children’s human capital according to the human capital accumulation function of equation (4). This forms the human capital distribution for period t+1.
REFERENCES
Becker, G.S., K.M. Murphy and R. Tamura (1990), ‘Human Capital, Fertility and Economic Growth’, Journal of Political Economy, 98: 12-37.
Benabou, R. (1996), ‘Heterogeneity, Stratification and Growth: Macroeconomic Implications of Community Structure and School Finance’, American Economic Review, 86: 584-609. Bradford, D.F. and D.N. Shaviro (1999), The Economics of Vouchers, NBER Working Paper
No.7092.
Card, D. and A. Krueger (1992), ‘Does School Quality Matter? Returns to Education and the Characteristics of Public Schools in the US’, Journal of Political Economy, 100: 1-40.
Caucutt, E.M. (2002), ‘Educational Vouchers When There Are Peer Group Effects - Size Matters’, International Economic Review, 43: 195-222.
Chen, H.-J. (2004), “Educational Systems, Growth and Income Distribution: A Quantitative Study”, Journal of Development Economics (forthcoming).
Deininger, K. and L. Squire (1996), A New Data Set Measuring Income Inequality, World Bank
Economic Review, 10: 565-91.
de la Croix, D. and M. Doepke (2003), ‘Inequality and Growth: Why Differential Fertility Matters’, American Economic Review, 93: 1091-1113.
Epple, D. and R.E. Romano (1998), ‘Competition between Private and Public Schools, Vouchers and Peer-Group Effects’, American Economic Review, 88: 33-62.
Epple, D. and R.E. Romano (2002), Educational Vouchers and Cream Skimming, NBER Working Paper No.9354.
Fernandez, R. and R. Rogerson (1997), ‘Education Finance Reform: A Dynamic Perspective’,
Journal of Policy Analysis and Management, 16: 67-84.
Glewwe, P. (1997), ,Estimating the Impact of Peer Group Effects on Socioeconomic outcomes: Does the Distribution of Peer Group Characteristics Matter?’, Economics of Education
Review, 16: 39-43.
Glomm, G. (1997), ‘Parental Choice of Human Capital Investment’, Journal of Development
Economics, 53: 99-114.
Glomm, G. and B. Ravikumar (1992), ‘Public versus Private Investment in Human Capital: Endogenous Growth and Income Inequality’, Journal of Political Economy, 100: 818-34. Henderson, V., P. Mieszkowski and Y. Sauvageau (1978), ‘Peer Group Effects and Educational
Johnson, G.E. and F.P. Stafford (1973), ‘Social Returns to Quantity and Quality of Schooling’,
Journal of Human Resources, 8: 139-55.
Loury, G.C. (1981), ‘Inter-generational Transfers and the Distribution of Earnings’,
Econometrica, 49: 843-67.
Lucas, R.E. Jr. (1988), ‘On the Mechanics of Economic Development’, Journal of Monetary
Economics, 22: 3-42.
Nechyba, T.J. (1996), Public School Finance in a General Equilibrium Tiebout World:
Equalization Programs, Peer Effects and Private School Vouchers, NBER Working Paper
No.5642.
Rosen, H.S. (1995), Public Finance (4th edn.), Chicago: Richard D. Irwin, Inc.
Rothschild, M. and L.J. White (1995), ‘The Analytics of the Pricing of Higher education and Other Services in Which the Customers are Inputs’, Journal of Political Economy, 103: 573-86.
Snipes, S. (1998), School District Finance and Human Capital Accumulation, Ph.D Dissertation, Los Angeles: University of California.
Rosenzweig, M.R. and K.I. Wolpin (1994), ‘Are There Increasing Returns to the Intergenerational Production of Human Capital?’, Journal of Human Resources, 29: 670-93. Uzawa, H. (1965), Optimum Technical Change in an Aggregative Model of Economic Growth,
International Economics Review, 6: 18-31.
West, E.G. (1997), ‘Education Vouchers in Practice and Principle: a Survey’, World Bank
Research Observer, 12: 83-103.
Zhang, J. (1996), ‘Optimal Public Investments in Education and Endogenous Growth’,