國立交通大學交通運輸研究所
碩士學位論文
綠色行銷下消費者之綠色消費行為分析
Analysis of green purchasing under green marketing
指導教授: 許鉅秉 教授
研 究 生: 相元翰
I 摘要 環保是近年來的趨勢,許多國家已經發布規章來控制消費者和企業對環境 所造成的影響。如今不只是政府,消費者也越來越有環境意識。因此,綠色消 費和綠色行銷逐漸風行於商業活動中。但是綠色市場的表現卻是令人失望的。 先前的研究專注在綠色消費的心理因素影響,但是消費者的需求仍然是需 要被滿足的。因此我們結合心理學和行銷學為綠色消費提出一套新的概念性架 構。 為此,我們選擇了低價格和高價格的產品成為我們的分析目標並且提出 十四項 假說。我們建立流程圖來檢驗所提出的因素以及相關假設。根據隨機抽 樣的調查數據,我們使用LISREL 來進行分析。我們先做整體消費者的測試, 之後再隨著收入水準和教育水準將消費者分群。驗證的結果顯示每條假說被接 受或者拒絕取決於不同種類的消費者和產品。根據我們的分析,我們發現每個 因素造成的影響會隨不同種類的消費者和綠色的產品而變。不僅是環境意識, 業界常使用的行銷工具也能有效影響綠色的購買意圖。這表示銷售人員想要推 銷不同綠色產品給不同消費者的時候,他們應該首先分辨消費者和產品的類型 然後使用不同的銷售工具。簡言之,雖然我們不能只用環境意識銷售綠色的產 品,但是它確實會影響消費者,而綠色產品實際上也是可以被行銷的。 關鍵字:綠色行銷,綠色消費,消費者行為,結構方程模式,LISREL
II
Abstract
“Green” has been a trend for several years. Many countries have issued regulations to control the impact caused by consumers and companies. Nowadays, not only government but also consumers have more and more awareness about environment. Thus, green consumption and green marketing are gradually prevailed among business area. But performance of green market is still disappointing.
Previous researches concentrate on analyzing the psychological effect on green consumption. But the consumers` requirements of product attributes still need to be satisfied. Thus we combine psychology and marketing concept to propose a new conceptual framework for green consumption. To do so, we choose low-price and high-price products to be our objects and postulate fourteen respective hypotheses. A hypothetical model is established to analyze these constructs and their correlations in the proposed conceptual framework. Based on the survey data collected randomly in Taiwan, we use the LISREL analytical approach. At first, we use total samples to test our conceptual framework, and then we separate our samples with income-level and education-level and we test both low-price and high-price products with every kind of consumers.
The empirical results indicated that every hypothesis is accepted or rejected depends on different kinds of consumers and products. According to our analysis, we find the effects of every construct are changed with different kinds of consumers and green products. Not only environment awareness but most used marketing tools can effectively affect green purchase intention. That means when marketers want to promote different green products to different consumers, they should identify the type of consumers and products first and then use diverse marketing tools. In brief, although we can`t market green products only with environment awareness, it does affect consumers and we also find that green products actually can be marketed.
III
誌謝
寫論文的時候,時間似乎總是過得特別快,一眨眼兩年就過了,如今辛 苦也有了代價。這篇碩士論文之所以可以順利如期完成,都要歸功於在我身邊 一直陪伴著我的師長,朋友以及家人。首先,我要感謝我的指導教授,許鉅秉 老師,從一開始訂碩士論文題目到之後的論文撰寫,老師都幫了很多的忙。老 師不會限制我們思考的空間,並且會依照每個學生不同的狀況給予不同的指 導,同時也會主動提供我一些論文方向,把我導引到對的軌道上,我十分的感 謝許鉅秉老師。 除此之外,班上同學也是現成的難兄難弟,繳交論文計畫書、進度審查、 論文初稿前,大家都會一起窩在實驗室裡到晚上十一、二點,遇到瓶頸時也會 互相討論打氣。當然,該休息的時候,彼此的娛樂交流也是沒有少過的。多虧 了有這一群好同學,讓撰寫論文的整個期間都充滿了歡笑與樂趣。 最後,我也要感謝我的家人還有我的好朋友,你們總是可以在我最疲累最 需要休息的時候,即時送上你們的加油打氣與關心,這也是我可以繼續努力下 去的動力之一,謝謝你們。 謹志於交通大學交通運輸研究所 民國九十七年六月
IV
Table of Contents
Chapter 1 Introduction ...1
1.1 Motivation and background ...1
1.2 Propose of research ...2
1.3 Research limit ...2
1.4 Research procedure ...2
Chapter 2 Literature Review ...5
2.1 Green marketing ...5
2.1.1 Definition of green marketing ...5
2.1.2 Trend of green marketing ...6
2.1.2.1 Execution intention of enterprises ...6
2.1.2.2 Regulation pressure ...7
2.2 Consumer behavior ...7
2.2.1 Definition of consumer behavior ...7
2.2.2 Analysis of consumer`s decision ...8
2.2.3 Theory of consumer behavior ...10
2.2.3.1 Theory of Reasoned Action (TRA) ...10
2.2.3.2 Theory of Planned Behavior (TPB) ... 11
2.3 Green consumption ...11
2.3.1 Definition of green consumption ... 11
2.3.2 Trend of green consumption ...12
2.3.3 Green consumers category ...12
Chapter 3 Conceptual framework and hypotheses ...14
3.1 Conceptual framework ...14 3.1.1 Independent constructs ...14 3.1.2 Mediators ...15 3.1.3 Dependent construct ...17 3.2 Hypotheses ...17 3.3 Measurements ...21 Chapter 4 Methodology ...24 4.1 Descriptive Statistics ...24 4.2 Reliability ...24 4.3 Validity ...25
4.4 Structural Equation Modeling (SEM) ...25
4.5 Goodness-of-Fit index of model ...27
Chapter 5 Analysis of results ...28
5.1 Sample analysis ...28
5.2 Reliability and validity analysis ...29
5.3 Structural Model ...30
V
5.3.2 Structural model of Variable-frequency AC ...33
5.4 Analysis of Result ...36
5.5 Sample Clustering ...37
5.6 Reliability and validity analysis (Sample clustering) ...37
5.7 Measurement models analyzing ...58
5.8 Structural model (Sample Clustering) ...63
5.4.1 Low-income, recycled paper ...63
5.4.2 High-income, recycled paper ...66
5.4.3 College, recycled paper ...69
5.4.4 Master, recycled paper ...72
5.4.5 Low-income, variable-frequency AC ...75
5.4.6 High-income, variable-frequency AC ...78
5.4.7 College, variable-frequency AC ...81
5.4.8 Master, variable-frequency AC ...84
5.9 Difference analysis ...87
5.9.1 Compare products types ...87
5.9.2 Compare consumers types ...88
Chapter 6 Conclusions ...89
6.1 Conclusions ...89
6.2 Marketing implication ...89
6.3 Directions for future research ...92
Reference ...93
VI
List of Figures
Figure 1.1 Procedure of research ... 4
Figure 2.1 Traditional marketing strategy and green marketing strategy ... 6
Figure 2.2 A generic model of consumer problem solving ... 8
Figure 2.6 Theory of Reasoned Action (TRA) ... 10
Figure 2.8 Theory of Planned Behavior (TPB) ... 11
Figure 5.1 Structural model (Recycled paper) ... 30
Figure 5.2 Structural model (Variable-frequency AC) ... 33
Figure 5.3 Structural model (Low-income, recycled paper) ... 63
Figure 5.4 Structural model (High-income, recycled paper) ... 66
Figure 5.5 Structural model (College, recycled paper) ... 69
Figure 5.6 Structural model (Master, recycled paper) ... 72
Figure 5.7 Structural model (Low-income, variable-frequency AC) ... 75
Figure 5.8 Structural model (High-income, variable-frequency AC) ... 78
Figure 5.9 Structural model (College, variable-frequency AC) ... 81
VII
List of Tables
Table 2.1 Green consumers’ category and their distribution ... 13
Table 3.1 Decision Factors and Influence Factors ... 17
Table 3.2 Measurements of each construct ... 21
Table 3.2 Measurements of each construct (continued) ... 22
Table 3.2 Measurements of each construct (continued) ... 23
Table 4.1 Goodness-of-Fit index of model ... 27
Table 5.1 Sample structure ... 28
Table 5.2 Adjusted Cronbach`s α value (Recycled paper) ... 29
Table 5.3 Adjusted Cronbach`s α value (Variable-frequency AC) ... 29
Table 5.4 Adjustment with factor loading ... 30
Table 5.5 Goodness-of-fit of structural model (Recycled paper) ... 31
Table 5.6 Test results of the hypotheses (Recycled paper) ... 31
Table 5.7 Effects on latent variable (Recycled paper) ... 32
Table 5.8 Goodness-of-fit of structural model (Variable-frequency AC) ... 34
Table 5.9 Test results of the hypotheses (Variable-frequency AC) ... 34
Table 5.10 Effects on latent variable (Variable-frequency AC) ... 35
Table 5.11 comparison of effects on green purchase intention ... 36
Table 5.12 Sample clustering ... 37
Table 5.13 Cronbach`s α value (Low-income, recycled paper) ... 38
Table 5.14 Cronbach`s α value (High-income, recycled paper) ... 39
Table 5.15 Cronbach`s α value (College, recycled paper) ... 40
Table 5.16 Cronbach`s α value (Master, recycled paper) ... 41
Table 5.17 Cronbach`s α value (Low-income, variable-frequency AC) ... 42
Table 5.18 Cronbach`s α value (High-income, variable-frequency AC) ... 43
Table 5.19 Cronbach`s α value (College, variable-frequency AC) ... 44
Table 5.20 Cronbach`s α value (Master, variable-frequency AC) ... 45
Table 5.21 Adjusted Cronbach`s α value (Low-income, recycled paper) ... 46
Table 5.22 Adjusted Cronbach`s α value (High-income, recycled paper) ... 46
Table 5.23 Adjusted Cronbach`s α value (College, recycled paper) ... 47
Table 5.24 Adjusted Cronbach`s α value (Master, recycled paper) ... 47
Table 5.25 Adjusted Cronbach`s α value (Low-income, variable-frequency AC) ... 48
Table 5.26 Adjusted Cronbach`s α value (High-income, variable-frequency AC) ... 48
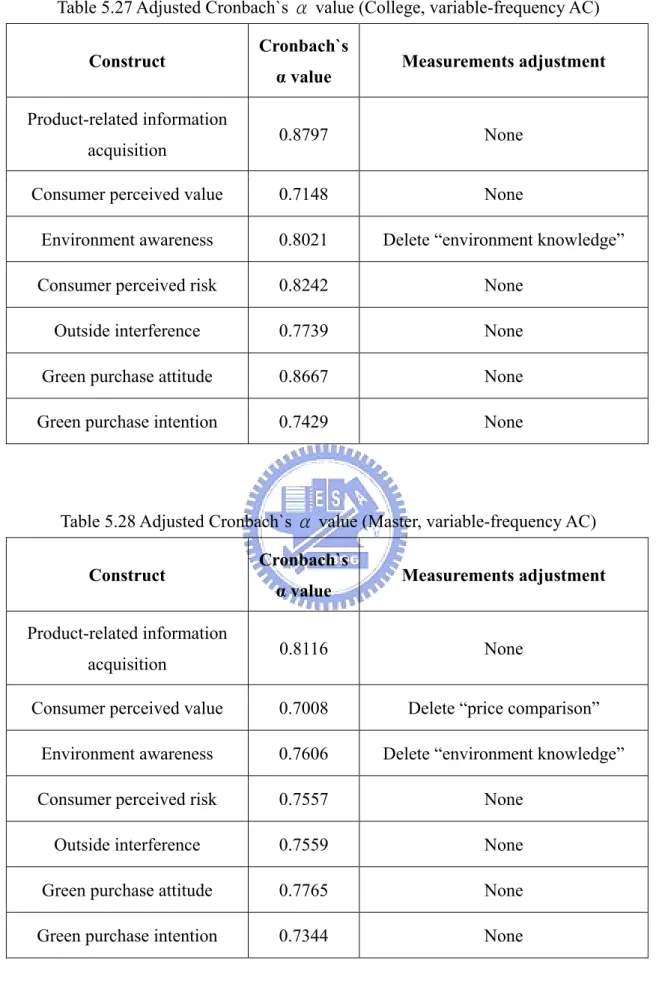
Table 5.27 Adjusted Cronbach`s α value (College, variable-frequency AC) ... 49
Table 5.28 Adjusted Cronbach`s α value (Master, variable-frequency AC) ... 49
Table 5.29 Composite reliability (Low-income, recycled paper) ... 50
Table 5.30 Composite reliability (High-income, recycled paper) ... 51
VIII
Table 5.32 Composite reliability (Master, recycled paper) ... 53
Table 5.33 Composite reliability (Low-income, variable-frequency AC) ... 54
Table 5.34 Composite reliability (High-income, variable-frequency AC) ... 55
Table 5.35 Composite reliability (College, variable-frequency AC) ... 56
Table 5.36 Composite reliability (Master, variable-frequency AC) ... 57
Table 5.37 Adjustment of measurement model ... 58
Table 5.38 Measurement model (Low-income, recycled paper) ... 59
Table 5.39 Measurement model (High-income, recycled paper) ... 59
Table 5.40 Measurement model (College, recycled paper) ... 60
Table 5.41 Measurement model (Master, recycled paper) ... 60
Table 5.42 Measurement model (Low-income, variable-frequency AC) ... 61
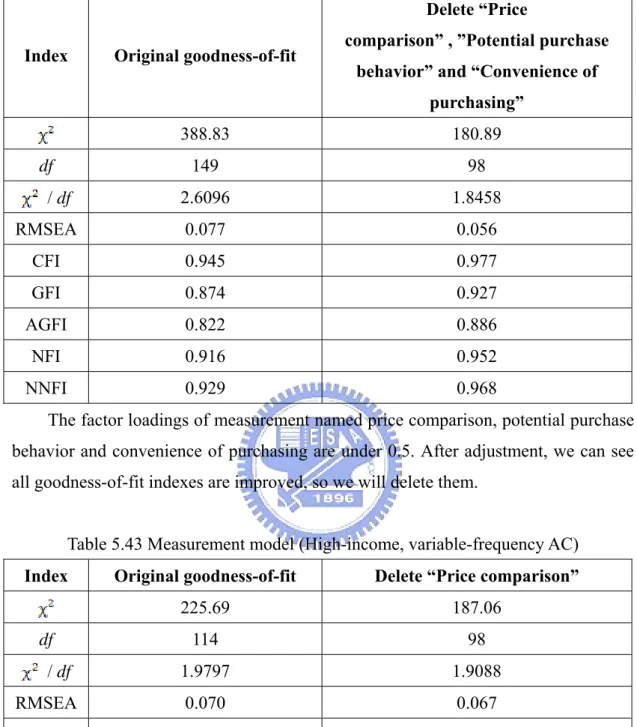
Table 5.43 Measurement model (High-income, variable-frequency AC) ... 61
Table 5.44 Measurement model (College, variable-frequency AC) ... 62
Table 5.45 Measurement model (Master, variable-frequency AC) ... 62
Table 5.46 Goodness-of-fit of structural model (Low-income, recycled paper) ... 64
Table 5.47 Test results of the hypotheses (Low-income, recycled paper) ... 64
Table 5.48 Effects on latent variables (Low-income, recycled paper) ... 65
Table 5.49 Goodness-of-fit of structural model (High-income, recycled paper) ... 67
Table 5.50 Test results of the hypotheses (High-income, recycled paper) ... 67
Table 5.51 Effects on latent variables (High-income, recycled paper) ... 68
Table 5.52 Goodness-of-fit of structural model (College, recycled paper) ... 70
Table 5.53 Test results of the hypotheses (College, recycled paper) ... 70
Table 5.54 Effects on latent variables (College, recycled paper) ... 71
Table 5.55 Goodness-of-fit of structural model (Master, recycled paper) ... 73
Table 5.56 Test results of the hypotheses (Master, recycled paper) ... 73
Table 5.57 Effects on latent variables (Master, recycled paper) ... 74
Table 5.58 Goodness-of-fit of structural model (Low-income, variable-frequency AC) ... 76
Table 5.59 Test results of the hypotheses (Low-income, variable-frequency AC)... 76
Table 5.60 Effects on latent variables (Low-income, variable-frequency AC) ... 77
Table 5.61 Goodness-of-fit of structural model (High-income, variable-frequency AC) ... 79
Table 5.62 Test results of the hypotheses (High-income, variable-frequency AC) ... 79
Table 5.63 Effects on latent variables (High-income, variable-frequency AC) ... 80
Table 5.64 Goodness-of-fit of structural model (College, variable-frequency AC) .... 82
Table 5.65 Test results of the hypotheses (College, variable-frequency AC)... 82
Table 5.66 Effects on latent variables (College, variable-frequency AC)... 83
Table 5.67 Goodness-of-fit of structural model (Master, variable-frequency AC) ... 85
IX
Table 5.69 Effects on latent variable (Master, variable-frequency AC) ... 86 Table 5.70 Comparison of under different product ... 87 Table 5.71 Comparison of different consumers ... 88
1
Chapter 1 Introduction
1.1 Motivation and background
With the continuous growth of global economics, every country becomes richer and richer. Higher GDP changes the way of consuming and producing. Speedy development of population and urbanization bring heavy environment burden caused by daily consumption. Urban resource is depleted faster and environment pollution derived from business activities is increased. In 1987, World Commission on Environment and Development (WCED) proposed the idea named “sustainable development”. It means the sustainable ecological environment and nature resource is the only possibility of long-term development of society and economics. Based on the common consensus, every country tries to find the way to combine economics development with environment protection.
Not just government, consumers also follow this trend. When consumers notice the aggravation of environment has affected living quality, even their life style, they will try to purchase those products which make minimum environment impact. On one hand consumers achieve the purpose of purchasing, and on the other hand they reduce the impact of environment. So, there is a term called “green consumption.” When consumers are under the incentive and lure of green consumption, manufacturers are forced to produce green products and use green marketing to sell these green products. So, these components form a new and developing green market. In order to be the most profitable, enterprises take the concept of environment protection as a part of their operation strategy to build up the new enterprise culture. “Green consumption” and “green marketing” have increasingly been the object in recent years (Minton et al., 1997; Kalafatis et al. 1999; Follows et al., 2000).
Under the principle of supply and demand, it seems that there would be a new environment protection market. But in recent decade, the market share of green products is still constant or even declining. The reason of the disappointing green market performance is the less positive consumers. Davis (1993) concluded those questions into two parts: over complicated green marketing and cold consumers` response. He claimed that enterprises should solve these problems by understanding and satisfying consumers` needs.
2
consuming intention of consumers. The most important consumer decision of consuming green products is how to maximize consumer utility and maintain the environment quality at the same time. Nowadays, enterprises not only produce green products but also use green marketing to maximize the utility of consumers. Thus enterprises can effectively raise the amount of green consumption. Based on these statements, analyzing effect of green marketing on green consumption and the major determinant of green consumption are very important objects.
1.2 Propose of research
According to the motivation and background, using green marketing is the most effective way to promote green consumption. But literatures of green consumption usually focus on psychology factors or outside interference factors and barely consider the effect of enterprises` marketing strategy. So, we try to combine factors of psychology and marketing to propose a new conceptual framework for green consumption and further analyze green consumption under green marketing. We will use socio-economic characteristic to separate our samples and we also use two different kinds of products to test our conceptual framework. One kind is low-involvement product and the other kind is high-involvement product. We will compare the analytic result between different kinds of consumers and products.
1.3 Research limit
z We only adopt some most used marketing concepts to build our new conceptual framework for green products.
z Because our samples are all collected randomly in Taiwan, we don`t consider the effect of culture and the habit of purchasing.
z We only use income-level and education-level to separate our samples.
1.4 Research procedure
1. Problem definition
Discovering and identifying problem through research background and motivation. Thinking over the necessary methodology and tools related to this research. And further decide the direction and goal of this research.
2. Literature review
Colleting and reviewing papers which focus on the area of green marketing, green consumption, and consumer behavior and take literature review as the
3
fundamental of our conceptual framework. 3. Propose conceptual framework
Combining psychology and marketing constructs proposed by related reference to establish conceptual framework. We design measurements for each construct and postulate fourteen hypotheses.
4. Design questionnaire
We design questionnaire for both low-involvement product and high-involvement product to gather consumers` data about green purchasing. 5. Data Analysis
We use descriptive statistics to shoe the sample distribution and use LISREL to examine our data collected by questionnaire for different kinds of consumers and products.
6. Conclusions
Based on the analytic result, we will interpret, conclude and compare the difference between different kinds of consumers and products.
4
Problem
definition
Design
questionnaire
Propose
hypotheses
Design
measurements
Propose conceptual framework
Consumer
behavior
Green
consumption
Green
marketing
Literature
review
SEM
Conclusions
Validation and analysis of conceptual
framework and hypotheses
Statics
analysis
Collect data
5
Chapter 2 Literature Review
2.1 Green marketing
2.1.1 Definition of green marketing
In 1950, AMA (American Marketing Association) defined marketing as “the business activities that bring the goods and services of producers to consumers.” Until 2004, AMA redefined marketing as “marketing is a kind of organization and procedure that create, communicate and deliver value to the customers, and operate the customer relationship to benefit organization and stakeholders.” Kotler (2001) defined the process of marketing as analyzing marketing, targeting marketing, developing mix marketing and managing marketing effects. Green marketing was prevailed in the late of 1980s; it contains various business activities, like product improvement, package improvement, producing process or advertisement. The goal of green marketing is bringing environment issue into marketing. If we can make consumers consider that information of environment protection during their decision process, we can push enterprises to produce more environmental friendly products.
But many people think that green marketing is only about promoting and advertising those environment attributes of products like recyclable, refillable, or reusable. Consumers usually associate those environmental attributes with green marketing. Also those are the claims of green marketing, actually green marketing is a more extensive concept. It can be used on consumer goods, industrial products and even service.
Before providing an alternative definition, it should be noted that no one definition or terminology has been universally accepted. At the same time, the terms used in green marketing area are different, like green marketing, environmental marketing and ecological marketing. This lack of consistency makes some problems. There is no issue can`t be evaluated if all researchers have a different perception of what they are researching.
Polonsky (1994) proposed a definition that encompasses all major components of other definitions. ”Green or environmental marketing consists of all activities designed to generate and facilitate exchanges for satisfying human needs or wants with minimal detrimental impact on the natural environment.” The most important
6
thing is that consumption must cause damage of environment, so the purpose of green marketing is to minimize the environment impact and satisfy consumers at the same time.
In figure 2.1, Rex and Baumann (2007) pointed out the difference between traditional marketing proposed by Kotler (2001) and green marketing. They thought the major area of green marketing should be the measurement of market size, identifying green consumers and positioning with eco-label. From traditional marketing aspect, there are many ways can be used to improve green marketing, like analysis of present and potential market, broaden the scale of targeted consumers. Green marketing will be more competitive if combines 4P (product, price, place, promotion) of traditional marketing strategy and eco-label that provide environment information to consumers.
Figure 2.1 Traditional marketing strategy and green marketing strategy
Source: Rex et al. (2007) 2.1.2 Trend of green marketing
2.1.2.1 Execution intention of enterprises
Nowadays, both consumers and enterprise care environment and nature more than before. From a report that researched 16 cities, Ottman (1993) pointed out that over 50% consumers care the environment impact. A research in Australia, EPA-NSW (1994) pointed out over 85% sample consumers believe that everyone should be responsible for the environment impact and even 80% sample consumers claimed that they correct their behavior for this reason. Because the consumers demand is changed, that also pushes companies to change. Many companies realize they should be more responsible for environment. They think the goal of environment and profit ought to be the same, and that makes environment issues become a part of enterprise culture.
7
a chance to achieve their goal. Keller (1987)、McIntosh (1990)、Freeman and Liedtka (1991)、Shearer (1990) and Davis (1992) think companies have the ethic obligation to take responsibility for environment. NAAG (1990) pointed out government will enforce companies to take the responsibility and the environment strategy used by competitors will also enforce companies to change their environment marketing strategy. According to above researches, we could assume that those companies include environment concern into their marketing strategy will be more competitive than those companies without environment concern.
2.1.2.2 Regulation pressure
Governments try to protect consumers and society with green marketing, so they build up licenses mechanism to control harmful substance. Under some situations, governments try to appeal end consumers to become more responsible or punish those irresponsible consumers through levying taxes.
Environment regulations have become a tool of economic sanctions. In recent years, European Union gradually proclaims several environment regulations, like EuP (Directive of Eco-design Requirements of Energy-using Products), RoHS (Restriction of the use of certain Hazardous Substance in electronics and electricity equipment) and WEEE (Waste Electronics and Electricity Equipment). European Union uses these regulations to control manufacturers to damage environment and improve the environment quality.
2.2 Consumer behavior
2.2.1 Definition of consumer behavior
Consumer behavior is a integrate science; it includes economics, marketing, psychology and sociology. American Marketing Association(AMA) defined consumer behavior as a dynamic relationship between interaction of emotion, cognition and behavior. That also means that consumer behavior includes the feelings and thoughts experienced by consumers and the behavior during their buying process. At the same time, it also includes environment which affect consumers’ emotion, cognition and behavior, like other consumers comment, advertisement marketing, product price information, package, product appearance …etc.
8 2.2.2 Analysis of consumer`s decision
When consumers purchase products they have to make decision. Different brand, product attributes, or appearance will affect consumers` decision. Consumers will carefully evaluate cognitive information. Sometimes the key point is not only related to the outside factors, like brand, price, purchase environment, but also the feeling perceived indirectly. Although the procedure of purchasing is complicated, marketers are very interested in consumer decision process and wish to increase sales through understanding consumer decision process.
Peter and Olson (2001) pointed out that if we take the process of making decision as the process of solving problem, then it includes problem recognition, search for alternative solution, evaluation of alternatives, purchase, post-purchase use and reevaluation of chosen alternative. They depicted above five steps as follow:
Figure 2.2 A generic model of consumer problem solving
9
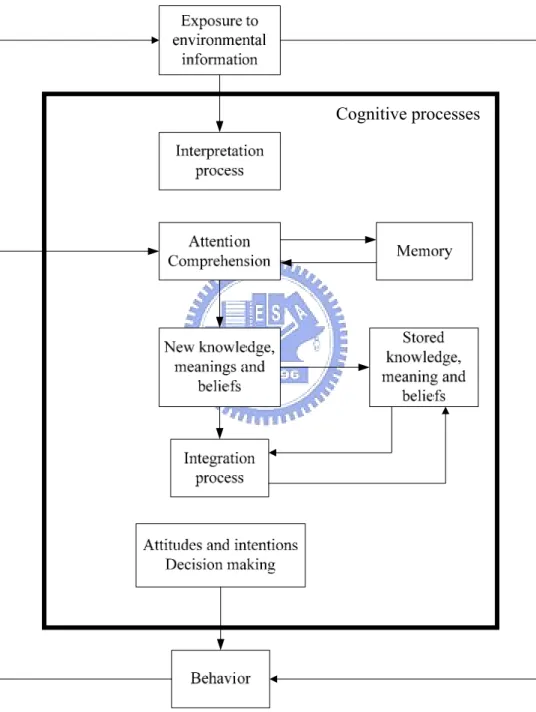
However, purchase decision process is an integrate process. It includes product understanding, product meaning, purchase environment and beliefs that come from memory and inclination. Consumers integrate above factors and make their decision from many alternatives. Peter and Olson (2001) arranged consumer cognition process as follow:
Figure 2.3 Cognitive Processes in Consumer Decision Making
Source: Peter and Olson (2001)
10 2.2.3 Theory of consumer behavior
Theory of reasoned action (TRA) proposed by Ajzen and Fishbein(1975) and theory of planned behavior(TPB) proposed by Ajzen(1991) are both famous theory of consumer behavior. Both theories are layer concept. It means that attitude affects intention then intention affects behavior. Ajzen and Fishbein defined attitude, intention and behavior as follow:
z Attitude: it is continuous trend that people like or dislike particular object through studying or experience.
z Behavior intention: subjective possibility of executing particular behavior, it reflects personal intention of particular behavior.
z Behavior: transferring intention to actual behavior.
2.2.3.1 Theory of Reasoned Action (TRA)
In TRA, Subjective norm is seen as a combination of perceived expectations from relevant individuals or groups along with intentions to comply with these expectations. In other words, the person's perception that most people who are important to him or her think he should or should not perform the behavior in question. Attitude and subjective norm will influence intention and intention directly influences behavior. When people have more positive attitude toward behavior, the behavior intention is stronger; when people have more negative attitude toward behavior, the behavior intention is weaker. In figure 2.6, we can see those factors do not only influence each other in one-way. Behavior intention is influenced by attitude and subjective norm further affect behavior. And behavior feeds back attitude and subject norm. It is circulating interaction.
Behavioral Beliefs Normative Beliefs Behavior Subjective norm (SN) Behavioral intention Attitude to behavior (AB) Affect Feedback
Figure 2.6 Theory of Reasoned Action (TRA)
11 2.2.3.2 Theory of Planned Behavior (TPB)
Ajzen (1991) found that personal behavior is not totally voluntary. So, he expanded TRA and added a new concept called “perceived behavior control” then developed a new theory named theory of planned behavior (TPB). Perceived behavioral control means that consumers will evaluate personal experience and expectable obstruct before making their purchasing decision. When consumers perceive that they can control more resources and opportunities, they have stronger perceived behavioral control.
TPB contains attitude, subjective norm, perceived behavior control, behavior intention and behavior. The difference between TRA and TPB is that Ajzen proposed most personal behavior is between totally under willingness and totally not under willingness. But if the problem is extremely under control or out of control, the result of TRA and TPB is almost equal.
Affect Feedback
Figure 2.8 Theory of Planned Behavior (TPB)
Source: Ajzen (1991)
2.3 Green consumption
2.3.1 Definition of green consumption
The basic concept of green consumption is that people can`t avoid daily purchase, so we can only do our best to reduce the impact derived from our consumption. The most concrete way is to encourage consumers to purchase environment friendly products, like: recycled paper. Reducing pollution of nature through buying those environment friendly products is what we call green consumption. Peattie (1993)
12
defined green consumption as “after realizing of environment depletion, consumers will try to purchase products and request companies to produce products with minimum environment impact. Consumers can achieve their purchasing goal and damage environment less. It is a sustainable and more responsible way to purchase.”
2.3.2 Trend of green consumption
Consumption behavior is the major reason of environment impact. To reduce the impact, there are two main methods. One is promoting green consumption and the other is decreasing the impact during the manufacture process of products and service. Recently, many countries use environment certificate to promote green consumption and use policy to stimulate consumers to purchase green products. And some regions even use environment regulations as economic punishment, like RoHS, WEEE, REACH announced by European Union.
2.3.3 Green consumers category
In traditional marketing, socioeconomic factor is key factors of purchasing intention of specific products. But in green marketing, it is not only socio-demographic factors but also more about the effort made by consumers for specific environment issues.
Ottman (1998) proposed the concept of green consumer is difficult to demarcate with socio-demographic factors, like: region, gender, age, education, income etc. However, the women who are 30-44 years old, well educated and high income (30000 us dollar/per year) are easiest to accept green marketing and products. Protecting beloved people and the future of their children trigger them to behavior more environmentally. Their purchasing ability and affection of peer also make them become the main marketing target. Schwartz and Miller (1991) classified American consumers into five groups:
z True-Blues
10 % of Americans, they have strong environment consciousness and practice what they preach. They are the most enthusiastic environment protectors. They believe they can save environment by their own and contribute energy to protect environment and affect other people.
13
z Greenbacks
5 % of Americans, they concern about the environment issues, but they are too busy to change their living style. They have willingness to pay more for environment friendly products. Although they are not totally active to involve activities of environment protection, they show their support by consumption. They claim that they are willing to pay 22% extra. And in this group, green consumption is very popular.
z Sprouts
33 % of Americans, they are only willing to join activities of environment protection needed less effort. Resource recycling is their major activity. Like true-blues and greenbacks, they have willingness to buy green products, but they only want to pay 4% extra.
z Grousers
15 % of Americans, they do not believe that they can better environment. In contrast, they think that government and companies should take full responsibility. They feel confused and ignorant about environment issues. Although 45% of grousers will do resource recycling regularly, they are not voluntary. They just cooperate with local laws but make effort for improving environment. They will also use excuses to rationalize their laziness, like: we are too busy, the price is too high, there is nothing changed even we try our best...etc.
z Basic Browns
37 % of Americans, they ignore environment issues, they will find excuses for themselves. They think environment issues are not so serious. Because of their indifference, in this group, the rate of resource recycling and green consumption is low.
Table 2.1 Green consumers’ category and their distribution
1990 1996 Characteristic
True-Blues 11% 10%
Active environmentalists
Greenback 11% 5%
Sprouts 26% 33% Swing group
Grousers 24% 15%
Not Active environmentalists
Basic Browns 28% 37%
14
Chapter 3 Conceptual framework and hypotheses
3.1 Conceptual framework
In this chapter, we propose our conceptual framework, and we will define every construct. The independent constructs are environment awareness and outside interference. The mediators are products involvement, consumer perceived value, consumer perceived risk and green purchase attitude. And the dependent construct is green purchase intention.
3.1.1 Independent constructs
z Environment Awareness
Environment concern and environment knowledge are most used constructs of green consumption. Environment concern means that consumers are worried
about the environment impact. When consumers are concerned about
environment, they have stronger willingness to purchase green products. Baldassare and Katz (1992) proposed that personal environment threat is a better predictor of overall environment practices than demographic variable and political factors.
Fryxell (2003) defined environment knowledge is general knowledge of the facts and concepts of nature and ecosystem. It includes the impacts and understanding of environment and how to maintain sustainable development. Comparing to environment concern, environment knowledge does not just consider the environment impact but also understand the reasons and solutions of environment problems. Hines et al. (1987) proposed that environment knowledge is most important factor of predicting environment protection behavior.Rokicka (2002) proposed those who have higher level of environment knowledge will behave more environmentally. And Mostafa (2006) also proved the positive relationship between environment knowledge and green purchase intention.
Based on previous research, environment concern is defined as inside feeling about environment impact and environment knowledge is defined as outside actual knowledge about whole environment system. So, in this thesis, we integrate inside feeling and outside knowledge into a concept called environment awareness.
15
z Outside Interference
According to the TRA proposed by Ajzen and Fishbein (1975), consumers` attitude and other people`s comment both affect consumers. And the affection comes from other people`s comment called “subjective norm” in TRA. Ajzen (1991) further proposed “perceived behavioral control” in the theory of planned behavior. Subjective norm and perceived behavioral control are both seldom used in previous research about green consumption but they are actually important factors. In this thesis, we integrate these two factors into “Outside Interference” and consider it as an influence factor.
3.1.2 Mediators
z Product-related information acquisition
The perceived information about product is an important determinant during consumer decision process. Many researchers studied in this field, some of them research product information (Chang et al. 1994; Russo et al. 1998; Meyvis et al. 2002) and some other of them research about advertisement (Resnik et al. 1977; Rajeev et al. 1986; Smith 1993). Product-related information acquisition means that consumers perceive those information of product and that can affect consumers` decision making.
Product-related information acquisition is seldom considered to build conceptual framework for green products. But the concept of product-related information acquisition is actually be used by consumers when they make their purchase decision. So we use product-related information acquisition to build up conceptual framework and consider it as an important construct.
z Consumer perceived value
In practice, enterprises regularly use price as main marketing tool. Although many researchers proposed different opinions of price, there is still consensus. Doubtless, price is a very important factor of purchasing decision.
In previous researches (Lichtenstein et al. 1988&1993; Huang et al. 2004), researchers used price-quality inference and price consciousness to describe price. Price-quality inference is a kind of beliefs, “high price, high quality” and “low price, low quality”. Monroe and Petroshius (1981) characterize a shopper as price conscious, “to the degree he/she is unwilling to pay a higher price for a
16
product,” and if the price is greater than what is acceptable to pay, the buyer may refrain from buying. Moreover, the price conscious shopper will not be willing to pay for distinguishing features of a product if the price difference for these features is too large. Monroe and Krishnan (1985) took price as a part of product attributes to stimulate consumption. Meyer (2001) pointed out price is the most important factor of cost, but product price is not just the money have to be paid. Peter and Olson (2001) proposed that consumers also take the time they spend, the effort they make and the value they can get as a part of product price.
According to above research, price is an important factor to influence purchasing decision. But consumers do not only consider the price but also the value they perceived. In this thesis, we depict price as consumer perceived value. It is more extensive than monetary cost. It includes price comparison, willingness to pay more and perceived worthiness.
z Consumer perceived risk
The concept of perceived risk was introduced by Bauer (1967) to the marketing field. Early work focused on the risk taking and information handling in consumer behavior, and there were several conceptual framework developed. Various conceptualizations of the perceived risk construct were proposed in recent two decades (Ivan 1975; Gemunden 1985; Ingene and Hughes 1985; Dowling 1986). The concept of perceived risk usually correlated to the consumers` perceptions of the uncertainty and adverse consequences of buying a product or service. Generally, consumer perceived risk comes from uncertainty.
In this thesis, we emphasize on the uncertainty of purchasing green products. Because most consumers are not familiar with green products, they would be more anxious about purchasing green products. Calfee and Ringold (1988) proposed consumers will naturally doubt about those environment information unless they have trustable basis of assessment. Brown et al. (1998) pointed out it is hard for consumers to believe environment information. Mostafa (2006) proposed that there is negative relationship between doubt of green products` environment information and green purchasing intention.
17
z Green Purchasing Attitude
The consumer purchasing attitude means that whether consumers like the products or not. Through experiencing or learning, when consumers continuously like the specific product, then we could say the consumer purchasing attitude of the specific product is positive. If consumers continuously dislike the specific product, then we could say the consumer purchasing attitude of the specific product is negative. So, green purchasing attitude is that if consumers like or dislike those green products.
3.1.3 Dependent construct
z Green Purchasing Intention
Green purchasing intention means consumers` willingness of purchasing green products. When consumers have strong willingness to purchase specific products that means the purchasing intention of the specific products is high. If consumers have less willingness to purchase specific products that means the purchasing intention of the specific products is low. And the higher purchasing intention also means more possibility of actual consumption.
Table 3.1 Decision Factors and Influence Factors
Independent constructs Mediators Dependent construct
Environment Awareness Outside Interference
Product-related information acquisition Green Purchase Attitude Consumer perceived value
Consumer perceived risk
Green Purchase Intention
3.2 Hypotheses
Many researchers proposed consumer perception of price, quality, and value are important determinants of shopping behavior and product choice (Bishop, 1984; Doyle, 1984; Sawyer and Dickson, 1984; Schlechter, 1984; Jacoby and Olson, 1985; Chapman et al., 1999). They are obvious and critical constructs to evaluate consumer behavior.
Lichtenstein et al. (1988) proposed that price consciousness is negatively related to products involvement. And Huang et al. (2004) proposed that price-quality inference is negatively related to consumers` attitude under purchasing gray market goods. In previous researches (Monroe, 1973; Chang et al., 1994; Bari et al., 1995;
18
Chen et al., 1998; Alford et al., 2002), they all explored the relationship between price and purchasing intention. Boris et al. (2004) develop a model of relationship with perceived value, perceived price, perceived quality and perceived risk. They tested the relationships with SEM (structural equation modeling), and they found that statistically significant relationships exist among these factors. We also assume higher price will trigger more willingness of involvement and when consumers feel more valuable then they will feel less risky too.
H1a: Consumer perceived value is positively related to product-related information acquisition.
H1b: Consumer perceived value is negatively related to Consumer perceived risk. H1c: Consumer perceived value is positively related to Green purchase attitude. H1d: Consumer perceived value is positively related to Green purchase intention.
Bauer (1967) pointed out that the different price brings the different risk. Generally, consumers will be more interested in the riskier products. They will spend more time searching information and understanding products. Therefore once consumers understand more about products, they will feel less risky. So we assume that higher product-related information acquisition would cause less consumer perceived risk.
And Brown et al. (1998) pointed out it is hard for consumers to believe environment information of green products. Once consumers can receive trustable information, they will be more positive toward green products. Thus we also assume that higher product-related information acquisition would cause more positive green purchase attitude.
H2a: Product-related information acquisition is negatively related to Consumer perceived risk.
H2b: Product-related information acquisition is positively related to Green purchase attitude.
19
Bauer (1967) proposed the concept of consumer perceived risk. Because uncertainty discomforts consumers and people tend to avoid loss, consumer perceived risk is an important construct. Roselius (1971) and Taylor (1974) proposed consumers often use strategy to reduce risk before they purchase. Verhagen et al. (2006) address the relationships between perceptions of trust and risk in intermediaries and sellers at an EM and consumers’ purchase attitude. Mitchell (1999) proposed that perceived risk would affect consumers` behavior. Because consumers usually rather avoid mistakes than maximize utility in purchasing. According to previous researches (Taylor, 1974; Dowling et al., 1994), Lim (2003) concluded that the more risk consumers perceive, the less likely they will purchase.
H3a: Consumer perceived risk is negatively related to Green purchase attitude. H3b: Consumer perceived risk is negatively related to Green purchase intention.
Many researchers proposed the relationship between environment concern and attitude or intention toward green consumption (Kinnear et al. 1974; Axelrod et al., 1993; Minton et al. 1997; Lee 1999; Chan 2001; Mostafa 2006). And several researchers proposed that environment knowledge is an important predictor of green consumption (Hines et al.1987; Rokicka, 2002; Mostafa, 2006). Ramsey and Rickson (1976) proposed the positive relationship between environmental knowledge and attitude. Laroche et al. (1996) studied the impact of the knowledge variable on the relationship between ecological attitude and behavior. Dispoto (1977), Synodinos (1990) and Schahn et al. (1990) concluded knowledge has strong influence on environmental behavior. But some researchers (Grunert and Kristensen 1992, Martin and Simintiras 1995) just take environmental knowledge as a moderating variable of the relationship between attitude and behavior.In this thesis, we further postulate that environment awareness is related to Product-related information acquisition, because consumers with more environment awareness usually have more interest of green products. And we assume that environment awareness can make consumers feel more value of green products and more interested in understanding green products.
H4a: Environment awareness is positively related to Consumer perceived value. H4b: Environment awareness is positively related to Products involvement.
20
H4c: Environment awareness is positively related to Green purchase attitude. H4d: Environment awareness is positively related to Green purchase intention.
Besides those constructs mentioned above, there are still some other factors influencing consumers. Based on the subjective norm derived from TRA (Ajzen and Fishbein, 1975) and perceived behavioral control derived from TPB (Ajzen, 1991), we integrate the reference group into a construct named outside interference. The more interference consumers face, the less they want to purchase green products. So we assume that outside interference is negatively related to green purchase intention. H5: Outside interference is negatively related to Green purchase intention.
Because our conceptual framework follows the concept of TRA and TPB, we will also examine the relationships between attitude and intention.
H6: Green purchase attitude is positively related to Green purchase intention.
21
3.3 Measurements
Our questionnaire uses Likert five-point scales. The choices are “agree”, “slightly agree”, “average”, “slightly disagree” and “disagree” separately. In our thesis, we choose one low-price product and one high-price product to be our objects, because we want to analyze how to apply our conceptual framework for each kind of green product. We consider recycled paper as low-price product and variable-frequency air conditioner (variable-frequency AC) as high-price product.
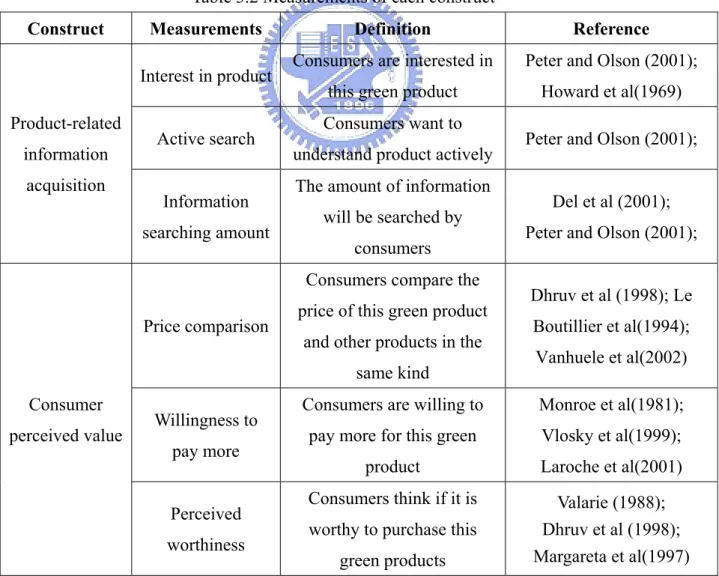
We conclude seven constructs and design two or three measurements to describe each construct for both products. We cite some measurements directly from previous researches and propose some measurements derived from the concepts of previous researches or theories. For example, the measurements of outside interference, green purchase attitude and green purchase intention are derived from the concept proposed by TRA and TPB. We define them in Table 3.2:
Table 3.2 Measurements of each construct
Construct Measurements Definition Reference
Product-related information
acquisition
Interest in product Consumers are interested in this green product
Peter and Olson (2001); Howard et al(1969)
Active search Consumers want to
understand product actively Peter and Olson (2001); Information
searching amount
The amount of information will be searched by
consumers
Del et al (2001); Peter and Olson (2001);
Consumer perceived value
Price comparison
Consumers compare the price of this green product
and other products in the same kind Dhruv et al (1998); Le Boutillier et al(1994); Vanhuele et al(2002) Willingness to pay more
Consumers are willing to pay more for this green
product Monroe et al(1981); Vlosky et al(1999); Laroche et al(2001) Perceived worthiness Consumers think if it is worthy to purchase this
green products
Valarie (1988); Dhruv et al (1998); Margareta et al(1997)
22
Table 3.2 Measurements of each construct (continued)
Construct Measurements Definition Reference
Consumer perceived value
Perceived worthiness
Consumers think if it is worthy to purchase this
green products Valarie (1988); Dhruv et al (1998); Margareta et al(1997) Environment awareness Environment concern degree
The degree of consumers` concern about the environmental issues
Mostafa (2006); Minton et al. (1997);
Chan (2000)
Personal behavior Consumers act for
environment protection
Schwartz et al. (1991); Stern(1999) Effect other
people
Consumes effect other people for environment
protection Schwartz et al.(1991); Stern(1999) Actual environment knowledge Consumers` factual knowledge about environment issues
Chan (2000); Hines et al. (1987); Rokicka (2002); Mostafa (2006); Consumer perceived risk Perceived information risk
Consumers` worry about the truthfulness of information
delivered by products or commercials
Howard et al(1969); Peter and Olson (2001);
Lim(2003)
Perceived performance risk
Consumers` worry about the lower product attributes of
green products
Peter and Olson (2001);
Lim(2003);
Perceived effectiveness
Consumers perceive the effectiveness of purchasing
green product for environment protection.
Scholder et al. (1991); Berger et al. (1992);
Del et al. (2001); Peter and Olson (2001) Outside
interference
Purchase experience
consulting
The effect of purchasing caused by previous purchasing experience
Ajzen(1991) Fishbein and Ajzen (1975)
23
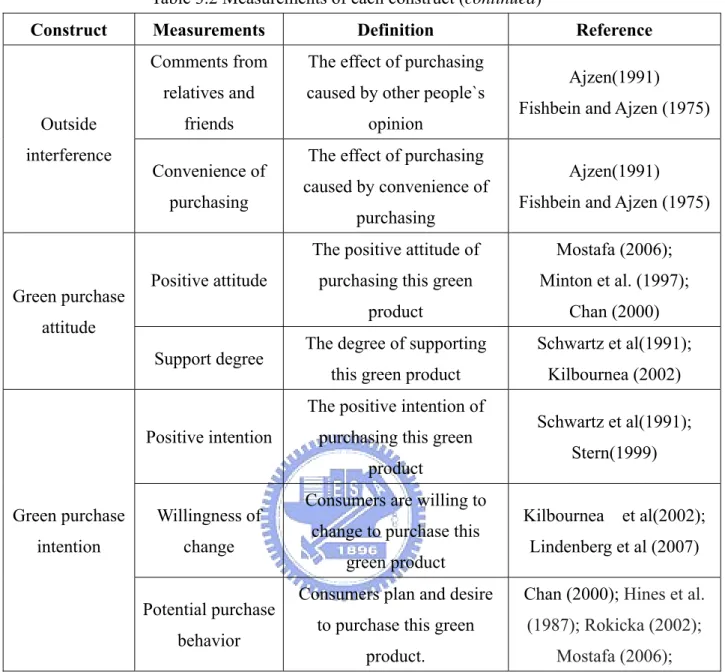
Table 3.2 Measurements of each construct (continued)
Construct Measurements Definition Reference
Outside interference
Comments from relatives and
friends
The effect of purchasing caused by other people`s
opinion
Ajzen(1991) Fishbein and Ajzen (1975) Convenience of
purchasing
The effect of purchasing caused by convenience of
purchasing
Ajzen(1991) Fishbein and Ajzen (1975)
Green purchase attitude
Positive attitude
The positive attitude of purchasing this green
product
Mostafa (2006); Minton et al. (1997);
Chan (2000) Support degree The degree of supporting
this green product
Schwartz et al(1991); Kilbournea (2002)
Green purchase intention
Positive intention
The positive intention of purchasing this green
product
Schwartz et al(1991); Stern(1999) Willingness of
change
Consumers are willing to change to purchase this
green product
Kilbournea et al(2002); Lindenberg et al (2007) Potential purchase
behavior
Consumers plan and desire to purchase this green
product.
Chan (2000); Hines et al. (1987); Rokicka (2002);
24
Chapter 4 Methodology
4.1 Descriptive Statistics
We use descriptive statistics to explain the structure of sample data and show the distribution of our sample.
4.2 Reliability
Reliability means the trustworthiness of measurement, like accuracy or precision. It also represents the stability or consistency of result. Reliability is depended on error of measurement. It reflects the degree of trustworthiness of measuring tools or procedures.
There are three kinds of reliability: equivalence, stability, and consistency. Equivalence divides into alternate forms and split-half. Stability concludes test-retest. And consistency divides into split-half, Kuder-Richarson and Cronbach`s α. They are suitable for different proposes and situations. In this thesis, we use Cronbach`s α value to test the consistency of measurements of each factor. Because Cronbach`s α value is most suitable for testing reliability under Likert scale.
Cronbach`sαis proposed by Cronbach(1951). Cronbach proposed a principle to determine reliability. α<0.35 represents low reliability, 0.35<α<0.70 represents middle reliability andα>0.70 represents high reliability. In practice, as long asα >0.60, we can claim reliability is acceptable.
N
= the number of components (items) = the variance of the observed total test = the variance of component i
25
4.3 Validity
Validity is a scale to examine the degree of measurement. In this thesis, we use content validity and construct validity to measure effectiveness of model.
z Content validity
Content validity means the degree of subject covered by measurement tools. It is used to check whether the degree or scope of measurement can really represent original content or meaning or not. It involves a subjective judgments that if measurement has enough validity. The key factor of content validity is the procedure followed when we develop measurement.
z Construct validity
Construct validity means that if construct can reflect actual situation. Construct validity divides into convergent validity and discriminate validity. Convergent validity means those items come from the same construct should be highly related to each other. Discriminate validity means those items come from the same construct should be lowly related to each other.
In this thesis, we will do t-test for factor loading of every indicator variable after finishing confirmatory equation analysis. If the t value of factor loading comes from every indicator variable and its construct is higher than 1.645, it means that every measured variables can effectively measure the common construct.
About testing discriminate validity, we take variance extracted estimate as indicator. Usually, variance extracted estimate of measurement construct should be higher than 0.5 to fit in with the standard proposed by Fornell and Larcker (1981).
4.4 Structural Equation Modeling (SEM)
Structural equation modeling is usually categorized as advanced statistics. It belongs to a part of multivariate statistics and integrates factor analysis and path analysis. SEM concludes the relationships between manifest variables, latent variables, error variables and further obtains direct effects, indirect effects and total effects caused from independence variables to dependence variables.
A whole SEM has two basic models. One is measurement model and another is structural model. Measurement model is consisted of latent variables and observed variables. It reflects the relationships between observed variables and latent variables.
26
And structural model explains the relationships between latent variables. And we can these two parts in figure 3.2 to accomplish a whole SEM.
Environment awareness Outside interference Product-related information acquisition Consumer perceived risk Consumer perceived value Green Purchase attitude Green Purchase intention Y1 Y2 X4 X3 X2 X1 Y13 Y12 Y14 Y10 Y9 Y8 Y7 Y6 Y5 Y4 Y3 X5 X6 Y11 δ1 δ3 δ2 δ6 δ5 δ4 ε1 ε14 ε13 ε12 ε11 ε10 ε9 ε8 ε7 ε6 ε5 ε4 ε3 ε2
27
4.5 Goodness-of-Fit index of model
After calculating every parameter in hypothetic model, we can evaluate the fitness between hypothetical model and practical data through different statistics procedure and goodness-of-fit index. Jöreskog & Sörbom (1993) pointed out that concept of measurement model concludes measurement, reliability and validity. So, the complete analysis of structural model consist of (1)calculation of factor loading of each variable, (2)testing the fitness between data and measurement model of each factor, (3)calculation of the relationship between each latent variable, and (4) testing the fitness between whole model and data.
There are eight common indexes used to test the fitness of causal models.
z test
z / df
z Root mean square error of approximation; RMSEA z Comparative-fit index; CFI
z Goodness-of-fit index; GFI
z Adjusted goodness-of-fit index; AGFI z Normed fit index; NFI
z Non-normed fit index; NNFI
Table 4.1 Goodness-of-Fit index of model
Index Threshold value
test The smaller; the better
/ df <2 is perfect, <5 is acceptable
RMSEA <0.05 is perfect, <0.08 is good, <1 is acceptable
CFI >0.9 GFI >0.9 AGFI >0.9
NFI >0.9 NNFI >0.9
28
Chapter 5 Analysis of results
5.1 Sample analysis
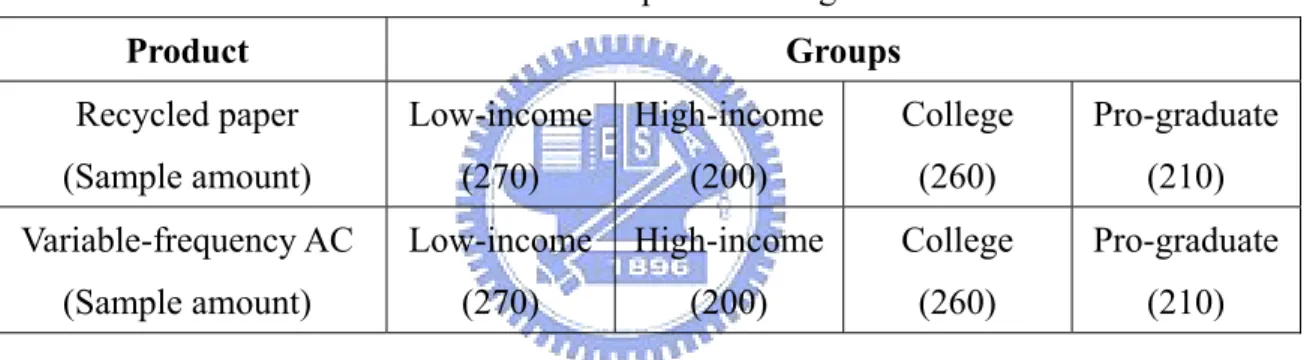
We retrieved 520 questionnaires, except unavailable questionnaires, there are still 470 questionnaires. We investigate the socioeconomic variables of participants, like sex, age, education level and income level. Because we are going to test two kinds of green products, there is one part for each product in our questionnaire. Participants have to fill both parts in the same time, and that means we have the data of both products from the same people. The structure of sample integrates in the following table:
Table 5.1 Sample structure
Amount Percentage Sex Male 238 50.6% Female 232 49.4% Total 470 100% Education level
Senior high school (and below) 42 8.9%
College 218 46.4%
Master (and above) 210 44.7%
Total 470 100% Age 18~24 156 33.2% 25~30 125 26.6% 30~40 62 13.2% 40~50 60 12.8% Above 50 67 14.2% Total 470 100% Income level (NT dollar/per year) Under 100,000 155 32.9% 100,000~300,000 115 24.5% 300,000~500,000 98 20.9% 500,000~1,000,000 62 13.2% Above 1,000,000 40 8.5% Total 470 100%
29
5.2 Reliability and validity analysis
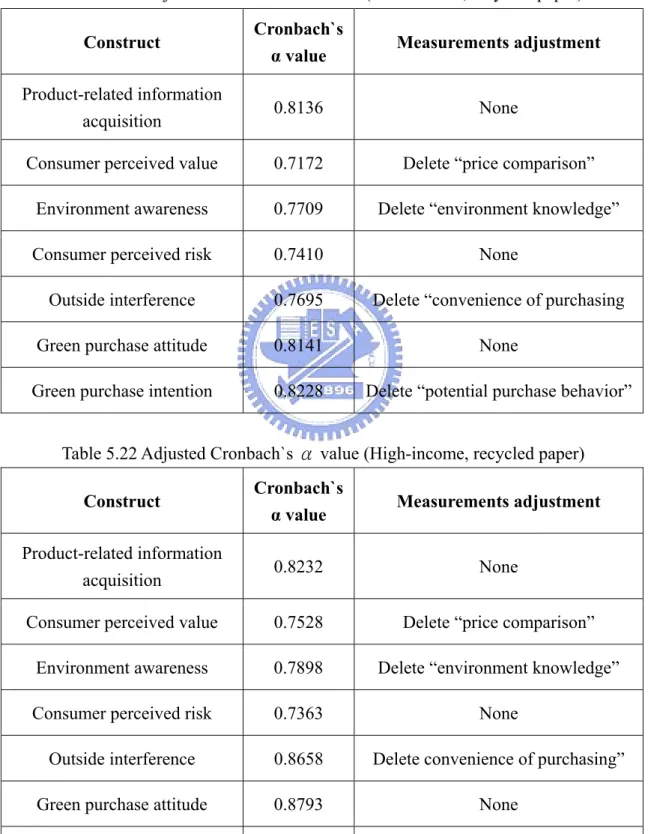
Before we use LISREL to validate out hypotheses, we have to validate the reliability of samples firstly. If the reliability of construct is high, it means these measurements under that construct are consistent to describe construct. If the reliability of construct is low, it means these measurements under that construct are not consistent to describe construct, then we have to delete one or some measurements to increase reliability to maintain the consistency. According to the standard proposed by Cronbach(1951), Cronbach`s α value should be higher than 0.7. After we adjust measurements with Cronbach`s α value, we will further calculate factor loading of each measurement. We delete those measurements with factor loadings under 0.5.
Table 5.2 Adjusted Cronbach`s α value (Recycled paper)
Measurement Delete Cronbach`s α value
Consumer perceived value price comparison 0.7151
Consumer perceived risk X 0.6960
Product-related information acquisition X 0.8333
Outside interference convenience of purchasing 0.8186
Environment awareness environment knowledge 0.7491
Green purchase attitude X 0.8587
Green purchase intention X 0.7205
Table 5.3 Adjusted Cronbach`s α value (Variable-frequency AC)
Measurement Delete Cronbach`s α value
Consumer perceived value price comparison 0.7475
Consumer perceived risk X 0.7514
Product-related information acquisition X 0.8531
Outside interference X 0.7499
Environment awareness environment knowledge 0.7491
Green purchase attitude X 0.8374
30
Table 5.4 Adjustment with factor loading
Product Delete
Recycled paper Potential purchase behavior (0.41)
Variable-frequency AC Convenience of purchasing (0.47)
Potential purchase behavior (0.43)
5.3 Structural Model
5.3.1 Structural model of recycled paper
Environment awareness Outside interference Consumer perceived risk Consumer perceived value Green Purchase attitude Green Purchase intention I 0.58 0.62 0.68 0.69 0.86 0.90 0.64 0.92 0.76 0.74 0.87 0.04 (0.69) 0.27 (3.76) 0.50 (6.98 ) 0.86 0.66 0.83 0.91 0.82 0.91 0.01 (0 .21) -0.24 (-4.87) 0.73 (11.10) 0.18 (3.18) -0.36 (-4.08) -0.36 (-4.83) AS PEC EOP PB ECD WPM PW WC PI SD PA PE PPR PIR ISA CRF -0.07 (1.03) 0.25 (3.43) -0.35 (-4.38) 0.03 (0.55) 0.12 (1.56) Product-related information acquisition
Note :I=interest in product; AS=active search; ISA=information searching amount; PIR=perceived information risk; PPR=perceived performance risk; PE=perceived effectiveness; PA=positive attitude; SD=support degree; PI=positive intention; WC=willingness to change; WPM= willingness to pay more; PW=perceived worthiness; ECD=environment concern degree; PB=personal behavior; EOP=effect other people; PEC=purchase experience consulting; CRF=comment from relatives and friend.
31
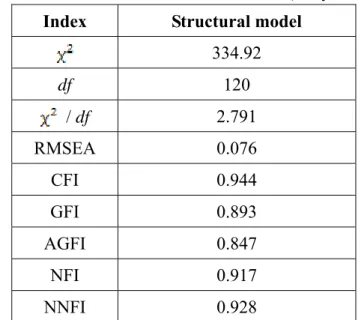
Table 5.5 Goodness-of-fit of structural model (Recycled paper)
Index Structural model
334.92 df 120 / df 2.791 RMSEA 0.076 CFI 0.944 GFI 0.893 AGFI 0.847 NFI 0.917 NNFI 0.928
We can see most indexes of this structural model is acceptable, even perfect, so we can claim this structural model have great goodness-of-fit.
Table 5.6 Test results of the hypotheses (Recycled paper)
Hypotheses t-value Test results
Environment awareness → Consumer perceived value 0.21 Rejected
Environment awareness → Product-related information acquisition 6.98*** Accepted
Environment awareness → Green purchase attitude 3.76*** Accepted
Environment awareness → Green purchase intention 0.69 Rejected
Outside interference → Green purchase intention -4.87*** Accepted
Product-related information acquisition → Consumer perceived risk -4.83*** Accepted Product-related information acquisition → Green purchase attitude 1.54 Rejected Consumer perceived value → Product-related information acquisition 0.55 Rejected
Consumer perceived value → Consumer perceived risk -4.38*** Accepted
Consumer perceived value → Green purchase attitude 3.43*** Accepted
Consumer perceived value → Green purchase intention 3.18*** Accepted
Consumer perceived risk → Green purchase attitude -4.08*** Accepted
Consumer perceived risk → Green purchase intention -1.03 Rejected
Green purchase attitude → Green purchase intention 11.13*** Accepted
32
Table 5.7 Effects on latent variable (Recycled paper)
Affected latent variable: Product-related information acquisition
Indirect effects Direct effects Total effects
Environment awareness X 0.50 0.50
Affected latent variable: Consumer perceived risk
Indirect effects Direct effects Total effects
Environment awareness -0.18 X
-0.89 Product-related
information acquisition X -0.36
Consumer perceived value X -0.35
Affected latent variable: Green purchase attitude
Indirect effects Direct effects Total effects
Environment awareness 0.06 0.27
0.47 Product-related
information acquisition 0.13 X
Consumer perceived risk X -0.36
Consumer perceived value 0.13 0.25
Affected latent variable: Green purchase intention
Indirect effects Direct effects Total effects
Environment awareness 0.24 X
1.01 Product-related
information acquisition 0.09 X
Consumer perceived risk -0.26 X
Consumer perceived value 0.27 0.18
Outside interference X -0.24
33
5.3.2 Structural model of Variable-frequency AC
Environment awareness Outside interference Consumer perceived risk Consumer perceived value Green Purchase attitude Green Purchase intention I 0.58 0.58 0.77 0.78 0.93 0.92 0.62 0.82 0.86 0.72 0.89 0.06 (1.45) 0.19 (4.21) 0.32 (5.78 ) 0.97 0.56 0.77 0.86 0.83 0.87 0.03 (0 .60) -0.27 (-7.41) 0.79 (13.12) 0.08 (2.60) -0.15 (-2.33) -0.68 (-10.40) AS PEC EOP PB ECD WPM PW WC PI SD PA PE PPR PIR ISA CRF -0.18 (3.54) 0.14 (3.61) -0.19 (-4.56) 0.10 (2.32) 0.55 (7.67) Product-related information acquisition
Note :I=interest in product; AS=active search; ISA=information searching amount; PIR=perceived information risk; PPR=perceived performance risk; PE=perceived effectiveness; PA=positive attitude; SD=support degree; PI=positive intention; WC=willingness to change; WPM= willingness to pay more; PW=perceived worthiness; ECD=environment concern degree; PB=personal behavior; EOP=effect other people; PEC=purchase experience consulting; CRF=comment from relatives and friend.
34
Table 5.8 Goodness-of-fit of structural model (Variable-frequency AC)
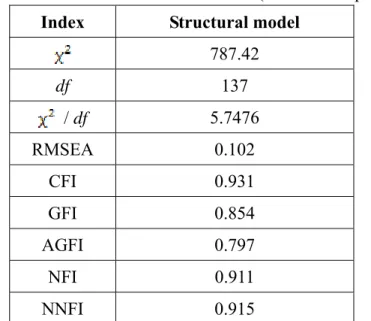
Index Structural model
787.42 df 137 / df 5.7476 RMSEA 0.102 CFI 0.931 GFI 0.854 AGFI 0.797 NFI 0.911 NNFI 0.915
We can see most indexes of this structural model is acceptable, even perfect, so we can claim this structural model have great goodness-of-fit.
Table 5.9 Test results of the hypotheses (Variable-frequency AC)
Hypotheses t-value Test results
Environment awareness → Consumer perceived value 0.60 Rejected
Environment awareness → Product-related information acquisition 5.78*** Accepted
Environment awareness → Green purchase attitude 4.21*** Accepted
Environment awareness → Green purchase intention 1.45 Rejected
Outside interference → Green purchase intention -7.41*** Accepted
Product-related information acquisition → Consumer perceived risk -10.40*** Accepted Product-related information acquisition → Green purchase attitude 7.67*** Accepted Consumer perceived value → Product-related information acquisition 2.32** Accepted
Consumer perceived value → Consumer perceived risk -4.56*** Accepted
Consumer perceived value → Green purchase attitude 3.61*** Accepted
Consumer perceived value → Green purchase intention 2.60*** Accepted
Consumer perceived risk → Green purchase attitude -2.33** Accepted
Consumer perceived risk → Green purchase intention -3.54*** Accepted
Green purchase attitude → Green purchase intention 13.12*** Accepted
35
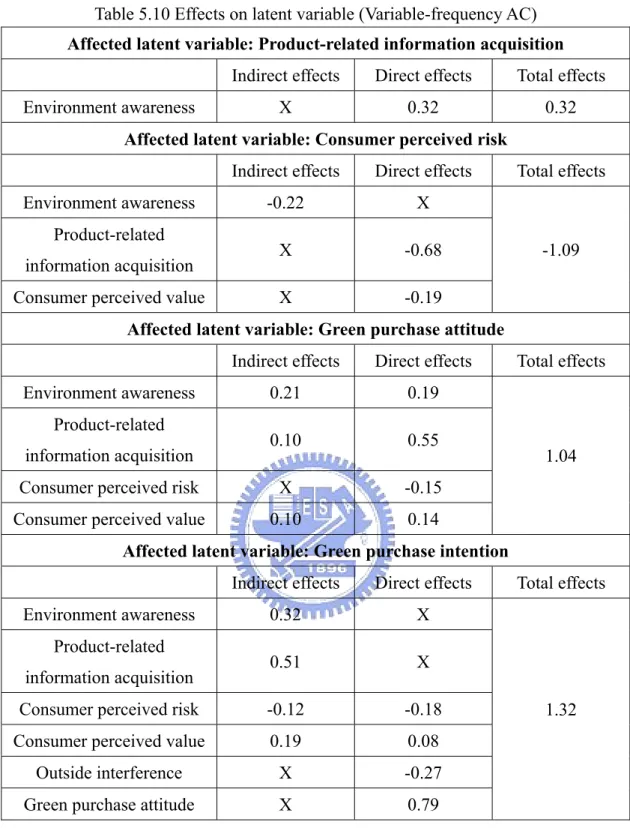
Table 5.10 Effects on latent variable (Variable-frequency AC)
Affected latent variable: Product-related information acquisition
Indirect effects Direct effects Total effects
Environment awareness X 0.32 0.32
Affected latent variable: Consumer perceived risk
Indirect effects Direct effects Total effects
Environment awareness -0.22 X
-1.09 Product-related
information acquisition X -0.68
Consumer perceived value X -0.19
Affected latent variable: Green purchase attitude
Indirect effects Direct effects Total effects
Environment awareness 0.21 0.19
1.04 Product-related
information acquisition 0.10 0.55
Consumer perceived risk X -0.15
Consumer perceived value 0.10 0.14
Affected latent variable: Green purchase intention
Indirect effects Direct effects Total effects
Environment awareness 0.32 X
1.32 Product-related
information acquisition 0.51 X
Consumer perceived risk -0.12 -0.18
Consumer perceived value 0.19 0.08
Outside interference X -0.27