國
立
交
通
大
學
財務金融研究所
碩
士
論
文
產業競爭度、代理問題與公司績效:以美國、英國、
德國與法國為研究樣本
Industry Competition, Agency Problem, and Firm Performance:
Evidence from the USA, UK, Germany, and France
研 究 生: 吳堃瑋
指導教授: 王淑芬 博士
周幼珍 博士
產業競爭度、代理問題與公司績效:以美國、英國、德國與法國
為研究樣本
Industry Competition, Agency Problem, and Firm Performance:
Evidence from the USA, UK, Germany, and France
研 究 生:吳堃瑋 Student : Kun-Wei Wu 指導教授:王淑芬 博士 Advisor : Dr. Sue-Fung Wang 周幼珍 博士 Dr. Yow-Jen Jou
國 立 交 通 大 學
財務金融研究所
碩 士 論 文
A ThesisSubmitted to Graduate Institute of Finance College of Management
National Chiao Tung University in partial Fulfillment of the Requirements
for the Degree of Master in Finance
June 2011
Hsinchu, Taiwan, Republic of China
中華民國一百年六月
產業競爭度、代理問題與公司績效:以美國、英國、德國與法國為研究樣
本
研 究 生:吳堃瑋
指導教授: 王淑芬 博士
周幼珍 博士
國立交通大學財務金融研究所碩士班
摘要
產業競爭度與公司績效的關係在過去的文獻並沒有獲得一致的結論。在極大化股東 財富的目標下,代理問題在財務文獻上一直被視為是一項重要的影響因子。有鑑於此, 本研究考量代理問題的條件下,檢視產業競爭度與公司績效的關係。同時文獻上也指 出國家公司治理程度的不同對公司績效的影響也有所不同,因此本研究選擇四大經濟 市場--美國、英國、德國與法國,分別檢視在不同程度的代理問題下,產業競爭度與 公司績效的關係是否有所不同。結果發現當企業擁有較多自由現金流量,也就是代理 問題愈大的情況下,產業競爭度與公司績效呈現相對顯著的正向關係,同時也發現此 結果也不因國家公司治理程度不同而有所改變。 關鍵字:產業競爭、自由現金流量、公司績效、公司治理Industry Competition, Agency Problem, and Firm Performance: Evidence
from the USA, UK, Germany, and France
Student:Kun-Wei Wu Advisor : Dr. Sue-Fung Wang
Dr. Yow-Jen Jou
Graduate Institute of Finance
National Chiao Tung University
ABSTRACT
Studies on the relationship between industry competition and firm performance have yet to attain a unanimous conclusion. On the goal of maximizing shareholders’ wealth, the financial literature determines agency problem as an important factor affecting firms. Accordingly, the present study investigates the relationship between industry competition and firm performance in relation to agency problem conditions. At the same time, the literature also stated that the different levels of national corporate governance have different impacts on corporate performance. To confirm this finding, our study focuses on the top four economic markets, including the US, the UK, Germany, and France. We also investigate whether or not the relation between industry competition and firm performance would be different under the different levels of agency problem. Our empirical results show that the positive relation between industry competition and firm performance is relatively significant for firms with higher free cash flows that represent severe agency problems. The results do not change under different levels of national corporate governance.
Keywords: Industry competition, Free cash flows, Firm performance, Country-level governance
誌謝
首先謝謝王淑芬老師無微不至地耐心指導、耳提面命地細心糾正,終使本論文得以 付梓,能夠跟在王淑芬老師下面做事,是學生堃瑋今生最榮幸的一件事,老師教導了 我很多東西,不管是論文專業方面還是待人處事方面,皆使學生受益匪淺、終生受用, 學生一點一滴都感滴在心,無時無刻不望能湧泉以報。老師為人落落大方、不拘小節 卻又心思細膩、溫暖親切,照顧我們、指點我們,像是燈塔一樣指導我們的方向,又 像媽媽一般照顧我們的生活,謝謝老師願意收我到門下做指導學生,學生堃瑋一輩子 都不會忘記老師。 另外亦感謝周幼珍老師不辭辛勞地解決學生有關於研究方法方面的疑惑,也感謝口 試委員余海琴、杜玉振、王衍智老師於口試時不吝指正,提供學生諸多寶貴意見,使 本篇論文得以更加完善,在此亦表示深深的謝意。 此外,感謝陪伴在我身邊的每一位好朋友與好同學,盟翔、慶華、昆鋒、家源、大 衛、浩旭、俊明、珮琪、馨儀、郁婷、英茵..等族繁不及備載,給我關懷、陪我歡樂、 為我解憂,讓我在交大的生活多采又多姿,幫助多愁善感、總是愛胡思亂想的堃瑋, 能夠平平安安的存活到現在,還沒有走火入魔去住精神病院,希望我的好朋友們未來 都能夠事事皆順心、工作賺大金。 最後,感謝我最愛的家人:爸爸、媽媽、妹妹和弟弟,每當我回到家中,最想見到 就是你們,你們親切的笑容讓我每次都可以重新充電再出發,無怨無悔地支持我、關 心我,讓我永遠都不覺得寂寞,謝謝你們,我最愛的家人! 吳堃瑋謹誌 國立交通大學財務金融所碩士班 中華民國一百年六月List of Contents
摘要 ... i ABSTRACT ... ii 誌謝 ... iii List of Contents ... iv List of Tables ... v 1. Introduction ... 12. Definition of Variables and Sample Selection ... 4
2.1. Definition of Variables ... 4
2.1.1. Firm performance ... 4
2.1.2. Industry competition ... 5
2.1.3. Free cash flows ... 6
2.1.4. Country-level governance... 7
2.1.5. Control variables ... 7
2.2. Sample Selection and Descriptive Statistics ... 8
3. Methodology and Hypothesis ... 12
4. Empirical Results ... 14
4.1. Bivariate Analysis ... 14
4.2. Regression Analysis ... 17
4.2.1. The effect of industry competition on firm performance ... 17
4.2.2. The effect of potential FCF problems on the relation between industry competition and firm performance ... 18
4.2.3. The effect of industry competition on firm performance in different countries ... 21
4.2.4. The effect of potential free cash flow problems on the relation between industry competition and firm performance for different countries ... 22
5. Conclusion ... 25
List of Tables
Table 1 Definitions of variables ... 8
Table 2 Descriptive statistics ... 11
Table 3 Two Sample t-test of Tobin's Q ... 16
Table 4 Regression results for the whole sample ... 20
Table 5 Regression results by country ... 22
1. Introduction
The degree of industry competition influences a firm’s performance. According to Nickell (1996), most people believe that competition is a good thing. However, theory and empirical evidence are not conclusive about the relationship between firm performance and product market competition.
Many studies have investigated the effects of industry competition and corporate governance on firm performance; however, the theoretical predictions are ambiguous, and there are divergent views on competition. Some papers show that firm performance and industry competition are negatively related (Hill and Hansen, 1991; Schmidt, 1997; Ghosal, 2002; Slade, 2004; Peress, 2010; Stefan, Markus, and Gabrielle, 2011). Previous studies show that lack of competition induces higher returns because of the power of monopoly; in addition, firms in such concentrated industries have better methods of enforcing discipline on each other, and as such, monopoly firms are less likely to suffer profit losses in periods when demand is falling because they could pass them on to their customers (Hill and Hansen, 1991; Ghosal, 2002; Slade, 2004; Peress, 2010). Schmidt (1997) indicates that increasing competition lowers each firm’s profits; thus the owner of the firm may not be interested in paying the manager the high rent necessary to achieve cost reduction although this reduces the manager’s incentives for the latter to exert effort. In the same vein, Stefan, Markus, and Gabrielle (2009) propose that the relation between product market competition and managerial incentive is convex. Thus, above a certain level of intensity in product market competition, the negative effect of lower economic rents seems to outweigh the positive effect of reducing managerial slack resulting from additional monitoring and the threat of liquidation.
Although imperfect convergence exists in theoretical studies, most of the empirical evidence suggest a positive impact of industry competition on firm performance (Nickell,
1996; Nickel et al., 1997; Jagannathan and Srinivasan, 1999; Griffith, 2001; Januszewski et al., 2002; Mitton, 2004; Bozec, 2005; Gaspar and Massa, 2005; Irvine and Pontiff, 2005; Hou and Robinson, 2006; Baggs and Bettignies, 2007; Grullon and Michaelly, 2007; Karuna, 2007; Bartram et al., 2008; Stefan et al., 2009; Giroud and Mueller, 2010). According to these studies, competition can produce better managerial incentives and monitoring quality. Therefore, it could alleviate management inefficiency and improve company performance. In a highly competitive environment, the space of profit may be compressed or plundered by other companies in the same industry and only efficient companies can survive. Managers must focus on increasing product quality or reducing costs of production in order to avoid bankruptcy or lose their jobs (Griffith, 2001; Bozec, 2005; Baggs and Bettignies, 2007; Giroud and Mueller, 2010). Meanwhile, other studies show that firms in highly competitive industries are easily influenced by aggregate shocks because each firm has less power to dominate the market. This, in turn, increases the probability of bankruptcy, providing incentives for managers to avoid this outcome through hard work and less free cash flow (FCF) waste; thus, product market competition can reduce FCF problems resulting from conflict of interest between shareholders and managers (Nickell, 1996; Nickel et al., 1997; Jagannathan and Srinivasan, 1999; Januszewski et al., 2002; Karuna, 2007). Such firms in competitive industries are also more likely to distribute cash to shareholders (Mitton, 2004; Grullon and Michaelly, 2007; Bartram et al., 2008).
There are three possible reasons for them to do distribute cash to shareholders. First, a highly competitive industry overinvesting in projects of negative net present value can make the firm less competitive and more likely to be driven out of the market. Second, intense competition makes it easier for outside investors to benchmark managers’ performance to the performance of their competitors. This increases the risk of making investors discover overinvesting moves, improves monitoring quality, and reduces agency problems between the shareholders and the manager. Third, trying to avoid bankruptcy and the loss of their
jobs, managers in more competitive industries tend to avoid overinvesting and distribute excess cash to shareholders as dividends. In the secondary market, these companies in highly competitive industries have higher average of stock returns not only on account of their risk due to the influence of aggregate shock, but also because these firms have a certain efficiency, lower price distortions, greater accountability, and transparency in business decisions (Gaspar and Massa, 2005; Irvine and Pontiff, 2005; Hou and Robinson, 2006).
Due to the growing interest in corporate governance, the link between agency issues and competition situation has attracted an increasing amount of attention. Agency conflicts strongly impact on managerial decision making (Januszewski et al. 2002; Rogers 2004). In an effort to find out the common rule in the relationship between industry competition and firm performance, we added one factor into consideration when investigating the topic: agency problem. Managerial slack is a source of agency problems; it breeds inefficiency, inhibits risk taking, and hurts performance (Jensen and Meckling, 1976; Jensen, 1986; Fama, 1980; Brush, Bromiley and Hendrickx, 2000). Agency problems also exist when firms have substantial free cash flows (Jensen, 1986; Chi and Lee, 2005). Since the product market competition is an effective instrument for solving agency problems and improving corporate governance (Fama 1980; Giroud and Mueller 2010), we expect a stronger positive correlation between industry competition levels and operating performance among firms with severe agency costs of free cash flows. Our empirical results prove our expectation that the positive relation between product competition and firm performance is more profound for firms with higher free cash flow, thus presenting a severe agency problem.
Different countries have different objectives in their corporation and ranking in their corporate governance (Allen and Gale, 2000; Gompers, Ishii and Meyrick, 2003). Particularly, poor shareholder protection is penalized with lower valuation (La Porta et al., 2002; Chua, Eun et al., 2007; Gompers, Ishii and Meyrick, 2003). In the USA and the UK,
the threat of takeover ensures that managers act in line with the shareholders' interests. In Germany and France, the system of co-determination on the supervisory board formalizes this balance of interests, and both the shareholders and the employees emphasize their mission of protecting stakeholders (Allen and Gale, 2000). Aside from the firm’s mission to shareholders’ rights, different legal protections for outside investors tend to provide much higher levels of protection than civil law countries such as Germany and France, although these matter in the firm performance in different countries with common laws, such as the USA and the UK (La Porta et al. 1998). In our paper, we used four country samples, including the USA, UK, Germany, and France. Our aim is to examine whether different company missions and legal protection affect the relationship between competition and performance. Another consideration is that few studies have examined the relationship between competition and performance in different countries.
Our study focuses on the relationship between industry competition and firm performance while considering agency problem conditions. In the sample selection, we used the top four economic markets, including the USA, UK, Germany and France, to help us to investigate the relation between industry competition and firm performance under different levels of national corporate governance.
The rest of this paper is organized into sections. Section 2 describes the definitions of variables, sample selection, and descriptive statistics; Section 3 discusses our research design and hypotheses; Section 4 presents the results; and Section 5 provides a summary of our main results and the conclusion.
2. Definition of Variables and Sample Selection
2.1. Definition of Variables
2.1.1. Firm performance
the market value of equity plus the book value of debt to the book value of the total assets. Given that Tobin’s Q is a ratio, it can take on extreme values (in either direction) if the scaling variable becomes too small. To mitigate the effect of outliers, we dropped the firm-year observations at each tail of the Tobin’s Q distribution in each country by 1%.
Tobin’s Q is a widely used proxy for operating performance in studies of corporate governance. For example, Gompers, Ishii, and Metrick (2003) conclude that firms with more shareholder rights are better governed since they have a higher Tobin’s Q. Yermack (1996) also analyzes board performance using Tobin’s Q, while Anderson and Reeb (2003) employ Tobin’s Q to examine the governance of family firms. Klapper (2004) and Wright, Kroll, Mukherji, and Pettus (2009) also use Tobin’s Q as measures for market-based firm performance.
2.1.2. Industry competition
In our study, we used four variables to stand for industry competition. These variables include Herfindahl–Hirschman index (HHI), product substitutability, market size, and entry costs.
Following recent studies (Aggarwal and Samwick, 1999; Allayannis and Ihrig, 2001; Campello, 2005; MacKay and Phillips, 2005; and Haushalter, Klasa and Maxwell, 2006; Hou and Robinson, 2006; Grullon and Michaely, 2007), we used the HHI as a proxy for industry competition. HHI is well-grounded on industrial organizational theory and actually measures the industry concentration; a high HHI indicates more concentration and less competition in the industry. The HHI is defined as the sum of squared market shares, , where is the market share of firm i in industry j in year t. Market
shares are computed from Compustat based on three-digit SIC codes. The three-digit partition is a compromise between a too wide partition, in which unrelated industries may be pooled together, and a too narrow partition, which may be subject to misclassification. In
some cases, the industry classification is rather narrow, such that some industries consist of only a single firm, even though common sense suggests that they should be pooled together with other industries. These industries have an HHI of 1 which explains the small “spike” at the right endpoint of the empirical HHI distribution. Therefore, we dropped the firm-year observations at the right tail of the distribution by2.5% to correct this misclassification.
Prior studies have mainly used the level of concentration measures, such as the HHI as the only measure of competition. However, recent studies in economics suggest that competition comprise several dimensions, including product substitutability, market size, and entry costs (Raith, 2003; Karuna, 2007). Hence, we considered these dimensions and provided the relation between competition and performance based on these three dimensions of competition, given that greater product substitutability, greater market size, and lower entry costs reflect greater price competition. The extent of product substitutability in industry (ENCOST) is equal to sales divided by operating costs for each industrial segment. Operating costs include cost of goods sold, selling, general and administrative expenses, depreciation, depletion, and amortization. The level of market size in industry (MKTSIZE) is measured by natural log of industry sales. For the measurement constructed from Compustat data, industry sales were computed as the sum of segment sales for firms operating in the industry. The level of entry costs (ENTCOST) in the industry is equal to the natural log of weighted average of gross value of property cost, plant, and equipment for firms in the industry, weighted by each firm’s market share in that industry.
2.1.3. Free cash flows
To use a reliable variable to proxy agency problem, we followed the previous studies and chose free cash flows(Jensen, 1986; Chi and Lee, 2005; Grullon and Michaelly, 2007). We assumed that agency problems would exist when firms have substantial free cash flows (Jensen, 1986; Chi and Lee, 2005).
expenditures, scaled by total assets. This calculation was done to prove our expectation that the positive relation between industry competition and firm performance was more profound for firms with higher free cash flow (FCF), thus representing a severe agency problem. We placed all firms into two groups based on the present year’s FCF. If a firm’s FCF is below the median FCF of that year in its country, the firm is designated as part of the low FCF group, We assumed the low FCF group has better corporate governance and are less likely to have agency problems; otherwise, if a firm’s FCF is beyond the median FCF of that year in its country, the firm is designated as part of the high FCF group. We assumed that the high FCF group has poor corporate governance and higher probability of facing an agency problem.
2.1.4. Country-level governance
Country-level governance data, such as shareholder rights, and legal protection are from the IMD World Competitiveness Online, which provides a worldwide reference point on the competitiveness of nations, rankings, and analyses on how an economy creates and sustains the competitiveness of enterprises. The shareholder’s right index is scored from 0 (lowest) to 10 (highest). The one with the higher index has better legal protection, which refers to the legal and regulatory framework index from the IMD World Competitiveness Online. The variable assesses the quality of law enforcement with index scores from 0 to 10; the higher the index is, the higher the legality is.
2.1.5. Control variables
Following the literature, we used control variables to take firm characteristics into account and added the variables of particular interest to our study. Many studies on firm performance have used firm size, financial leverage, and sales growth as control variables. Specifically, firm size serves to control for possible economies of scale. Meanwhile, financial leverage is used to control for the influence of capital structure on investment behavior and managerial discretion. Sales growth was included to capture the impact of
demand conditions and business-cycle fluctuations on performance. We measured firm size (Size) as the natural logarithm of book value of total assets at fiscal yearend. Financial leverage (Leverage) was measured as long-term debt plus short-term debt scaled by the book value of assets, while sales growth (Growth) was measured by the three-year growth rate in total sales (Schoar, 2002; Gedajlovic and Shapiro, 1998).
We also constructed a dummy variable COMMON that took the value of 1 if the sample firm belonged to the common law country, whereas those located in a civil law country took the value of 0. The belief definitions of all our variables employed in this study can be found in Table 1.
Table 1 Definitions of variables
The table provides definitions of all variables included in the empirical analyses of this study.
Variables Definition
Tobin's Q (TOBINQ) (Book value of total assets-Book value of equity + Market value of equity)/Book value of total assets
Herfindahl-Hirschman
Index (HHI) (at the three-digit SIC code level) Extent of product
substitutability in industry (DIFF)
Industry sales / Industry operating costs, operating costs that include cost of goods sold, selling, general and administrative expenses, depreciation, depletion, and amortization (at the three-digit SIC code level)
Level of market size in industry (MKTSIZE)
Natural log of industry sales (at the three-digit SIC code level)
Level of entry costs in industry (ENTCOST)
Natural log of industry weighted average of gross value of cost of property, plant and equipment for firms in the industry (at the three-digit SIC code level) Free cash flow (FCF) (Cash flows from operations - capital expenditures) / Book value of total assets Firm Size (Size) The natural log of book value of assets at fiscal year end
Financial leverage (Leverage)
(Long-term debt + short-term debt )/ book value of assets Sales growth (Growth) The three-year growth rate in total sales
Shareholders' rights (RIGHTS)
The natural log of shareholder's right index; the index is from 0 (worst) to 10 (best). Rule of Law (LAW) The natural log of legal and regulatory framework measure and the index is from 0
(worst) to 10 (best) Common law country
(COMMON)
Dummy variable that is equal to 1 if the sample firm belongs to the Common law country and 0 otherwise
2.2. Sample Selection and Descriptive Statistics
Our main data source was Standard & Poor’s Compustat. This provides fundamental financial and price data for both active and inactive publicly traded companies.
Country-level governance data, such as shareholder rights and legal protection, were from the IMD World Competitiveness Online. This resource provides a worldwide reference point on the competitiveness of nations, rankings, and analyses on how an economy creates and sustains the competitiveness of enterprises.
The sample data were drawn from all exchange-listed firms in the four economic markets (i.e., USA, UK, Germany, and France) over the sever-year period starting from 2002 to 2008. We eliminated all firms that did not operate primarily in the manufacturing sector (SIC codes 2000–3999). Because firms in industries such as the financial industry and the utility industry are subject to regulations and have different characteristics of their accounting information compared to those in other industries. To control for outliers, we dropped the variable HHI1 of the firm-year observations at the right tail of the HHI distribution in each country by 2.5%. Furthermore, since Tobin’s Q is a ratio variable that can easily have extreme values, we also dropped the firm-year observations at each tail of the Tobin’s Q distribution in each country by 1%.
This selection process resulted in a final sample of 10,514 firm-year observations, including four whole country samples. The separate sample sizes for independent countries based on firm-year observation are as follows: USA (7,329), UK (1,232), Germany (1,092), and France (861).
Table 2 provides descriptive statistics (i.e., the mean, median, and standard deviation) of
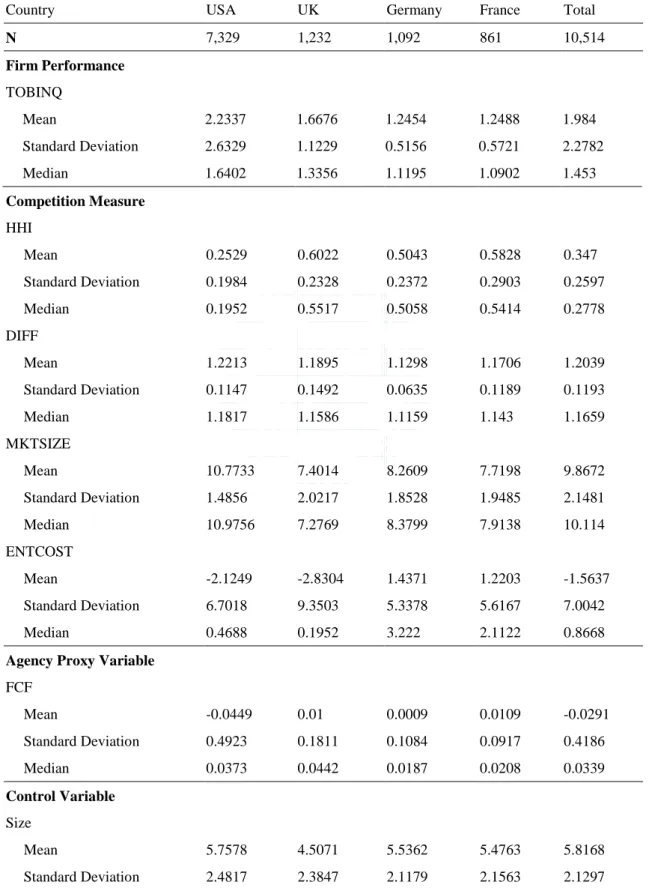
all key variables included in our analysis for the full sample period from 2002 to 2008. In measuring corporate performance, the USA and UK, as expected, have larger values (USA: 2.2337, UK: 1.6676) than those of Germany and France (Germany: 1.2454, France: 1.2488), thus indicating that common law countries, on average, receive higher corporate
1
In some cases, the three-digit SIC codes that partition the industry definition are rather narrow, with the effect that some industries consist of a single firm, even though common sense suggests that they should be pooled together with other industries. By construction, these industries have an HHI of 1, which explains the small “spike” at the right endpoint of the empirical HHI distribution. Thus, we dropped the firm-year observations at the right tail of the distribution by 2.5% to correct this misclassification.
performance than civil law countries. This finding is consistent with that of LLSV (2002). The standard deviation of the whole sample is 2.2782. This value represents a large variation across countries and emphasizes regional and global difference in the quality and effectiveness of laws around the world.
As for competition measures, common law countries have higher mean values in DIFF and MKTSIZE as well as lower mean values in HHI and ENTCOST, indicating that the USA and UK have intense competition structures in their respective product markets. In contrast, civil law countries have lower mean values in DIFF and MKTSIZE as well as higher mean values in HHI and ENTCOST, indicating that Germany and France have less intense competition structure in their product market.
The proxy for agency problem is FCF. France shows the highest value of 0.0109, whereas the USA has the lowest value of -0.0449; thus the range for country is 0.0558 and the standard deviation of the whole sample is 0.4186, indicating that the differences and variations are not obvious across the four different countries.
Two country-level governance measures were used. As shown in Table 2, shareholder rights (RIGHTS) was considered an index ranging from 0 to 10 (from IMD World Competitiveness Online). Higher points were assigned to firms in a country that demonstrated responsibility in protecting shareholders’ rights. In this respect, the USA has with the highest mean value of 7.501, whereas France has the lowest score of 6.4924; thus the mean values of RIGHTS in the USA and UK are higher than the values in Germany and France, This result from different missions in operating firm complements the results of a previous work (Allen and Gale, 2000). In the same vein, LAW was used as the legal and regulatory framework index (also from IMD World Competitiveness Online). The score is higher if the firms in that country have good judicial efficiency and legality. On average, the USA and UK (USA: 6.0088, UK: 4.9825) have higher scores than Germany and France (Germany: 3.8966, France: 3.2955). Particularly, the USA has the highest score, which is
consistent with the finding of LLSV (2002).
Table 2 Descriptive statistics
Descriptive statistics of each variable for the four countries from 2002 to 2008; included are the mean, median, standard deviations. The number of samples (N) for each market is also reported in the table. There are 7,329 samples from the USA, 1,232 from the UK, 1,092 from Germany, and 861 from France. The total samples contain 10,514 observations.
Country USA UK Germany France Total
N 7,329 1,232 1,092 861 10,514 Firm Performance TOBINQ Mean 2.2337 1.6676 1.2454 1.2488 1.984 Standard Deviation 2.6329 1.1229 0.5156 0.5721 2.2782 Median 1.6402 1.3356 1.1195 1.0902 1.453 Competition Measure HHI Mean 0.2529 0.6022 0.5043 0.5828 0.347 Standard Deviation 0.1984 0.2328 0.2372 0.2903 0.2597 Median 0.1952 0.5517 0.5058 0.5414 0.2778 DIFF Mean 1.2213 1.1895 1.1298 1.1706 1.2039 Standard Deviation 0.1147 0.1492 0.0635 0.1189 0.1193 Median 1.1817 1.1586 1.1159 1.143 1.1659 MKTSIZE Mean 10.7733 7.4014 8.2609 7.7198 9.8672 Standard Deviation 1.4856 2.0217 1.8528 1.9485 2.1481 Median 10.9756 7.2769 8.3799 7.9138 10.114 ENTCOST Mean -2.1249 -2.8304 1.4371 1.2203 -1.5637 Standard Deviation 6.7018 9.3503 5.3378 5.6167 7.0042 Median 0.4688 0.1952 3.222 2.1122 0.8668
Agency Proxy Variable
FCF Mean -0.0449 0.01 0.0009 0.0109 -0.0291 Standard Deviation 0.4923 0.1811 0.1084 0.0917 0.4186 Median 0.0373 0.0442 0.0187 0.0208 0.0339 Control Variable Size Mean 5.7578 4.5071 5.5362 5.4763 5.8168 Standard Deviation 2.4817 2.3847 2.1179 2.1563 2.1297
Median 5.9203 4.4931 5.17 5.1128 5.6516 Leverage Mean 0.5259 0.5112 0.5983 0.6051 0.5382 Standard Deviation 1.2524 0.2307 0.216 0.1979 1.0529 Median 0.4506 0.5134 0.6175 0.6073 0.4944 Growth Mean 0.1369 0.0859 0.0723 0.0749 0.1191 Standard Deviation 1.1324 0.312 0.2049 0.2856 0.9576 Median 0.0765 0.0485 0.0478 0.0415 0.0657 Country-level governance RIGHTS Mean 7.501 7.1572 7.31 6.4924 7.3582 Standard Deviation 0.452 0.317 0.1934 0.2902 0.4955 Median 7.4828 7.0227 7.3488 6.5217 7.2941 LAW Mean 6.0085 4.9825 3.8991 3.5384 5.4669 Standard Deviation 0.4821 1.0488 0.7254 0.5248 1.077 Median 6.2308 4.2963 3.8966 3.2955 5.7
3. Methodology and Hypothesis
Prior to investigating the relation between industry competition and firm performance under different situations, we used the univariate t-test grouped by HHI to detect the existence of TOBINQ difference in different legal systems and different countries. If the TOBINQ difference significantly existed in different HHI groups, then we considered that the differences likely came from different levels of the competition. HHI was calculated as the sum of squared market shares, with a larger HHI indicating more concentration and less competition in the industry. We independently partitioned the sample into two sub-samples based on the firm’s HHI in the specific country. For each year, a firm was placed into the high HHI group to find out if its HHI exceeded the within-year median HHI in its country; otherwise, the firm was placed into the low HHI group in its country.
Furthermore, since the competition is an effective instrument for solving agency problems and improving corporate governance (Fama, 1980; Giroud and Mueller, 2010),
Griffith (2001) also shows that an increase in product market competition is associated with an increase in productivity, especially for firms with potentially substantial agency problems. We conducted a further study into examine a more specific issue: Where did the difference come from? We assumed that the difference came from different agency problem situations and that the difference is more obvious in the higher FCF group, thus indicating that the competition could lead to TOBINQ difference in those firms suffering from an agency problem. FCF was calculated as cash flow from operations minus capital expenditures scaled by total assets. We independently partitioned the sample into two sub-samples based on the firm’s FCF. For each year, a firm was placed into the high HHI group if its FCF exceeded the within-year median HHI in its country; otherwise, the firm was placed into the low FCF group in its country.
In order to investigate the relation between competition and firm performance, we conducted two regression analyses mainly at the firm level. We used the following equations to test the predictions in the present study:
Equation (1) follows most of the previous studies in literature (Aggarwal and Samwick, 1999; Allayannis and Ihrig, 2001; Campello, 2005; MacKay and Phillips, 2005; Haushalter, Klasa and Maxwell, 2006; Hou and Robinson, 2006; Grullon and Michaely, 2007). This equation uses HHI as the industry competition measure, with the higher HHI indicating more concentration and less competition in the industry. We expected its sign to be negative related to TOBINQ. Equation (2) follows recent studies suggesting that competition comprise several dimensions, such as product substitutability, market size, and entry costs
1 COM M ON, , 7 , 6 , 5 , 4 , 3 , 2 , 1 0 , t i t i t i t i t i t i t i t i t i LAW RIGHTS Growth Leverage Size HHI TONBINQ
2 , , 9 , 8 , 7 , 6 , 5 , 4 , 3 , 2 , 1 0 , t i t i t i t i t i t i t i t i t i t i t i COMMON LAW RIGHTS Growth Leverage Size ENCOST MKTSIZE DIFF TONBINQ (Raith 2003; Karuna 2007). We used this equation to prove that competition is multi-dimensional in its relation to performance, and industry characteristics play a major role in influencing firm performance, greater product substitutability, greater market size and lower entry costs, thereby reflecting greater price competition. We expected the signs for DIFF, MKTSIZE, and ENCOST to be positive, positive and negative, respectively.
In the same way, since the intense product market competition helps solve agency problems and improve performance (Fama, 1980; Giroud and Mueller, 2010), especially for firms with potentially substantial agency problems (Griffith 2001), we also did the same grouping to check this issue in accordance to what we have previously inferred. We considered the positive relation between product competition and firm performance to be more profound for the firms with higher free cash flow, indicating that the competition can help improve firm performance in those firms suffering from agency problems. Hence, we performed this research both on a whole sample base and on independent country sample base.
The above arguments led to the following predictions:
Hypothesis 1: The relation between industry competition and firm performance is positive. Hypothesis 2: The positive relation between industry competition and firm performance is more profound for firms with higher FCFs.
Given that our sample comprised panel data with variation in market structure in four countries, a random-effect regression was used to control for unobserved industry effects on performance in different countries; these were assumed to be constant through time but expected to vary across industries in different countries (Wooldridge, 2002).
4. Empirical Results
4.1. Bivariate Analysis
TOBINQ between two groups. We implemented the t-test in order to determine the differences.
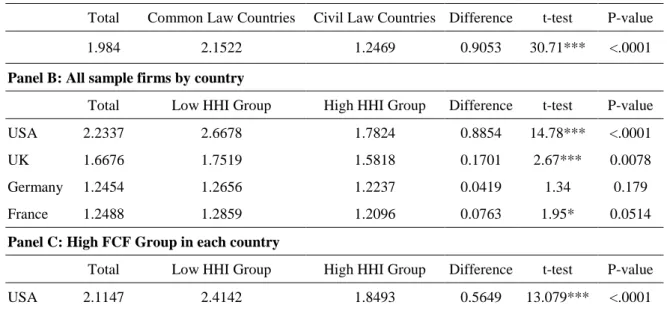
Panel A shows the mean statistics and t-test of TOBINQ by groups of legal system. The mean of TOBINQ is 2.1522 for the common law countries group, and 1.2469 for the civil law countries group. The difference of TOBINQ between the two groups is statistically significant with p-value less than 0.0001. This indicates that common law countries outperform civil law countries. The present finding is similar with that shown in a previous study stating that legal protections for outside investors vary considerably across countries, with common law countries, such as the USA and UK, showing much higher levels of protection than civil law countries such as Germany and France (La Porta et al. 1998). In addition, common law countries have better operating performance (LLSV 2002; Chua et al., 2007; Gompers, Ishii and Meyrick, 2003).
Panel B presents the mean statistics and t-test of TOBINQ by groups of HHI. As shown in Panel B, the mean value of TOBINQ in the Low HHI group is generally higher than that in the High HHI group in each country. However, the difference is less statistically significant in civil law countries. The p-value is significant at the 1% level in the USA and UK. However, the difference is significant at 10% in France but is not significant in Germany. On average, firms in the high competition industries show higher TOBINQ values in each country.
Panel C also presents the mean statistics and t-test of TOBINQ by groups of HHI. The sample only considered those firms with substantial higher FCFs in its country. A firm was placed into the High FCF group if its FCF was higher than the sample median in its country. High FCF groups were considered as those firms that have a potential agency problem (Jensen 1986; Chi and Lee 2005). In Panel C, the difference between the Low HHI group and the High HHI group is still significant at the 1% level in the US and UK; however, the result in Germany and France turned out to be significant after we grouped the country by
FCF. In order to compare with the result in Panel C, we did the same research in Panel D and considered only those firms with lower FCFs in its country. The Low FCF group consisted of firms with minor agency problems. The difference between the Low and the High HHI groups is not significant in all countries except the USA.
Overall, the univariate statistics show that common law countries perform better than civil law countries, and that the Low HHI Group has higher performance than the High HHI Group; however, the difference only significantly exists in the High FCF Group. Therefore, the result meets our expectation: the performance difference comes from the different agency problem situations are more obvious in the higher FCF group, thereby indicating that competition can lead to TOBINQ differences in those firms suffering from agency problems.
Table 3 Two Sample t-test of Tobin's Q
The table presents the mean statistics of TOBINQ by groups and tests the differences of TOBINQ between two groups. To test the differences, we implement the t-test. Difference tests also show p-value from t-tests. Panel A show the mean statistics and t-test of TOBINQ by groups of legal system for whole sample; Panel B presents the mean statistics and t-test of TOBINQ by groups of HHI in each country; Panel C also presents the mean statistics and t-test of TOBINQ by groups of HHI, but the sample only consider on those firms with substantial higher free cash flows in its country; Panel D also presents the mean statistics and t-test of TOBINQ by groups of HHI, but the sample only consider on those firms with substantial minor free cash flows in its country. For each year, a firm is placed into the high HHI group if its HHI exceeds the within-year median HHI in its country; otherwise, the firm is placed into the low HHI group in its country. Similarly, a firm is placed into the low FCF group if its FCF is lower than the sample median; otherwise, the firm is placed into the high FCF group. HHI is calculated as the sum of squared market shares. FCF is calculated as cash flows from operations minus capital expenditures, scaled by total assets. *, **, and *** indicate significance at 10%, 5%, and 1% respectively
Panel A: Whole sample firms by legal system
Total Common Law Countries Civil Law Countries Difference t-test P-value
1.984 2.1522 1.2469 0.9053 30.71*** <.0001
Panel B: All sample firms by country
Total Low HHI Group High HHI Group Difference t-test P-value
USA 2.2337 2.6678 1.7824 0.8854 14.78*** <.0001
UK 1.6676 1.7519 1.5818 0.1701 2.67*** 0.0078
Germany 1.2454 1.2656 1.2237 0.0419 1.34 0.179
France 1.2488 1.2859 1.2096 0.0763 1.95* 0.0514
Panel C: High FCF Group in each country
Total Low HHI Group High HHI Group Difference t-test P-value
UK 1.691 1.834 1.5355 0.2985 4.37*** <.0001
Germany 1.2967 1.3465 1.2436 0.1029 2.25** 0.0247
France 1.1541 1.2177 1.0804 0.1373 2.66*** 0.0081
Panel D: Low FCF Group in each country
Total Low HHI Group High HHI Group Difference t-test P-value
USA 2.3073 2.7673 1.6204 1.1469 11.18*** <.0001
UK 1.644 1.6642 1.6249 0.0393 0.36 0.7157
Germany 1.1941 1.1851 1.2037 -0.0186 -0.44 0.6581
France 1.3535 1.3588 1.286 0.0728 1.34 0.182
4.2. Regression Analysis
In Section 4.1, we have shown that the difference of performance in firms existed in different legal systems, countries, and agency problem situations. Thus, we performed a series of regression analyses to test our hypotheses. Our empirical results are reported in
Tables 4–6. Following the methodology used by LLSV (2002), we ran random-effect
regressions, allowing for country-specific or industry-specific random effects. This helped alleviate the concern about the possibly omitted variables at the country or industry level. 4.2.1. The effect of industry competition on firm performance
In this section, we present our investigation on whether industry competition affects a manager’s decision to exert more efforts into improving the performance of a company.
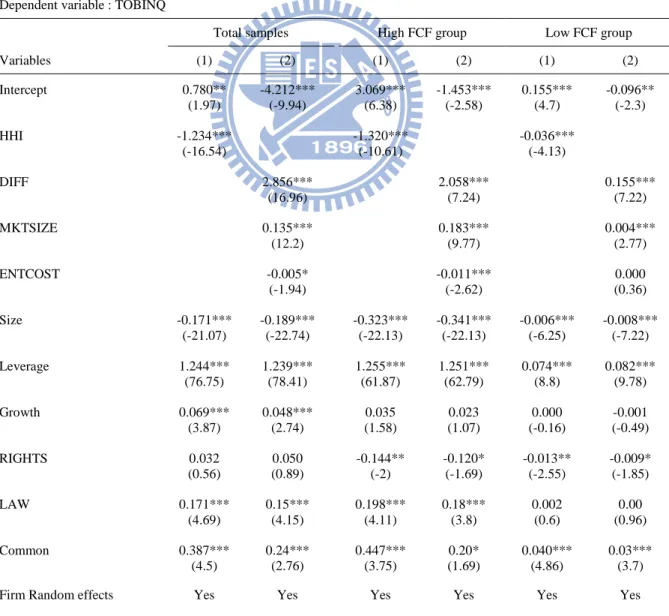
The results are given in Table 4. Columns 1 and 2 of Table 4 provide the results for the panel regression conducted based on Equations (1) and (2), which includes the whole sample. The results generally show that competition and legal system affect firm performance. The coefficients are generally as predicted and are consistent with prior research. In Equation (1), the coefficient on HHI, β1, is -1.234, which is negative and
significant at the 1% level. In Equation (2), the coefficient on DIFF, β1, is 2.856, which is
positive and significant at the 1% level. The coefficient on MKTSIZE, β2, is 0.135 which is
positive and significant at the 1% level). The coefficient on ENTCOST, β3, is -0.005, which
concentration level, the greater product substitutability, greater market size, and lower entry costs are associated with higher Tobin’s Q. These suggest that competition is positively related to performance.
In line with earlier empirical studies on firm performance (Gedajlovic and Shapiro, 1998; Nickell and Nicolitsas, 1999; Spanos, Zaralis and Lioukas, 2004; Goddard et al., 2005), we find that Size has a negative impact on TOBINQ, whereas Leverage and Growth have a positive effect on performance measures.
As documented in LLSV (1998), English common law countries tend to provide shareholders with stronger protection than countries with civil law traditions, the former countries thus score higher on the shareholder’s rights and legal protection. In Equations (1) and (2), the coefficient for LAW is positive, as expected, and statistically significant at the the 1% level, whereas COMMON also has a positive and significant coefficient at the 1% level. However, the coefficient for RIGHTS is not significant.
In line with Hypothesis 1, the overall results in Columns 1 and 2 of Table 4 suggest that firms have better firm performance when industry competition is greater. The results, significant in Equation (2), also suggest that competition is multi-dimensional in its relation with performance. And the adjusted R2 values are higher in Equation (2) than in the Equation (1), the results also suggest that industry characteristics play a major role in influencing firm performance, we should not omit them. However, the legal system also plays an important role in affecting performance, and thus, common law countries have better corporate performance.
4.2.2. The effect of potential FCF problems on the relation between industry competition and firm performance
As discussed earlier, if industry competition is an effective instrument for solving agency problems and improving corporate governance (Fama, 1980; Giroud and Mueller, 2010), especially for firms with potential agency problems (Griffith, 2001), the positive relation
between the competition and firm performance documented in this section should be stronger among firms with high FCF levels. Given that competition affects a manager’s decision by increasing the risk and the cost of overinvesting and bankruptcy (Griffith, 2001; Mitton, 2004; Bozec, 2005; Baggs and Bettignies, 2007; Grullon and Michaelly, 2007; Bartram et al., 2008; Giroud and Mueller, 2010), its effect on performance should be stronger among those firms that are more likely to overinvest because they have great amounts of FCF on hand.
In this section, we examine this issue by estimating regressions relating firm performance to the competition measures on sub-samples partitioned based on whether a firm has high or low potential problem on FCFs.
Columns 3, 4, 5, and 6 of Table 4 provide the results for the panel regression conducted based on Equations (1) and (2) on sub-samples partitioned based on FCF. In Equation (1), the negative relation between TOBINQ and HHI is completely driven by the firms with high FCFs. Note that the effect of the HHI on TOBINQ for the firms with high FCF (see Column 3) based on order of magnitudes is larger than firms with low FCFs (see Column 5). In the high FCF group, where the agency problem is assumed to be more severe, we find that the coefficient on the HHI has a value of -1.32. However, in the low FCF group, where the agency problem from FCFs is minor, we find that the coefficient on the HHI is almost zero (coefficient = -0.036). Columns 4 and 6 of Table 4 show similar results using Equation (2); the coefficients of three competition measures are higher in the high FCF group. In addition, the adjusted R2 values are much higher in the High FCF group than in the Low FCF group. The outcomes imply that the competition measures have more explanatory power in firm performance when the samples are limited to having more severe agency problems.
Consistent with Hypothesis 2, results in Columns 3, 4, 5, and 6 of Table 4 suggest that the effect of product competition on firm performance is more profound when the agency
problem of free cash flows is more severe.
Table 4 Regression results for the whole sample
The table reports the effect of industry competition on the firm performance for the period 2002 to 2008. Column 1 and 2 of Table 4 provides the results for the panel regression conducted based on equation (1) and equation (2) including using whole sample. Column 3, 4, 5, and 6 of Table 4 provides the results for the panel regression conducted based on equation (1) and equation (2) on sub-samples partitioned based on FCF. A firm is placed into the low FCF group if its FCF is lower than the sample median; otherwise, the firm is placed into the high FCF group. FCF is equal to (Cash flows from operations - capital expenditures) / Book value of total assets. TOBINQ is equal to (Book value of total assets-Book value of equity + Market value of equity)/Book value of total assets. HHI is the Herfindahl-Hirschman Index for a certain year measured as the sum of squared market shares over all companies in an industry. DIFF is equal to sales/operating costs, for each industrial segment; operating costs include cost of goods sold, selling, general, and administrative expense, and depreciation, depletion, and amortization. MKTSIZE is equal to natural log of industry sales. ENCOST is equal to natural log of weighted average of gross value of cost of property, plant and equipment for firms in industry, weighted by each firm’s market share in industry. Size is equal to the natural log of book value of assets at fiscal year end. Leverage is equal to long-term debt plus short-term debt scaled by the book value of assets. Growth is equal to the five-year growth rate in total sales. RIGHTS is the natural log of shareholder's right index; the index is from 0 to 10(best). LAW is the natural log of legal and regulatory framework measure and the index is from 0 to 10(best). COMMON is a dummy variable that equal one if the sample firm belongs to the common law country. The t- statistics are in parentheses. *, **, and *** indicate significance at 10%, 5%, and 1% respectively.
Dependent variable : TOBINQ
Total samples High FCF group Low FCF group
Variables (1) (2) (1) (2) (1) (2) Intercept 0.780** -4.212*** 3.069*** -1.453*** 0.155*** -0.096** (1.97) (-9.94) (6.38) (-2.58) (4.7) (-2.3) HHI -1.234*** -1.320*** -0.036*** (-16.54) (-10.61) (-4.13) DIFF 2.856*** 2.058*** 0.155*** (16.96) (7.24) (7.22) MKTSIZE 0.135*** 0.183*** 0.004*** (12.2) (9.77) (2.77) ENTCOST -0.005* -0.011*** 0.000 (-1.94) (-2.62) (0.36) Size -0.171*** -0.189*** -0.323*** -0.341*** -0.006*** -0.008*** (-21.07) (-22.74) (-22.13) (-22.13) (-6.25) (-7.22) Leverage 1.244*** 1.239*** 1.255*** 1.251*** 0.074*** 0.082*** (76.75) (78.41) (61.87) (62.79) (8.8) (9.78) Growth 0.069*** 0.048*** 0.035 0.023 0.000 -0.001 (3.87) (2.74) (1.58) (1.07) (-0.16) (-0.49) RIGHTS 0.032 0.050 -0.144** -0.120* -0.013** -0.009* (0.56) (0.89) (-2) (-1.69) (-2.55) (-1.85) LAW 0.171*** 0.15*** 0.198*** 0.18*** 0.002 0.00 (4.69) (4.15) (4.11) (3.8) (0.6) (0.96) Common 0.387*** 0.24*** 0.447*** 0.20* 0.040*** 0.03*** (4.5) (2.76) (3.75) (1.69) (4.86) (3.7) Firm Random effects Yes Yes Yes Yes Yes Yes
Observations 10514 10514 5264 5264 5250 5250 Adj. R-squared 0.413 0.443 0.481 0.501 0.025 0.038
4.2.3. The effect of industry competition on firm performance in different countries
We used different country samples to examine whether the relationship between competition and performance is robust under different countries that have different characteristics.
The results for the main tests conducted are given in Table 5. In Equation (1), the coefficient on HHI, β1, is -1.554 for USA, -0.46 for UK, -0.314 for Germany, and -0.166 for
France. All of them are negative and significant, as expected. The results generally show that lower industry concentration level is associated with a higher Tobin’s Q value, suggesting that competition is positively related to performance. However, in Equation (2), the coefficient on MKTSIZE is not significant in France, and the coefficient on ENCOST is not significant in Germany and France. Thus, comparing Models (1) and (2) for their fitness, we find that the adjusted R2 value is much higher in Equation (2) than in Equation (1) in both Germany and France. The results indicate that insignificant coefficients of competition measures in Germany and France may not result from the fitness of model. It should have some factor that we have not taken into consideration in our analysis yet, considering these insignificant results. Therefore, we believe that the factor may be an agency problem. The detailed discussion proving our inference is presented in Section 4.2.4.
Table 5 Regression results by country
The table reports the effect of industry competition on the firm performance for the period 2002 to 2008 in each country. There are 7,329 samples for USA, 1,232 for UK, 1092 for Germany, and 861 for France. TOBINQ is equal to (Book value of total assets-Book value of equity + Market value of equity)/Book value of total assets. HHI is the Herfindahl-Hirschman Index for a certain year measured as the sum of squared market shares over all companies in an industry. DIFF is equal to sales/operating costs, for each industrial segment; operating costs include cost of goods sold, selling, general, and administrative expense, and depreciation, depletion, and amortization. MKTSIZE is equal to natural log of industry sales. ENCOST is equal to natural log of weighted average of gross value of cost of property, plant and equipment for firms in industry, weighted by each firm’s market share in industry. Size is equal to the natural log of book value of assets at fiscal year end. Leverage is equal to long-term debt plus short-term debt scaled by the book value of assets. Growth is equal to the five-year growth rate in total sales. RIGHTS is the natural log of shareholder's right index; the index is from 0 to 10(best). LAW is the natural log of legal and regulatory framework measure and the index is from 0 to 10(best). The t- statistics are in parentheses. *, **, and *** indicate significance at 10%, 5%, and 1% respectively.
Dependent variable : TOBINQ
USA UK Germany France
Variables (1) (2) (1) (2) (1) (2) (1) (2) Intercept 3.613*** -3.274*** 5.032*** 2.991*** 1.309** -0.054 2.604*** 4.616*** (8.28) (-6.16) (5.51) (3.32) (2.19) (-0.08) (4.41) (4.71) HHI -1.544*** -0.467*** -0.314*** -0.166** (-12.83) (-3.46) (-5.02) (-2.5) DIFF 3.825*** 1.070*** 0.868*** 0.532** (16.02) (4.06) (3.38) (2.13) MKTSIZE 0.102*** 0.120*** 0.061*** -0.021 (5.41) (5.79) (5.96) (-0.29) ENTCOST -0.010** -0.008** -0.004 -0.004 (-2.55) (-2.5) (-1.39) (-0.54) Size -0.233*** -0.224*** -0.029** -0.070*** -0.017** -0.048*** 0.008 -0.267*** (-19.8) (-19.2) (-1.99) (-4.52) (-2.28) (-5.51) (0.91) (-5.64) Leverage 1.243 1.238*** -0.081 0.003 -0.266*** -0.111 -0.439*** 0.616*** (65.93) (67.06) (-0.57) (0.02) (-3.74) (-1.55) (-4.39) (4.4) Growth 0.052** 0.035 0.800*** 0.608*** 0.442*** 0.361*** 0.117* -0.070 (2.5) (1.71) (8.02) (6.29) (6) (4.92) (1.73) (-1.19) RIGHTS -0.225*** -0.144*** -0.454*** -0.515*** 0.133 0.100 -0.094 -0.164*** (-4.04) (-2.62) (-3.05) (-3.63) (1.53) (1.17) (-1.23) (-3) LAW 0.243*** 0.26*** 0.054 0.10** -0.169*** -0.16*** -0.124*** -0.21*** (4.66) (5.01) (1.21) (2.31) (-7.27) (-6.73) (-2.94) (-5.88) Firm Random effects Yes Yes Yes Yes Yes Yes Yes Yes Observations 7329 7329 1232 1232 1092 1092 861 861 Adj. R-squared 0.414 0.438 0.068 0.153 0.106 0.142 0.035 0.089
4.2.4. The effect of potential free cash flow problems on the relation between industry competition and firm performance for different countries
In this section, we discuss how we investigated the agency problem affecting the association between competition measure and performance measure in different countries. We expected that the effect of competition measured on TOBINQ would be more profound
when the agency problem is more severe no matter which country we use. The results are presented in the Table 6.
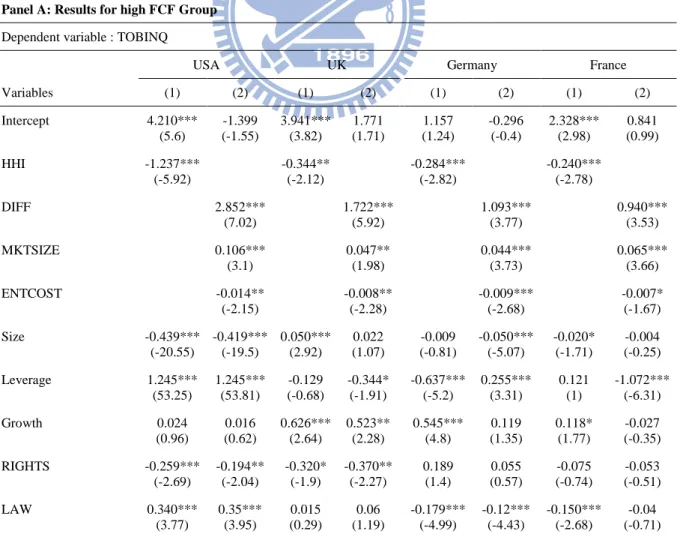
Panels A and B show the regression results for the above- and below-median FCF groups. The results are consistent with our prediction. The coefficients on competition measures meet our expectation and are generally larger for the High FCF group than for the Low FCF group in Equations (1) and (2) in each country. In Panel A, we only considered firms with a large amount of FCF into regression. In Equation (1), the coefficients of HHI are still negatively significant in all countries as reflected in Table 5. When we observe the coefficients in each country further, we find that the absolute value of coefficient in HHI is highest in USA and lowest in France. We know that TOBINQ is a market-based performance could be influenced by any information in the stock market. If a market is more efficient, investors would be more willing to join it, and the capital market will be more active. Germany and France emphasize their mission of protecting stakeholders’ rights but not shareholders and they provide lower levels of protection than common law countries (Allen and Gale, 2000; La Porta et al., 2002; Gompers, Ishii and Meyrick, 2003; Chua, Eun et al., 2007), these factors make investors be reluctant to go in the capital market, so the impact of industry competition on firm performance will reduce in Germany and France because their capital market are less active in these countries. This is the reason why the coefficient of HHI will be lower in civil law countries than in common law countries. In Equation (2), the coefficients of multi-dimensional competition variables are all significant in all countries, as expected. Compared with the results in Table 5, which used the whole sample, the originally insignificant coefficients turned out to have at least a 10% significance level in France and Germany. In Panel B, the coefficients have the lowest value and significance in the three samples (whole sample, High FCF group, and Low FCF group).
group among the three samples, implying that the competition measures have more explanatory power in firm performance when the samples are limited to have more severe agency problems. Overall, the results in Table 6 are consistent with Hypothesis 2: the effects of competition are more profound when potential agency problems exist in each country (i.e., USA, UK, Germany, and France).
Table 6 Regression Results Grouping by FCF
The table reports the effect of industry competition on the firm performance for the period 2002 to 2008 in each country. There are 7,329 samples for USA, 1,232 for UK, 1092 for Germany, and 861 for France. Panel A and B show regression results for the above- and below-median free cash flow groups. A firm is placed into the low FCF group if its FCF is lower than the sample median; otherwise, the firm is placed into the high FCF group. FCF is equal to (Cash flows from operations - capital expenditures) / Book value of total assets. TOBINQ is equal to (Book value of total assets-Book value of equity + Market value of equity)/Book value of total assets. HHI is the Herfindahl-Hirschman Index for a certain year measured as the sum of squared market shares over all companies in an industry. DIFF is equal to sales/operating costs, for each industrial segment; operating costs include cost of goods sold, selling, general, and administrative expense, and depreciation, depletion, and amortization. MKTSIZE is equal to natural log of industry sales. ENCOST is equal to natural log of weighted average of gross value of cost of property, plant and equipment for firms in industry, weighted by each firm’s market share in industry. Size is equal to the natural log of book value of assets at fiscal year end. Leverage is equal to long-term debt plus short-term debt scaled by the book value of assets. Growth is equal to the five-year growth rate in total sales. RIGHTS is the natural log of shareholder's right index; the index is from 0 to 10(best). LAW is the natural log of legal and regulatory framework measure and the index is from 0 to 10(best). The t- statistics are in parentheses. *, **, and *** indicate significance at 10%, 5%, and 1% respectively.
Panel A: Results for high FCF Group
Dependent variable : TOBINQ
USA UK Germany France
Variables (1) (2) (1) (2) (1) (2) (1) (2) Intercept 4.210*** -1.399 3.941*** 1.771 1.157 -0.296 2.328*** 0.841 (5.6) (-1.55) (3.82) (1.71) (1.24) (-0.4) (2.98) (0.99) HHI -1.237*** -0.344** -0.284*** -0.240*** (-5.92) (-2.12) (-2.82) (-2.78) DIFF 2.852*** 1.722*** 1.093*** 0.940*** (7.02) (5.92) (3.77) (3.53) MKTSIZE 0.106*** 0.047** 0.044*** 0.065*** (3.1) (1.98) (3.73) (3.66) ENTCOST -0.014** -0.008** -0.009*** -0.007* (-2.15) (-2.28) (-2.68) (-1.67) Size -0.439*** -0.419*** 0.050*** 0.022 -0.009 -0.050*** -0.020* -0.004 (-20.55) (-19.5) (2.92) (1.07) (-0.81) (-5.07) (-1.71) (-0.25) Leverage 1.245*** 1.245*** -0.129 -0.344* -0.637*** 0.255*** 0.121 -1.072*** (53.25) (53.81) (-0.68) (-1.91) (-5.2) (3.31) (1) (-6.31) Growth 0.024 0.016 0.626*** 0.523** 0.545*** 0.119 0.118* -0.027 (0.96) (0.62) (2.64) (2.28) (4.8) (1.35) (1.77) (-0.35) RIGHTS -0.259*** -0.194** -0.320* -0.370** 0.189 0.055 -0.075 -0.053 (-2.69) (-2.04) (-1.9) (-2.27) (1.4) (0.57) (-0.74) (-0.51) LAW 0.340*** 0.35*** 0.015 0.06 -0.179*** -0.12*** -0.150*** -0.04 (3.77) (3.95) (0.29) (1.19) (-4.99) (-4.43) (-2.68) (-0.71)
Firm Random effects Yes Yes Yes Yes Yes Yes Yes Yes Observations 3668 3668 616 616 546 546 427 427 Adj. R-squared 0.501 0.511 0.146 0.248 0.145 0.174 0.073 0.154
Panel B: Results for Low FCF Group
Dependent variable : TOBINQ
USA UK Germany France
Variables (1) (2) (1) (2) (1) (2) (1) (2) Intercept 1.157 -3.388*** 6.347*** 4.863*** 1.229 -0.314 3.424*** 2.458*** (1.24) (-7.18) (4.38) (3.45) (1.58) (-0.37) (3.84) (2.59) HHI -0.284*** -0.473** -0.167* -0.143 (-2.82) (-2.33) (-1.95) (-1.4) DIFF 3.492*** -0.268 1.154*** 0.495* (15.93) (-0.56) (3.42) (1.86) MKTSIZE 0.061*** 0.228*** 0.042*** 0.033* (3.82) (5.98) (2.89) (1.84) ENTCOST -0.006* -0.012** -0.003 -0.003 (-1.78) (-2.07) (-0.76) (-0.58) Size -0.009 -0.026** -0.163*** -0.208*** -0.025*** -0.040*** 0.027* 0.005 (-0.81) (-2.34) (-6.48) (-8.4) (-2.6) (-3.53) (1.83) (0.27) Leverage -0.637*** -0.204** -0.100 0.181 -0.041 0.083 -0.872*** -0.834*** (-5.2) (-2.49) (-0.5) (0.94) (-0.47) (0.95) (-5.42) (-5.14) Growth 0.545*** 1.447*** 0.771*** 0.577*** 0.239*** 0.156* 0.317 0.238 (4.8) (14.16) (6.49) (5.05) (3) (1.96) (1.34) (1) RIGHTS 0.189 -0.065 -0.603** -0.639*** 0.110 0.075 -0.217* -0.203* (1.4) (-1.39) (-2.56) (-2.89) (0.98) (0.69) (-1.9) (-1.78) LAW -0.179*** 0.20*** 0.088 0.12* -0.169*** -0.15*** -0.069 -0.06 (-4.99) (4.66) (1.23) (1.83) (-5.55) (-4.86) (-1.08) (-0.88) Firm Random effects Yes Yes Yes Yes Yes Yes Yes Yes Observations 3661 3661 616 616 546 546 434 434 Adj. R-squared 0.114 0.176 0.032 0.102 0.070 0.125 3.40% 0.084
5. Conclusion
Product market competition in an industry affects managerial decisions. Therefore, product market competition is an important determinant of firm performance. However, there is no consensus as to exactly how such competition affects firm performance.
The present study investigates how firm performance changes according to an industry’s intensity of competition under agency problems. When we investigate the relation between firm performance and competition, we consider agency problems between managers and
shareholders, simultaneously. Our research combines industry competition with agency problem issues in order to separate firm performance under different situations. By taking country-level governance into consideration, we do not only aim to perform robust checks for our hypothesis, we also strive to identify the different characteristics of different countries.
Our empirical tests show that higher competition level is positively correlated with better operating performance based on a whole sample, which includes four countries. The results are consistent with those shown in previous studies. Moreover, we find that the positive relation between industry competition and firm performance is more profound for firms with higher free cash flows. The said outputs suggest that competition can improve performance more significantly in those firms that suffer from severe agency problems.
The analysis is robust as regards the four countries in the sample (i.e., USA, UK, Germany, and France), which indicates competition can effectively produce better managerial incentives and alleviate management slack to improve firm performance no matter what shareholder protection and judicial efficiency a firm possesses. That is, the impact of industry competition on firm performance overcomes the impact of country-level governance on performance. In sum, this finding suggests that industry competition is an important factor and improving the competition environment should remain a priority for related policymakers.
References
Aggarwal, R. K., and Samwick, A. A., 1999, Executive compensation, strategic competition, and relative performance evaluation: Theory and evidence, Journal of Finance 54, 1999-2043.
Allayannis, G., and Ihrig, J., 2001, Exposure and markups, Review of Financial Studies 14, 805-835.
Allen, F., and Gale, D., 2000, Corporate governance and competition, Corporate
Governance 23-94.
Anderson, R. C., and Reeb, D. M., 2003, Founding-family ownership and firm performance: Evidence from the s&p 500, Journal of Finance 58, 1301-1328.
Baggs, J., and de Bettignies, J. E., 2007, Product market competition and agency costs,
Journal of Industrial Economics 55, 289-323.
Bartram, S., Brown, P. , How, J. , and Verhoeven, P., 2008, Agency conflicts and corporate payout policies: A global study, working paper, University of Auckland.
Beiner, S., Schmid, M. M., and Wanzenried, G., 2011, Product market competition, managerial incentives and firm valuation, European Financial Management 17, 331-366.
Bozec, R., 2005, Boards of directors, market discipline and firm performance, Journal of
Business Finance & Accounting 32, 1921-1960.
Brush, T. H., Bromiley, P., and Hendrickx, M., 2000, The free cash flow hypothesis for sales growth and firm performance, Strategic Management Journal 21, 455-472. Chae, J., Kim, S., and Lee, E. J., 2009, How corporate governance affects payout policy
under agency problems and external financing constraints, Journal of Banking &
Finance 33, 2093-2101.
Chi, J. D., and Lee, D. S., 2010, The conditional nature of the value of corporate governance, Journal of Banking & Finance 34, 350-361.
Chua, C. T., Eun, C. S., and Lai, S., 2007, Corporate valuation around the world: The effects of governance, growth, and openness, Journal of Banking & Finance 31, 35-56.
Fama, E. F., 1980, Agency problems and the theory of the firm, Journal of Political
Economy 88, 288-307.
Journal of Business 79, 3125-3152.
Gedajlovic, E. R., and Shapiro, D. M., 1998, Management and ownership effects: Evidence from five countries, Strategic Management Journal 19, 533-553.
Ghosal, V., 2002, Potential foreign competition in u.S. Manufacturing, International
Journal of Industrial Organization 20, 1461-1489.
Giroud, X., and Mueller, H. M., 2010, Does corporate governance matter in competitive industries?, Journal of Financial Economics 95, 312-331.
Goddard, John, Tavakoli, Manouche, and Wilson, John O. S., 2005, Determinants of profitability in european manufacturing and services: Evidence from a dynamic panel model, Applied Financial Economics 15, 1269-1282.
Gompers, P., Ishii, J., and Metrick, A., 2003, Corporate governance and equity prices,
Quarterly Journal of Economics 118, 107-155.
Graham, J. R., Harvey, C. R., and Rajgopal, S., 2005, The economic implications of corporate financial reporting, Journal of Accounting & Economics 40, 3-73. Griffith, R., 2001, Product market competition, efficiency and agency costs: An empirical
analysis, Institute for Fiscal Studies.
Grullon, G., and Michaely, R., 2007, Corporate payout policy and product market competition, working paper, Cornell University.
Haushalter, D., Klasa, S., and Maxwell, W. F., 2007, The influence of product market dynamics on a firm's cash holdings and hedging behavior, Journal of Financial
Economics 84, 797-825.
Hill, C. W. L., and Hansen, G. S., 1991, A longitudinal-study of the cause and consequences of changes in diversification in the united-states
pharmaceutical-industry 1977-1986, Strategic Management Journal 12, 187-199. Hou, K. W., and Robinson, D. T., 2006, Industry concentration and average stock returns,