社會責任指數之加入與剔除對股東財富之影響 - 政大學術集成
44
0
0
全文
(2) 社會責任指數之加入與剔除對股東財富之影響. 中文摘要. 自 1990 年代中期,隨著環保、消費者權利、童工…等這些議題被廣泛檢討, 越來越多人同意各別公司與整個社會是價值共享且相互依存的,若要達到共存共 榮的理想,則公司必定要將社會責任融入其自身追求競爭力和商業策略的核心架. 政 治 大 企業除了追求股東的利益極大化外,還必須兼顧員工、顧客、供應商、合作夥伴、 立 構中。企業社會責任(Corporate Social Responsibility)並無公認標準,但一般泛指. ‧ 國. 學. 社區團體、環境…等。. 道瓊永續性指數(Dow Jones Sustainability Index)為現今資本市場衡量企業社. ‧. 會責任的標竿指數,而企業名列在被大眾認可的永續性指數上,就是企業可以傳. sit. y. Nat. 達給利益相關者(stakeholders),表明他們注重企業社會責任的訊號之一。藉由研. al. n. 討企業永續發展和企業價值之間的複雜關係。. Ch. engchi. er. io. 究企業被涵蓋在聲譽卓著的永續性指數之內是否能為股東創造價值,本論文將探. i n U. v. 本研究利用傾向分數配對法(Propensity Score Matching),降低進入與退出道 瓊永續性指數這兩組公司間的異質性,以求得出的結果較不受公司規模、財務槓 桿、產業等外在其他因素干擾。將2002至2009年間的樣本數配對後,以道瓊永續 性指數作為企業社會責任之代理變數,以累積異常報酬率(Cumulative abnormal return)代表為股東創造之財富,我們追蹤資本市場對於企業進入和退出道瓊永續 性指數的反應,來探討股東是否認同公司參與企業社會責任是創造價值之行為。 本研究結果顯示如下: 第一、當企業被加入道瓊永續性指數時,該企業之股 東將獲得正向且顯著性的累積異常報酬率,這代表名列著名的的永續性指數是一 個股東認可,且企業應追尋的目標。第二、當企業被道瓊永續性指數剔除時,該 1.
(3) 企業之股東將獲得負向但不顯著的累積異常報酬率。因此我們至少可以推論,從 事企業社會責任活動,並不會破壞企業整體之價值。. 關鍵字: 企業社會責任、道瓊永續性指數、累積異常報酬率、傾向分數配對法。. 立. 政 治 大. ‧. ‧ 國. 學. n. er. io. sit. y. Nat. al. Ch. engchi. 2. i n U. v.
(4) The Shareholder Effects of Social Index Addition or Deletion. ABSTRACT. Corporate social responsibility (CSR) gradually becomes an important corporate strategy to every company in the worldwide economy. The social performance of a firm can shape the images to key stakeholders, no matter they are. 政 治 大 relationships with the firm 立 in the later stage. While corporations are busy engaging employees, suppliers, customers or investors, and influence decision making and. ‧ 國. 學. and enhancing CSR practices, there are few established empirical research on CSR effects and relevance in the capital markets. Hence, my thesis explores the. ‧. relationship between corporate sustainability and firm value by asking whether. sit. y. Nat. membership on a recognized sustainability index is value generating. As stakeholders. n. al. er. io. are urging that firms demonstrate their commitment to sustainability, one signal that. i n U. v. companies can send to stakeholders to indicate that they are sustainable is. Ch. engchi. membership on a recognized sustainability index. My research investigates this issue by tracing the market reaction to corporate entries and exits from Dow Jones Sustainability Index, recognized as a CSR benchmark, between 2002 and 2009. Instead of using regression models, I employ a propensity score matching (PSM) pairs design to overcome heterogeneity between different firms. My thesis highlights two main findings: a significant share price rising trend in cumulative abnormal returns (CAR) of the samples under the addition situation, suggesting that inclusion on the Dow Jones Sustainability Index (DJSI) is a goal that firms should pursue. Another is an insignificant negative stock market reaction while firms are removed from the 3.
(5) DJSI, and I can draw from the results that, at the very least, adopting CSR doesn’t deteriorate the value of the firms. Our results suggest that the benefits of being included on the DJSI outweigh or equal to the costs associated with applying a membership on DJSI.. Keywords: Corporate Social Responsibility (CSR), Dow Jones Sustainability Index (DJSI), Cumulative Abnormal Return (CAR), Propensity Score Matching (PSM). 立. 政 治 大. ‧. ‧ 國. 學. n. er. io. sit. y. Nat. al. Ch. engchi. 4. i n U. v.
(6) Dedication. Thank you to my parents and lovely brother, especially my mom. Without your financial and spiritual supports, I don’t think I could finish this thesis and receive the master degree! Thank you to my thesis instructors, both Dr. Wu and Dr. Hsu. I would like to show my enormous gratitude, not only for your patience but also for your tolerance of the whole difficult discussion processes.. 政 治 大. Thank you to all my classmates in TIM. It’s really great while I realized that I wasn’t. 立. fighting alone. Ken, Eric, William, Yahsin, and Chi-Shen, you’re definitely the best. ‧ 國. 學. partners!. Special thank you to Chang-Ping in consulting center, you saved my thesis in the last. ‧. minute. I couldn’t figure out how to solve those complicated statistic data without. y. Nat. sit. your timely help. Thanks a million!. n. al. er. io. Last but not least, thank you to my boyfriend Ted. You have been so supporting and. i n U. v. sweet on those tough days, and I’m so lucky to have you by my side.. Ch. engchi. 5.
(7) TABLE OF CONTENTS CHINESE ABSTRACT ......................................................................................................................... 1 ENGLISH ABSTRACT ......................................................................................................................... 3 DEDICATION ........................................................................................................................................ 5 CHAPTER 1: INTRODUCTION ......................................................................................................... 8 BACKGROUND .......................................................................................................................................... 8 MOTIVATION ........................................................................................................................................... 9 THESIS OBJECTIVE AND INVESTIGATION ....................................................................................................... 10 THESIS STRUCTURE .................................................................................................................................. 11 CHAPTER 2: LITERATURE REVIEW ........................................................................................... 12. 政 治 大. STOCK VALUATION INFLUENCED BY SOCIAL INDEX ENTRY/EXIT .......................................................................... 12. 立. SOCIAL IMPACT HYPOTHESIS SUPPORTING POSITIVE EFFECTS OF CSR.................................................................. 12 SHIFT OF FOCUS HYPOTHESIS VIEWING THE OPPOSITE OF CSR .......................................................................... 13. ‧ 國. 學. LITERATURE ON SOCIAL INDEX DELETION OR ADDITION .................................................................................... 15 PROPOSED HYPOTHESIS ........................................................................................................................... 16. ‧. CHAPTER 3: DATA AND METHODOLOGY ................................................................................ 17. y. Nat. DATA AND CHOICE OF ANALYSIS PERIOD ....................................................................................................... 17. sit. MATCHING METHODS: PROPENSITY SCORE MATCHING .................................................................................... 17. er. io. CONFIRMATION OF MATCHING RESULT ........................................................................................................ 20. al. REGRESSION ANALYSIS TO ESTIMATE THE TREATMENT RESULT .......................................................................... 20. n. v i n C h............................................................................................. CHAPTER 4: EMPIRICAL RESULTS 25 engchi U B .......................................................................................................... 25 ASIC STATISTICS BEFORE MATCHING. BASIC STATISTICS AFTER MATCHING ............................................................................................................ 28 MARKET PERFORMANCE COMPARISONS ...................................................................................................... 31 CHAPTER 5: DISCUSSION AND CONCLUSION ......................................................................... 38 REFERENCES ..................................................................................................................................... 41. 6.
(8) LIST OF TABLES/GRAPHICS TABLE 1: CHANGES IN USA STOCKS IN THE DOW JONES SUSTAINABILITY INDEX (DJSI) FROM 2002-2009………………………….……………………………….……………………..……18 TABLE 2: ABBREVIATION AND DEFINITION OF DEPENDENT AND INDEPENDENT VARIABLES.......................................................................................................................................... 21 TABLE 3: BASIC STATISTICS OF S&P500 SAMPLES, SAMPLES OF ADDITIONS AND DELETIONS .......................................................................................................................................... 26 TABLE 4: MATRIX OF CORRELATION COEFFICIENT ................................................................ 27 TABLE 5: MODEL I: CONTEMPORARY ESTIMATION OF PROPENSITY SCORE FUNCTION. 政 治 大. OF DADD ............................................................................................................................................... 29. 立. TABLE 6: MODEL I: CONTEMPORARY ESTIMATION OF PROPENSITY SCORE FUNCTION OF DDELETE ........................................................................................................................................... 29. ‧ 國. 學. TABLE 7: MODEL II: ESTIMATION OF PROPENSITY SCORE FUNCTION OF DADD USING EARLY FACTORS ................................................................................................................................ 32. ‧. TABLE 8: MODEL II: ESTIMATION OF PROPENSITY SCORE FUNCTION OF DDELETE USING. sit. y. Nat. EARLY FACTORS ................................................................................................................................ 32 TABLE 9: DESCRIPTIVE STATISTICS OF INDEPENDENT VARIABLES: BEFORE- AND. io. er. AFTER-MATCHING SAMPLES .......................................................................................................... 33. al. n. v i n Ch ................................................................................................................................................................ 36 engchi U. TABLE 10: PERFORMANCE REGRESSION OF CAR BETWEEN ADDED AND S&P500 FIRMS. TABLE 11: PERFORMANCE REGRESSION OF CAR BETWEEN DELETED AND S&P500 FIRMS .................................................................................................................................................... 37 GRAPH1: HYPOTHESIZED POSITIVE FEEDBACK CYCLE FOR FIRMS ENGAGING IN CSR ............................................................................................................................................................... .39. 7.
(9) Chapter 1: Introduction. Background Since the mid-1990s, the decade has been marked by a new societal demand for measuring the performance of the business sector relative to a spectrum of sustainable development goals(O'Connor & Spangenberg, 2008). This emerging profile of corporate social responsibility (CSR) places distinct requirements on company. 政 治 大. management, notably the need to address three bottom lines of economic, social and. 立. environmental performance. There is also an emphasis on new forms of social. ‧ 國. 學. dialogue as a contribution to company reporting, strategy definition and decision-making.. ‧. Regarding with the CSR benchmarks set for the enterprises, socially responsible. y. Nat. sit. investments are also fast becoming an investment discipline in its own right. Socially. n. al. er. io. responsible investments (SRI) have attracted much money, many investors, and a. i n U. v. great deal of research, including studies of socially responsible mutual funds, socially. Ch. engchi. responsible indices, stocks with good and bad environmental records, and stocks with good and bad employee relations. The FTSE and Dow Jones organizations have both launched indices of socially responsible companies to meet the growing market demand for professional, objective and reliable benchmarks. The Dow Jones Sustainability Index (DJSI) was introduced on September 8 1999 and was the first global index to track the financial performance of leading international sustainability-driven companies. DJSI is internationally recognized for its informational transparency and objectivity and well received by international investment communities. Each year 10% of the leading sustainability companies in 8.
(10) different sectors are selected from 2000 global companies1. A well-defined set of criteria and weightings is used for company selection. They evaluate the opportunities and risks faced by those companies based on criteria that are weighted approximately equally for economic, environmental, and social performance. The firms selected for the index announce their inclusion on their corporate websites and include the Dow Jones Sustainability Index symbol on their promotional material. Thus, despite the numerous requirements for information and the costs associated with completing the survey, companies see the DJSI label as an important mechanism in establishing a. 政 治 大 Institutional investors are increasingly relying on these socially indexes to create 立 reputation for sustainability.. portfolios. According to the DJSI webpage, currently 80 DJSI licenses are held by. ‧ 國. 學. asset managers in 16 countries to manage a variety of financial products including. ‧. active and passive funds, equity baskets and warrants. In total, these licensees. sit. y. Nat. presently manage close to 8 billion USD based on the DJSI 1. By being included on. io. er. the Dow Jones Sustainability Index, companies also become eligible for inclusion in other socially responsible investment funds. Given that the number of SRI investors is. al. n. v i n increasing, being identified as aC sustainable company U h e n g c h i in the social index is seen as important for attracting investors. Motivation. While customers, employees, suppliers, community groups, governments, and some shareholders have encouraged firms to undertake additional investments in corporate social responsibility, many companies often express their corporate concerns on whether investors are aware of their corporate sustainable decisions, understand their actions and are able to evaluate their progress and competitive positioning (Ivan 1. Sources from DJSI website, http://www.sustainability-index.com/default.html 9.
(11) Montiel 2008). If financial markets do not value their efforts on corporate sustainability, they would not have proper incentive to become or continue to be corporate sustainable company. Therefore, my thesis is to responds to the increasing interest in the relationship between corporate social responsibility initiatives and the change in market value of American companies added to or dropped from the social index. Thesis Objective and Investigation. 政 治 大 social responsibility, the Dow Jones Sustainability Index, while tracking and 立. I investigate this topic by using one of the most prominent stock market indexes of. evaluating the impact of events - of inclusion and deletion from the index – to the. ‧ 國. 學. financial market. Using inclusion on DJSI as a signal of a company’s reputation for. ‧. being a sustainable company, we investigate whether being added to or dropped from. sit. y. Nat. the DJSI results in a significant change to the market value of an American company.. io. er. If stakeholders value sustainability practices, then inclusion on a sustainable index should be associated with a positive increase in value, and vice versa. I assume that. al. n. v i n investors do track these sociallyC responsible companies h e n g c h i Uand the indices and any. substantial deviation or change announcement in the index are reflected in the stock price movements in the capital market. Employing an event study analysis during 2002-2009 2 I measure the financial investors’ perception and expectation and test about the effect of entry/exit from the social index thus provide evidence on the CSR-corporate performance nexus. My thesis explores whether inclusion on the DJSI is a goal that firms should pursue. Our evidence portrays a significant share price rising trend in cumulative abnormal 2. The website of DJSWI does not provide any information in relation to the index inclusions and. exclusions prior to 2002, and it’s only updated to 2009. 10.
(12) returns (CAR) of the samples under the addition situation. However, there is an insignificant negative stock market reaction while firms are removed from the DJSI. We can draw from the results that, at the very least, adopting CSR doesn’t deteriorate the value of the firms. Our results suggest that the benefits of being included on the DJSI outweigh or are equal to the costs associated with applying. Thesis structure The rest of my thesis is organized as follows. In the second section, I briefly. 政 治 大 and the shift of focus hypothesis. In the third section, I report data from Dow Jones 立. summarize the key empirical literature, mainly focus on the social impact hypothesis. Sustainability Index, propensity score matching (PSM) methodology (Rosenbaum &. ‧ 國. 學. Rubin, 1985) and research findings. The final section concludes the thesis.. ‧. n. er. io. sit. y. Nat. al. Ch. engchi. 11. i n U. v.
(13) Chapter 2: Literature Review. Stock valuation influenced by social index entry/exit Stock market prices should reflect the fundamental expected value of the stock, i.e. the discounted sum of the expected dividends accruing to the owners of shares. When investors are rational and fully informed, expected values are instantaneously revised upon news’ arrivals if the announcement refers to an event affecting one or more. 政 治 大 interest rates, risk premium,立 stock betas, etc.). In this perspective the impact of events factors determining the fundamental value of the stock (expected future cash flows,. ‧ 國. 學. such as entries or exits from Dow Jones Sustainability Index should be predicted based on a theoretical framework which evaluates the impact of the event itself on the. ‧. different components of the formula of the fundamental value of the stock.. sit. y. Nat. A crucial issue to consider when formulating our hypothesis on the effects of the. n. al. er. io. announcement of an event related to the CSR choice is therefore the investigation of. i n U. v. the nexus between corporate social responsibility and corporate performance and,. Ch. engchi. more specifically, in our case, the specific criterion of corporate performance represented by shareholder’s value. Social impact hypothesis supporting positive effects of CSR Two prominent conflicting theories academically dominate the topic regarding the financial impacts of CSR. The social impact hypothesis, which is proposed by Preston and O’Bannon, claims positive association between CSR and financial performance (Preston & O’Bannon, 1997). Several reasons could explain this positive effects, such as the public acknowledgement of the firm’s CSR enhances its overall reputation and 12.
(14) image (Dutton & Dukerich, 1991) and brand image and product competitiveness (C. J. Fombrun & Gardberg, 2000). The CSR choice may also have positive effects on market value by enhancing workers productivity. The importance of intrinsic motivations of workers in productivity, and the availability of workers to accept lower wages or even voluntary work when intrinsic motivations are strong, suggests that the latter are partial substitutes for pecuniary transfers. Intrinsic motivations are therefore a channel through which corporate social responsibility, by fostering alignment between corporate goals and workers’ motivations, may reduce costs and increase. 政 治 大 productivity (Frey & Oberholzer-Gee, 1997). 立. productivity. On the relationship between workers’ intrinsic motivation and. As several scholars have shown, empirical attempts to capture this relationship have. ‧ 國. 學. produced complicated and inconclusive results as well. Supporters of social impact. ‧. hypothesis, such as Waddock and Graves (1997) employ reputation ratings developed. sit. y. Nat. by Kinder, Lydenberg and Domini (KLD) 3 as the proxy of CSR and found that past. io. er. and current KLD ratings are positively related to subsequent firm performance. Ruf et al. (2001) claims that change in CSR is positively associated with growth in sales and. al. n. v i n C h with CSR forUthree financial periods. returns on sales are positively associated engchi. Consider that many of these papers find evidence of a positive effect on economic and not on financial performance (with the exception of Preston & O’Bannon, 1997). Hence, the corporate CSR choice may be beneficial in terms of net sales or value added per worker, but not necessarily in terms of shareholder’s value. Shift of focus hypothesis viewing the opposite of CSR On the negative side, the shift of focus hypothesis, suggested by Becchetti, Ciciretti 3. Kinder, Lydenberg and Domini Research & Analytics, Inc. (KLD), is a leading research group in. providing ratings of corporate social performance to investors. 13.
(15) and Hasan (2007), argue that most of the CSR activities such as building employee and community relationship, providing environmental protection and improving corporate governance causes a shift of focus from the maximization of stockholders’ value to the interests of a wider set of stakeholders and thereby increasing the firm’s costs. Jensen and Meckling (1976), Bertrand and Mullainathan (2003) argued that managers might prefer to submit to employee demands for higher pay because higher pay fosters a more pleasant working environment for the managers, even though the money comes from the pockets of shareholders, who gain nothing from the pay. 政 治 大 managers, are willing to engage in socially responsible actions whose costs exceed the 立 increase. Barnea and Rubin (2006) suggested that company insiders, such as. benefits to shareholders because they reap private benefits, such as awards and other. ‧ 國. 學. expressions of appreciation, from those promoting social responsibility. The excess of. ‧. costs over benefits is reflected in low returns to shareholders. The empirical support. sit. y. Nat. for their argument in evidence is that insiders in companies that rank high on social. io. er. responsibility hold relatively small portions of their company’s shares and thus bear relatively little of the cost of the accolades they receive for their socially responsible. al. n. v i n actions. Particularly noteworthyC is the lack of public responsiveness to philanthropic hengchi U. behavior as well as the insignificant feedback effect on financial performance (Walley & Whitehead, 1994). Hence, firms having higher social awareness result in worse financial performance. The shift of focus hypothesis also receives substantial supports. Newgren et al. (1985) find that those firms with environmental assessment have inferior stock market returns. Brammer et al. (2005) examine the relationship between stock returns and CSR score, proxied by the composite indicator constructed from environment protection, community relationship and financial transparency. They find that CSR scores on composite indicator are significantly negatively related to stock returns. 14.
(16) Literature on social index deletion or addition To date there has been little research that addresses whether inclusion on such indices serves as a credible signal to shareholders regarding a company’s sustainability. Curran and Moran (2007) test whether inclusion in, or deletion from, the FTSE4Good Index results in a positive (negative) impact on share price. Their results show only minor evidence of any significant effect due to being added to or deleted from the index. This may be explained by the fact that the FTSE4Good Index also uses market. 政 治 大 change to a company’s social responsibility practices. The other paper closely related 立. capitalization as a screen, and hence changes to the index do not necessarily indicate a. to my thesis is Karlsson and Chakarova (2008), whose research uses inclusions and. ‧ 國. 學. exclusions from nine countries including the US. However, Karlsson and Chakarova. ‧. (2008) show that both index exclusions and inclusions do not generate significant. sit. y. Nat. abnormal returns in the overall sample, even though they observe differences in. io. er. market reactions when decomposing the sample across different markets. My thesis takes a different approach comparing to others. First, as a means of. al. n. v i n overcoming firm heterogeneity C a propensity score matching h e n g c h i U (PSM) pairs design is. employed to ensure greater homogeneity between adding-in firms, delete-out firms and S&P500 portfolios. Propensity score matching (PSM) not only resolves the traditional matching method problems as it reduces multi-dimension matching to only one dimension matching (Rosenbaum & Rubin, 1985), but also overcome the selection bias problem (Rubin & Thomas, 1992). Secondly, by looking into how stock markets respond to these index inclusion (or index exclusion) events it can provide direct answer to the question of whether or not investors care about corporate sustainability.. 15.
(17) Proposed Hypothesis I build on the literature cited above by testing whether there are significant impacts on the value of American firms associated with the shareholder effects of being added to, or deleted from the Dow Jones Sustainability Index. By considering the above mentioned theoretical and empirical considerations I expect different, and potentially conflicting, effects of addition and deletion from the DJSI. If the shift of focus hypothesis holds (and the cost increasing dominate over the cost decreasing effects), I. 政 治 大 announcement. If, on the other hand, the social impact hypothesis holds, then the 立. should expect a negative (positive) abnormal return in case of an addition (deletion). expected returns of socially responsible stocks should be higher than those of. ‧ 國. 學. conventional stocks. I also consider the growing volume of financial assets. ‧. intermediated by socially responsible funds and I take into account that a relevant part. sit. y. Nat. of them follows the passive strategy of tracking a social index, then I would expect. io. al. n. (addition) announcement.. er. the opposite effect of a negative (positive) abnormal return in case of a deletion. Ch. engchi. 16. i n U. v.
(18) Chapter 3: Data and Methodology. Data and choice of analysis period To examine the question of whether the capital markets view being included on the DJSI as a credible signal of sustainability thus adding value to companies, I measure the stock market reaction to the announcement that American firms were added to, or deleted from, the DJSI over the period 2002-2009. Obtained from DJSI website,. 政 治 大 index changes as well as information 立 about the number of American firms that were. Table1 provides summary data about the announcement and effective dates for DJSI. ‧ 國. 學. added or deleted in each year. Otherwise, I use S&P500 firms to pair-match with these added and deleted firms. That is to say, S&P500 companies are used as control. ‧. group. Firms are matched using data from CompuStat database with all numbers. n. al. Ch. engchi. er. io. Matching methods: propensity score matching. sit. y. Nat. being denominated in US dollars.. i n U. v. An alternative to the regression approach is to use matched pairs of firms to examine if there is a market performance differential between firms with the same scores. Traditionally, researchers attempt to isolate the variable of interest by matching firms based on other characteristics that also drive the dependent variable. Following the work of Fama and French (1993) matching is often done on the basis of size and book to market ratio. Control firms are sorted into bins based on size and then further subdivided based on their book-to-market ratio. Each firm in the treatment group is then matched to the firm whose characteristics more closely match its own. The difficulty with this approach is that it is sensitive to the order in which the matching is 17.
(19) Table 1: Changes in USA Stocks in the Dow Jones Sustainability Index (DJSI) from 2002-2009 (Include the overlapped ones, existing both in Additions and Deletions list) Announcement Year. Effective Date. Additions Deletions Date 14. 28. September 4. September 23. 2003. 13. 10. September 4. September 22. 2004. 8. 8. September 2. September 20. 2005. 15. 14. September 7. September 19. 2006. 10. September 18. 2007. 10 立. 治 17 September 6 政 大. 2009. September 6. 5. 7. September 4. 4. 6. September 3. 79. 103. September 24 September 22 September 21. ‧. TOTAL. 13. 學. 2008. ‧ 國. 2002. y. Nat. sit. done and the number of criteria used. In order to minimize the likelihood of. n. al. er. io. mismatching firms confounding the results, we use propensity scoring as the method. i n U. v. for matching. A propensity score is the conditional probability of assignment to a. Ch. engchi. particular treatment given a vector of observed covariates.. Starting with a Probit regression to obtain the estimated propensity score Pr (Di = 1|Xi) for all separating 2 firm groups, which are denoted as Pi and Pj, respectively. The predicted probability is used as the single matching criterion between the treatment group and the control group. Propensity score matching is done by sampling from a large reservoir of potential firms (the controls) and finds those whose characteristics lead to them having the same propensity score as the firm in the treatment group. The advantage of this method is that it produces matched pairs that are similar on multiple dimensions. Our methodology is as follows: First, we calculate the propensity score 18.
(20) for all firms. Then, we sort both the treatment group and the control group by the propensity score. We start with the first firm in the treatment group and match it with the first firm in the control group whose propensity score matches to four significant digits. If more than one control firm is a potential match, a random number generator selects the control firm. Both the treatment and the control firm are then placed in a file of matched firms, so no control is matched to more than one treatment firm. If no control firm matches to four significant digits, the treatment firm is not matched and the selection process moves to the next firm. Matching continues until all treatment. 政 治 大 be identical after matching. I conduct all the statistics results on the platform of 立. firms have been matched or discarded. We expect the two sets of control variables to. software STATA10.. ‧ 國. 學. Two criteria are often suggested in the literature to find the approximation. Here in. ‧. this thesis we apply the Nearest-Neighbor Matching (Nearest hereafter), which. sit. y. Nat. matches each treatment sample with the control sample such that the difference of the. io. n. al. C(Pi ) = min�Pi − Pj �. Ch. j. engchi. er. two is minimized. That is,. i n U. v. where C(Pi) is a set of control units matched with the treated unit i, i.e., samples that. has the nearest propensity score with added firm i. The second criterion is the caliper matching (Caliper hereafter), which requires the two groups to be not too distant. That is, it requires the propensity score of the added-firm (deleted-firm) and S&P500-firm to fall within a prespecified caliper. That is, C(Pi ) = �Pi − Pj � < 𝜂. where η is a very small number and is specified as quarter of standard error of estimated propensity scores for all added-firms (deleted-firms) and S&P500-firms. 19.
(21) Note that under this criterion, the number of control samples contained in C(Pi) is arbitrary, from zero to all control samples. Confirmation of matching result Once the matching S&P500 firms are selected, we could verify the matching by performing the following test: This test examines the null hypothesis of , where. are average of characteristic variables of treated. firm i and control firm j, respectively. The two groups have the same characteristics if the null is not rejected.. 立. 政 治 大. Regression analysis to estimate the treatment result. ‧ 國. 學. Our independent variables are asset, financial leverage, ROE, industries and year,. ‧. explained in detail in the following and also showing in Table 2.. Asset: Asset can be interpreted as scale, Fombrun and Shanley (1990) pointed. sit. y. Nat. . n. al. er. io. out that the larger the scale, the more the attention that a company attracts from. i n U. v. the public. Thus, the response from its philanthropic activities is noticeable.. Ch. engchi. Scale is often considered as a crucial characteristic variable and its effect on the probability of adopting CSR is positive. . Financial leverage: Return on Average Equity divided by Return on Average Assets. The firm's default risk as measured by financial leverage would affect the cumulative abnormal return (DHALIWAL, LEE, & FARGHER, 1991).. . ROE: McGuire et al. (1988) proposed the available funds theory to argue that firms with abundant resources have more ability to engage in CSR activities. Posner and Schmidt (1992), on the contrary, prove that firms with earn sufficient profits could have egocentric behaviors without fear of being challenged for not 20.
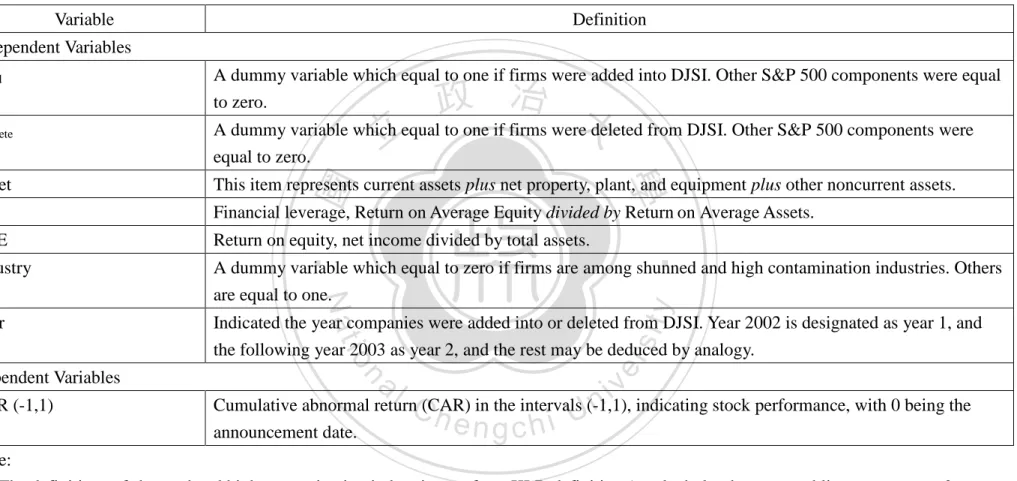
(22) Table 2: Abbreviation and definition of dependent and independent variables Variable. Definition. Independent Variables. Ddelete. A dummy variable which equal to one if firms were added into DJSI. Other S&P 500 components were equal to zero.. 政 治 大 A dummy variable which equal to one if firms were deleted from DJSI. Other S&P 500 components were 立 equal to zero.. 學. ‧ 國. Dadd. This item represents current assets plus net property, plant, and equipment plus other noncurrent assets.. FL. Financial leverage, Return on Average Equity divided by Return on Average Assets.. ROE. Return on equity, net income divided by total assets.. Industry. A dummy variable which equal to zero if firms are among shunned and high contamination industries. Others are equal to one.. Year. Indicated the year companies were added into or deleted from DJSI. Year 2002 is designated as year 1, and the following year 2003 as year 2, and the rest may be deduced by analogy.. sit. n. al. er. io. CAR (-1,1). y. Nat. Dependent Variables. ‧. Asset. Ch. i n U. v. Cumulative abnormal return (CAR) in the intervals (-1,1), indicating stock performance, with 0 being the announcement date.. engchi. Note: 1. The definitions of shunned and high contamination industries are from KLD definition (ex alcohol, tobacco, gambling, armaments & firearms and adult entertainment) and Cowen et al., respectively. 2. These independent and dependent variables are acquired from Compustat database.. 21.
(23) noticing the interests of the public. ROE’s effect toward inclusion in or exclusion from the index is uncertain, and we hope to find the relationship in between. . Industry: A dummy variable which equal to zero if firms are among shunned and high contamination industries. Others are equal to one. In our study, shunned companies are those that KLD classifies as associated with at least one of the following: tobacco, alcohol, gambling, firearms, military, or nuclear operations. Similar to Cowen et al. (1987), the chemical (SIC code 28xx, excluding pharmaceutical firms, code 283x), metals (33xx), paper (26xx), and petroleum. 政 治 大 such companies violate social norms, and some socially responsible indices 立. (2911) industries are defined as more environmentally sensitive. The activities of. avoid such stocks even if they yield higher returns than stocks in other industries.. ‧ 國. 學. We set this variable to explore the relationship between DJSI and CSR. ‧. controversial companies, and it can also serves as a control for various kinds of. y. sit. Year: Indicated the year companies were added into or deleted from DJSI. Year. io. er. . Nat. industries involved in DJSI.. 2002 is designated as year 1, and the following year 2003 as year 2, and the rest. al. n. v i n CThis may be deduced by analogy. variable is resulted from the h econtrol ngchi U. insufficient samples we can collect within each year, therefore, we pool all the samples together and designate each a “year” variable. Once obtaining the estimated propensity score Pr (Di = 1|Xi) for all firms, our objective is to find the S&P500 firms whose propensity scores are sufficiently close to those of added firms or deleted firms by applying the nearest-neighbor and Caliper matching method. Finally, I employ the regression analysis with Dadd and Ddelete dummy variable to examine the differences of market performances between three groups of firms. The regression model is 22.
(24) Cumulative abnormal return (CAR) = α+βDadd + ε Where Dadd are dummy variables which equal to one if firms were added into DJSI. Other S&P 500 components were equal to zero.α, β and ε are coefficients to be estimated, and ε is error term. Estimated β captures the effect on firms’ market performance of being philanthropic. A significant positive β suggests that added firms have better market performance than S&P500 firms, supporting the social impact hypothesis, whereas a significant negative β supports the shift of focus hypothesis. The opposite interpretation would be applied if Ddelete is substituted in the above. 政 治 大 deleted from DJSI. Companies assigned with D also represent a better sustainability 立 equation. Ddelete is the other dummy variable which equal to one if the firm was add. than those assigned with Ddelete... ‧ 國. 學. We use cumulative abnormal return as the proxy for market performance because. ‧. index inclusion and index exclusion may affect market performance in the way of. sit. y. Nat. abnormal stock returns. This methodology computes the abnormal return on each. io. er. added and deleted stock, equal to the return on the stock minus the return on major national index (the S&P 500 in the US), during every day in an announcement event. n. al. i n window that includes three daysC (Day -1 until Day +1). hengchi U. v. As already observed, one of the main limits of all the above mentioned analyses based on accounting data is the difficulty of controlling for endogeneity. In the CSR-corporate performance relationship the problem is particularly severe as it is important to discern, for instance, in case of positive relationship, whether the move to CSR is an autonomous driver of improvement in corporate performance or, quite to the opposite, high cash flow and better performing firms are more likely to choose CSR, due to their higher cash flow availability. A second, almost insurmountable, limit is that accounting based analyses on the CSR-corporate performance nexus do not provide a risk adjusted measure of performance. 23.
(25) The two advantages of investigating the impact of CSR on corporate performance in financial markets are stated as followed. By calculating cumulative abnormal returns at the announcement date, we pick up the expected net effect of entry into/exit from CSR and hence separate the effect of change in CSR on corporate performance from the reverse causality effect. Furthermore, we may calculate it net of measurable risk factors.. 立. 政 治 大. ‧. ‧ 國. 學. n. er. io. sit. y. Nat. al. Ch. engchi. 24. i n U. v.
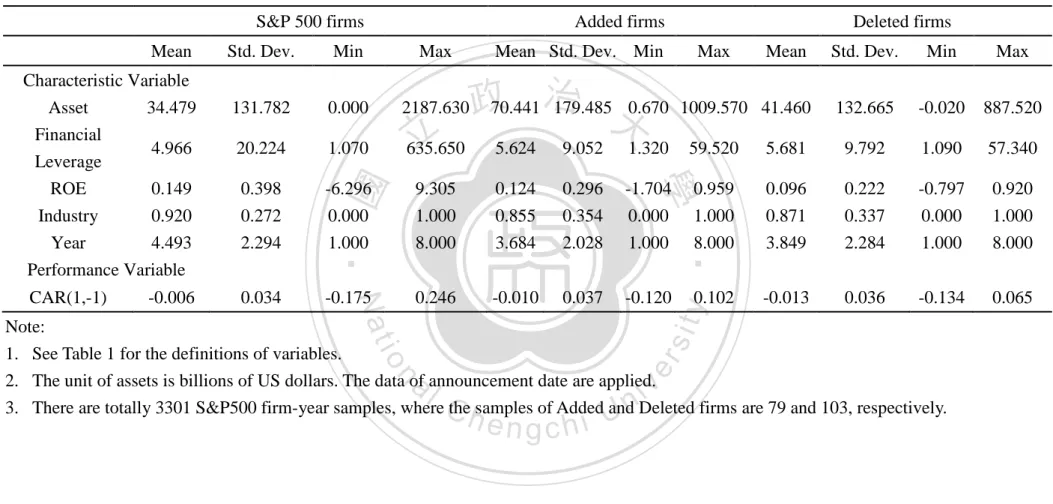
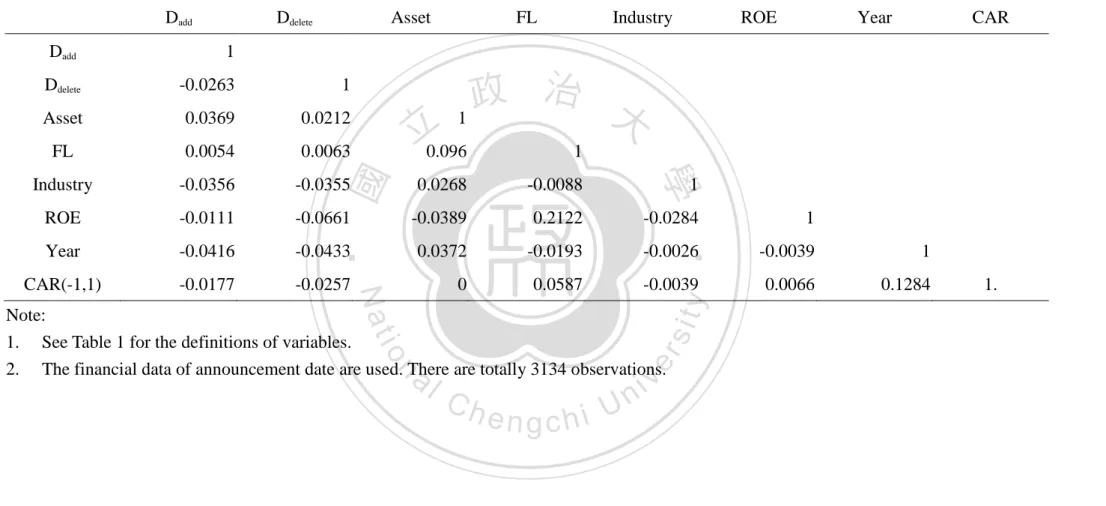
(26) Chapter 4: Empirical Results Basic statistics before matching Our samples of S&P 500, added to and deleted from DJSI firms are 3301, 79 and 103 firm-years, respectively. Table3 reports basic statistics of the independent and dependent variables. Based on samples before the matching, added-firms tend to have larger Asset and ROE, but lower financial leverage. For instance, the average ASSET and ROE of added and before-matching deleted firms are (70.44, 41.46) and (12.4%,. 政 治 大 leverage, respectively. With 立respect to the market performance variables, the average 9.6%) billion US dollars, respectively; but they are 5.68 and 5.62 for the financial. ‧ 國. 學. cumulative abnormal return (CAR) of S&P500, added and deleted firms are -0.6%, -1.3%, and -1.0%, respectively. The results from basic statistics suggest that. ‧. added-firms perform better than deleted-firms before-matching, especially on the. sit. y. Nat. accounting performance. However, when it comes to market performances S&P500. n. al. er. io. firms have the best results. According to Table3, the shunned and high-contaminated. i n U. v. companies seem to have the tendency to enter and exit from the social index more. Ch. engchi. frequently. The data shows as well that it’s more possible for companies to be added or deleted from the social index in the earlier years than recent years. Table4 reports correlation matrix of accounting and market performance variables and dummy variable. For instances, dummy variable Dadd, , which equal to one if given sample is belong to added firms and equal to zero if it’s a S&P500 firm. The same principle can be applied to Ddelete, indicating those deleted firms if equal to one. From the first and second column we observe that, first, the correlation coefficient between Dadd and Ddelete is -0.0263. This number is close to zero because the large amounts of S&P500 firms are presented in samples, and they are all designated with the value 25.
(27) Table 3: Basic statistics of S&P500 Samples, samples of additions and deletions S&P 500 firms Std. Dev.. Min. Max. 34.479. 131.782. 0.000. 2187.630. 4.966. 20.224. 1.070. 635.650. 5.624. 9.052. 1.320. 0.149. 0.398. -6.296. 9.305. 0.124. 0.296. -1.704. Industry 0.920 Year 4.493 Performance Variable. 0.272 2.294. 0.000 1.000. 1.000 8.000. 0.855 3.684. 0.354 2.028. 0.000 1.000. CAR(1,-1). 0.034. -0.175. 0.246. -0.010. 0.037. -0.120. Characteristic Variable. Mean. Std. Dev.. Min. Max. 1009.570 41.460. 132.665. -0.020. 887.520. 5.681. 9.792. 1.090. 57.340. 0.959. 0.096. 0.222. -0.797. 0.920. 1.000 8.000. 0.871 3.849. 0.337 2.284. 0.000 1.000. 1.000 8.000. 0.102. -0.013. 0.036. -0.134. 0.065. 59.520. sit. ‧ 國. 政70.441 治 179.485 0.670 大. Max. ‧. Nat. -0.006. 立. Mean Std. Dev. Min. 學. Asset Financial Leverage ROE. Deleted firms. y. Mean. Added firms. n. al. er. io. Note: 1. See Table 1 for the definitions of variables. 2. The unit of assets is billions of US dollars. The data of announcement date are applied. 3. There are totally 3301 S&P500 firm-year samples, where the samples of Added and Deleted firms are 79 and 103, respectively.. Ch. engchi. 26. i n U. v.
(28) Table 4: Matrix of correlation coefficient Dadd. Ddelete. Asset. 1. Ddelete. -0.0263. 1. Asset. 0.0369. 0.0212. FL. 0.0054. 0.0063. Industry. -0.0356. ROE. Industry. ROE. Year. CAR. 政 治 大 1 1. -0.0355. 0.0268. -0.0088. -0.0111. -0.0661. -0.0389. 0.2122. -0.0284. Year. -0.0416. -0.0433. 0.0372. -0.0193. -0.0026. -0.0039. 1. CAR(-1,1). -0.0177. -0.0257. 0. 0.0587. -0.0039. 0.0066. 0.1284. 1. Nat. sit. n. al. er. io. Note: 1. See Table 1 for the definitions of variables. 2. The financial data of announcement date are used. There are totally 3134 observations.. y. ‧. ‧ 國. 立0.096. 學. Dadd. FL. Ch. engchi. 27. i n U. v. 1. 1..
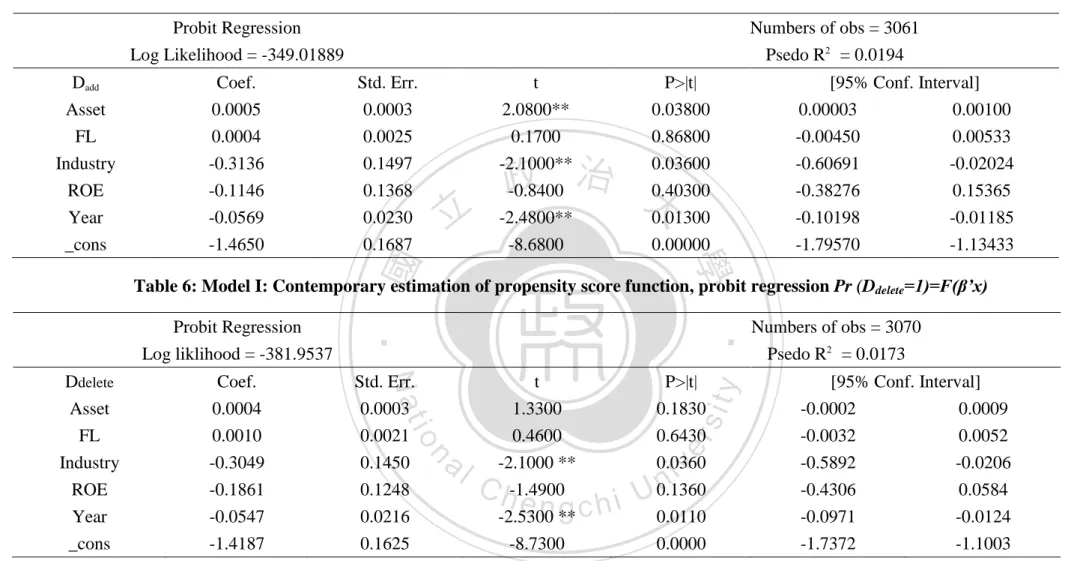
(29) zero. Secondly, Asset and Dadd and Ddelete are 0.0369 and 0.0212, in line with the results we present in Table3. For financial leverage and industry, coefficient is relatively the same for both. With the respect of ROE, though both numbers are negative, the correlation coefficient between Dadd and ROE is much bigger than that of Ddelete and ROE. Thus, added-firms tend to have larger scale and higher ROE than deleted-firms. Thirdly, the correlation coefficients between Dadd, Ddelete and cumulative abnormal return are both slightly negative, for examples, the correlation coefficients between Dadd and CAR(-1,1), between Ddelete and CAR(-1,1) are -0.0177. 政 治 大 outperform deleted-firms using before matching data, we observe that there is also 立. and -0.0257, respectively. Although one tends to conclude that added-firms slightly. systematic divergence of independent variables between two groups of firms, at least. ‧ 國. 學. on average. We cannot attribute performance difference solely to firms’ engaging to. ‧. philanthropic activities and have to fix the differences in characteristics and get purer. sit. y. Nat. identifiable effect on market performance of firms entering DJSI, that’s the market. io. difference in characteristics between them.. n. al. Ch. Basic statistics after matching. engchi. er. performance difference between added- and deleted-firms at least not duo to. i n U. v. Table 5 presents the estimated results of propensity score function (PSF) by Probit model. We employ two models to examine the robustness. For Model I with Dadd, contemporary characteristic variables are used to estimate PSF, and we observe that coefficients for Asset is significantly positive, suggesting that firms with large asset tend to be selected into DJSI. The coefficient for ROE is negative but insignificantly negative. As for Ddelete, the results are much the same, yet with smaller insignificant Asset and ROE. Companies are inclined to be deleted from DJSI with higher financial leverage, which may indicates DJSI review the index components by applying the risk criteria; on the contrary, a lower financial risk may 28.
(30) Table 5: Model I: Contemporary estimation of propensity score function, probit regression Pr (Dadd=1)=F(β’x) Numbers of obs = 3061. Log Likelihood = -349.01889. Psedo R2 = 0.0194. Coef. 0.0005 0.0004 -0.3136 -0.1146 -0.0569 -1.4650. Std. Err. 0.0003 0.0025 0.1497 0.1368 0.0230 0.1687. 立. t 2.0800** 0.1700 -2.1000** -0.8400 -2.4800** -8.6800. P>|t| 0.03800 0.86800 0.03600 0.40300 0.01300 0.00000. 政 治 大. [95% Conf. Interval] 0.00003 0.00100 -0.00450 0.00533 -0.60691 -0.02024 -0.38276 0.15365 -0.10198 -0.01185 -1.79570 -1.13433. 學. Log liklihood = -381.9537. ‧ 國. Dadd Asset FL Industry ROE Year _cons. Probit Regression. Coef.. Std. Err.. t. P>|t|. 0.0004 0.0010 -0.3049 -0.1861 -0.0547 -1.4187. 0.0003 0.0021 0.1450 0.1248 0.0216 0.1625. 1.3300 0.4600 -2.1000 ** -1.4900 -2.5300 ** -8.7300. 0.1830 0.6430 0.0360 0.1360 0.0110 0.0000. Table 6: Model I: Contemporary estimation of propensity score function, probit regression Pr (Ddelete=1)=F(β’x). n. Ch. engchi. y. sit. io. al. er. Nat. Ddelete Asset FL Industry ROE Year _cons. ‧. Probit Regression. i n U. v. Numbers of obs = 3070 Psedo R2 = 0.0173 [95% Conf. Interval] -0.0002 -0.0032 -0.5892 -0.4306 -0.0971 -1.7372. The t-statistics are given here, and ***,**and * denotes the significance at the 1%, 5%, and 10% level, respectively.. 29. 0.0009 0.0052 -0.0206 0.0584 -0.0124 -1.1003.
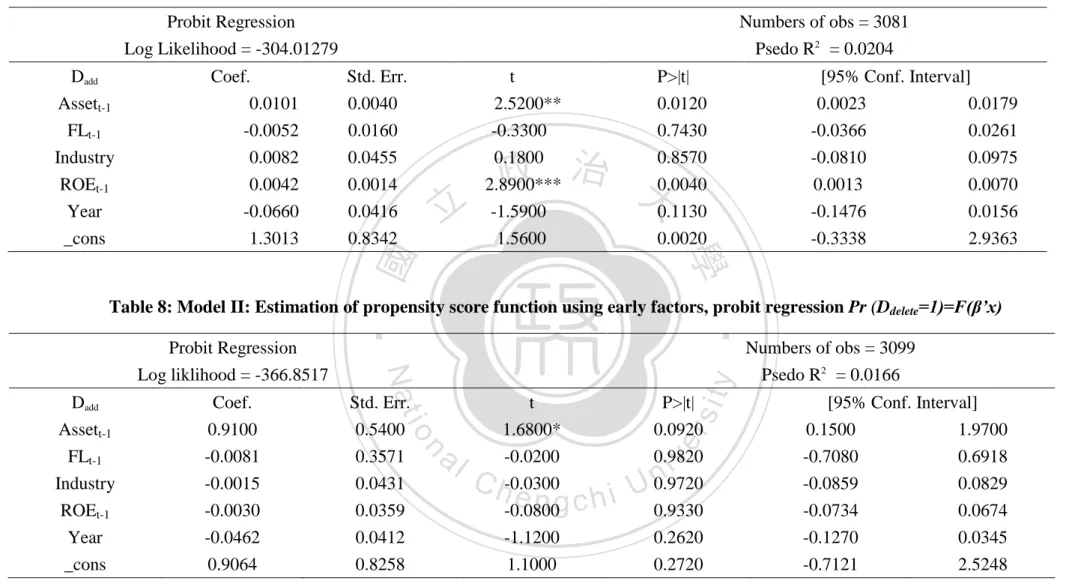
(31) characterize the added firms. We also found that those companies related with shunned behaviors and high contaminations are easier to be presented in Dow Jones Sustainability Index than their counterparts, which could be possible due to a compensation mindset for pollutions which they caused. However, their CSR performances don’t seem to be stable or durable, because their coefficient between Ddelete and industry is also significantly negative. Finally, the correlations between year and both dummies are both significantly negative, in line with the results of Table1. This fact suggests that the phenomenon of higher turnover exists in DJSI. 政 治 大 was just constructed in those starting years. Though there are some high correlation 立. components in early years, which could attribute to instability when the social index. coefficients between each two independent variables, as we discussed earlier, the. ‧ 國. 學. PSM is not the model of choosing determinants of CSR, but is to reduce the. ‧. dimensions.. sit. y. Nat. I use model I as our benchmark model to estimate propensity score function, that’s the. io. er. timing of explanatory variables are all contemporaneous. One may concern that whether earlier characteristics affect the probability of being added to or deleted from. al. n. v i n the social index, for example, a C firms with large earning h e n g c h i U this period could engage. more in CSR activities in the next period because they have more available funds, suggested by McGuire et al. (1988) and Moore (2001). Thus, we also consider earlier factors, such as, Assett-1, ROE, and FLt-1 as explanatory variables to replace. contemporary ones to establish model II. Since the estimated results of PSF as roughly the same with results of model I (See Table 7 and 8), it confirms with the robustness we previously discussed. Based on estimation results of PSF by model I, we obtain propensity score for each sample of firm. Thus, we can select the samples based on the nearest-neighbor matching methods. Table9 compares the means of independent variables between two 30.
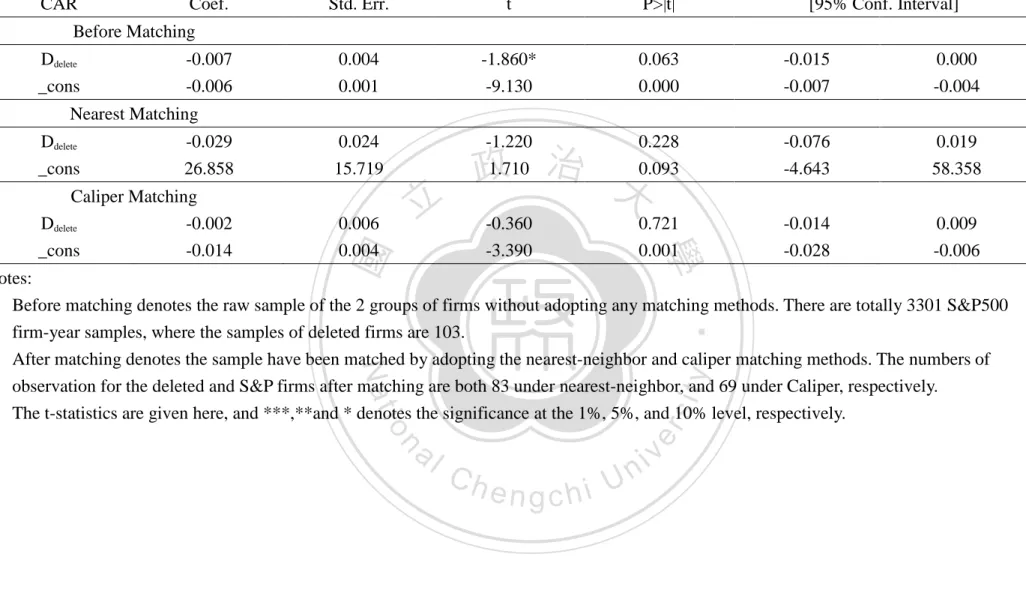
(32) groups based on before- and after-matching samples. Unlike those in Table3 where the whole sample of S&P500, added firm and deleted firms are used, we only employ matched samples here. It is not surprising that, after nearest-neighbor matching, the average of each two pairs become approximately equal. In order to illustrate this, five characteristic variables between added and after-matching S&P500-firms become approximately equal because the differences in their means are insignificant according to t-statistics results. While in the situation between deleted and after matching S&P500 enterprises, significant differences exist in Asset, but not in the remaining. 政 治 大 meaningful only when the characteristic variables are close to each other. It is worth 立 four variables. As mentioned earlier, the comparison of market performance is. noting that the observations of after-matching S&P500 companies still retain 76 and. ‧ 國. 學. 83 in each case. They don’t lose much of the degree of freedom like applying other. ‧. method such as Mahala Caliper in propensity score matching (Shen & Chang, 2009).. sit. y. Nat. Market performance comparisons. io. er. Table10 presents the estimated results of regression analysis between dummy variable Dadd and cumulative abnormal return, and Table11 likewise shows the relationship. al. n. v i n C h Employing theUsample before matching, the and market performance. engchi. between Ddelete. estimated coefficients of both dummies are negative but only Ddelete is significantly negative. Thus, before matching, one may conclude that relations with DJSI could have negative impacts to market performances of CSR stocks no matter it’s in. addition or deletion situation. In particular, passive socially responsible investments (SRI) funds could sell the deleted stocks while exits events regarding with violation of ethical criteria and cause the significantly inferior market performances. The results changed when the after matching samples are used. First, when nearest-neighbor matching is used, the estimated coefficient of Dadd and CAR becomes insignificantly positive, while the estimated coefficient of Ddelete maintains insignificantly negative. 31.
(33) Table 7: Model II: Estimation of propensity score function using early factors, probit regression Pr (Dadd=1)=F(β’x) Numbers of obs = 3081. Log Likelihood = -304.01279. Psedo R2 = 0.0204. Coef. 0.0101 -0.0052 0.0082 0.0042 -0.0660 1.3013. Std. Err. 0.0040 0.0160 0.0455 0.0014 0.0416 0.8342. 立. t 2.5200** -0.3300 0.1800 2.8900*** -1.5900 1.5600. P>|t| 0.0120 0.7430 0.8570 0.0040 0.1130 0.0020. 政 治 大. [95% Conf. Interval] 0.0023 0.0179 -0.0366 0.0261 -0.0810 0.0975 0.0013 0.0070 -0.1476 0.0156 -0.3338 2.9363. 學. ‧ 國. Dadd Assett-1 FLt-1 Industry ROEt-1 Year _cons. Probit Regression. al. t 1.6800* -0.0200 -0.0300 -0.0800 -1.1200 1.1000. Ch. engchi. 32. y. Psedo R2 = 0.0166. sit. Std. Err. 0.5400 0.3571 0.0431 0.0359 0.0412 0.8258. n. Coef. 0.9100 -0.0081 -0.0015 -0.0030 -0.0462 0.9064. io. Dadd Assett-1 FLt-1 Industry ROEt-1 Year _cons. Nat. Log liklihood = -366.8517. Numbers of obs = 3099. P>|t| 0.0920 0.9820 0.9720 0.9330 0.2620 0.2720. er. Probit Regression. ‧. Table 8: Model II: Estimation of propensity score function using early factors, probit regression Pr (Ddelete=1)=F(β’x). i n U. v. [95% Conf. Interval] 0.1500 1.9700 -0.7080 0.6918 -0.0859 0.0829 -0.0734 0.0674 -0.1270 0.0345 -0.7121 2.5248.
(34) Table 9: Descriptive statistics of independent variables: before- and after-matching samples Before Matching Added firms. S&P 500 firms. Differences (t-value). Deleted firm. S&P 500 firms. Differences (t-value). Asset. 70.441. 34.479. 35.962*(1.736). 41.460. 34.479. 6.981(0.500). FL. 5.624. 4.966. 0.658(0.597). 5.681. 4.966. 0.716(0.665). Industry. 0.124. 0.149. -0.025(-0.724). 0.096. 0.149. -0.053** (-2.219). ROE. 0.855. 0.920. 0.920. -0.049(-1.379). Year. 3.684. 4.493. 4.493. -0.644*** (-2.678). S&P 500 firms. Differences (t-value). 治 0.871 政 大 -0.809***(-3.425) 3.849 立 -0.064(-1.573). ‧ 國. 學. After matching (Nearest-neighbor matching). 4.216. Industry. 0.867. 0.8667. ROE. 0.124. 0.095. Year. 3.627. 3.587. 1.450(1.141). 5.752. 0(0.000). al. 0.866. 0.030(0.719). Ch 0.040(1.349). i n 3.621 U 0.117. engchi. 33. y. 5.666. 57.308. 24.582. 32.726*(1.845). sit. FL. 8.129(0.304). 4.683. 1.069(0.909). 0.854. 0.012(0.257). 0.122. -0.005(-0.166). 3.597. 0.024(0.498). er. 63.209. ‧. 71.338. Deleted firms. n. Asset. Differences (t-value). io. S&P 500 firms. Nat. Added firms. v.
(35) After matching (Caliper matching). Asset FL Industry ROE Year. Added firms. S&P 500 firms. Differences (t-value). Deleted firms. S&P 500 firms. Differences (t-value). 51.928 5.001 0.912 0.121 3.721. 48.357 4.046 0.912 0.132 3.589. 3.571(0.138) 0.955(0.813) 0(0.000) -0.011(-0.344) 0.132***(3.197). 29.197 4.764 0.905 0.119 3.784. 24.033 4.836 0.919 0.124 3.757. 5.164(0.758) 0.072(0.072) -0.014(-0.376) -0.005(-0.150). 立. 政 治 大. 0.027(0.575). ‧. ‧ 國. 學. Notes: 1. The numbers presented are means of S&P 500, added and deleted-firms, respectively and their differences. 2. Before matching denotes the raw sample of the 3 groups of firms without adopting any matching methods. There are totally 3301 S&P500 firm-year samples, where the samples of Added and Deleted firms are 79 and 103, respectively. 3. After matching denotes the sample have been matched by adopting the nearest-neighbor and caliper matching methods. The numbers of observation for the added and deleted firms after matching are 76 and 83 under nearest-neighbor, and 66 and 69 under Caliper, respectively. 4. The t-statistics are presented in parentheses.. n. er. io. sit. y. Nat. al. Ch. engchi. 34. i n U. v.
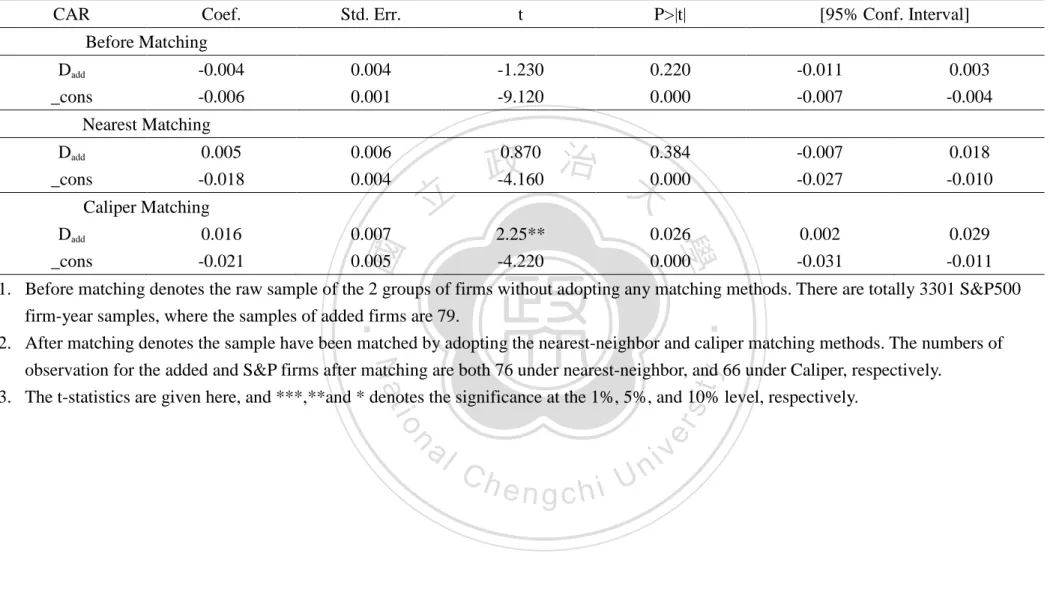
(36) Second, significantly higher CAR (2.25) for the added firms under the matching of Caliper is in contrast with the insignificant lower result (-0.36) of the estimated coefficient of the deleted firms. Since most part of estimated coefficients of Dadd dummy are positive and Ddelete are negative, it implies that added-firms have superior market performance CAR(-1,1) than deleted-firms. Hence, adding to social index is beneficial for the value of firms in US, thereby supporting the social impact hypothesis. My results suggest that companies’ value can be achieved through recognized by reputational social index. Applying for DJSI membership appears to be. 政 治 大 their business operations to shareholders. The increase in the firm’s market value may 立 a worthwhile investment when firms are seeking to demonstrate the sustainability of. be large enough to offset the considerable effort and cost on the part of the companies. ‧ 國. 學. that apply for inclusion on the DJSI.. ‧. n. er. io. sit. y. Nat. al. Ch. engchi. 35. i n U. v.
(37) Table 10: Performance regression of CAR (before- and after matching samples of added and S&P 500 firms) CAR = α + βDadd + ε CAR. Coef.. Std. Err.. t. P>|t|. [95% Conf. Interval]. 0.004 0.001. -1.230 -9.120. 0.220 0.000. -0.011 -0.007. 0.003 -0.004. 0.870 0.384 治 政 -4.160 大0.000. -0.007 -0.027. 0.018 -0.010. 0.002 -0.031. 0.029 -0.011. Before Matching Dadd _cons. -0.004 -0.006. Nearest Matching 0.006 0.004. Caliper Matching Dadd 0.016 _cons -0.021. 0.007 0.005. 立. 2.25** -4.220. 0.026 0.000. 學. 0.005 -0.018. ‧ 國. Dadd _cons. ‧. 1. Before matching denotes the raw sample of the 2 groups of firms without adopting any matching methods. There are totally 3301 S&P500 firm-year samples, where the samples of added firms are 79. 2. After matching denotes the sample have been matched by adopting the nearest-neighbor and caliper matching methods. The numbers of observation for the added and S&P firms after matching are both 76 under nearest-neighbor, and 66 under Caliper, respectively. 3. The t-statistics are given here, and ***,**and * denotes the significance at the 1%, 5%, and 10% level, respectively.. n. er. io. sit. y. Nat. al. Ch. engchi. 36. i n U. v.
(38) Table 11: Performance regression of CAR (before- and after matching samples of deleted and S&P 500 firms) CAR = α + βDdelete + ε CAR. Coef.. Std. Err.. t. P>|t|. [95% Conf. Interval]. 0.004 0.001. -1.860* -9.130. 0.063 0.000. -0.015 -0.007. 0.000 -0.004. -0.029 26.858. 0.024 15.719. -1.220 1.710. 0.228 0.093. -0.076 -4.643. 0.019 58.358. Caliper Matching Ddelete -0.002 _cons -0.014. 0.006 0.004. -0.360 -3.390. 0.721 0.001. -0.014 -0.028. 0.009 -0.006. Before Matching Ddelete _cons. -0.007 -0.006. Nearest Matching. 立. 政 治 大. 學. ‧ 國. Ddelete _cons. ‧. Notes: 1. Before matching denotes the raw sample of the 2 groups of firms without adopting any matching methods. There are totally 3301 S&P500 firm-year samples, where the samples of deleted firms are 103. 2. After matching denotes the sample have been matched by adopting the nearest-neighbor and caliper matching methods. The numbers of observation for the deleted and S&P firms after matching are both 83 under nearest-neighbor, and 69 under Caliper, respectively. 3. The t-statistics are given here, and ***,**and * denotes the significance at the 1%, 5%, and 10% level, respectively.. n. er. io. sit. y. Nat. al. Ch. engchi. 37. i n U. v.
(39) Chapter 5: Discussion and Conclusion Corporations are increasingly more involved in CSR activities however, with few notable exceptions discussed above, the finance literature lacks of significant empirical researches on this topic, especially from the perspectives of investors and capital market. Thus my thesis contributes to the literature by tracing the stock market reaction to entries and exits from an established social index. The attempt provides interesting insights on the impact of CSR on shareholders’ value. In the beginning, we adopt propensity matching theory to fix the characteristics of firms in. 政 治 大. two groups so as to remove the selection bias due to nonrandom assignment of samples. Two. 立. matching methods, nearest-neighbor and Caliper matching are used. Before matching, the. ‧ 國. 學. simple t-statistics show that both additions and deletions underperform the S&P500 stocks in cumulative abnormal return. As for our regression analysis results after. ‧. Caliper matching, index inclusion stocks experience a significant increase in stock. y. Nat. sit. returns while index exclusion stocks suffer from insignificant decrease in stock. n. al. er. io. returns. Similar results are presented under nearest-neighbor matching, yet neither. i n U. v. additions nor deletions are significant. Likely explanations for this value increase are. Ch. engchi. that investors use membership on the DJSI as a signal of higher expected returns for this firm and the DJSI label helps to attract new investors. On the contrary, exits events regarding with violation of ethical criteria should lead those passive socially responsible investments (SRI) funds to sell the deleted stocks and cause the market performances to drop. We draw on the final conclusion from the hypothesized positive feedback cycle showed in Graph1. To begin with, the companies with higher asset and ROE in previous years are prone to be engaged more in CSR activities. Therefore, they would be of larger possibilities to be selected as DJSI components. Once these firms become 38.
(40) a member on the DJSI, shareholders would value the firms’ sustainability conveyed by this signal and there is a positive stock market reaction. Later, firms with a good reputation for sustainability will be able to negotiate better terms of trade with all stakeholders (customers, suppliers, employees, etc.) because they are able to signal the quality of their products and services and their ability to honor claims in the future(C. Fombrun & Shanley, 1990). Thus, these better relationships with all stakeholders could lead to an increase on their earning ability or scale, and the positive feedback loop will circuit again. This hypothesized positive feedback cycle. 政 治 大 phenomenon that enterprises with better accounting performance are tend to be 立. fully supports the social impact hypothesis, but also depicted an “Icing on the Cake”. chosen in the social index.. ‧ 國. 學. Graph1: Hypothesized positive feedback cycle for firms engaging in CSR. ‧. n. er. io. sit. y. Nat. al. Ch. engchi. i n U. v. Further research could proceed in following directions. First, my study finds out that exit from the prominent social index may lead to a drop in these deleted stocks, however, it’s still not very clear that this phenomenon depend more from the reaction of SRI funds or from an expected negative shock on shareholders’ value. Moreover, 39.
(41) further study using matching theory should take longer period of data or larger samples if possible, because using the matching theory often reduces the samples, making the estimation less efficiency. There are some methods providing more close matching but lose the sample size, such as Mahala Caliper; in contrast, some methods are just the opposite, they provide less satisfactory matching but retain larger sample size, like Nearest and Caliper which we applied in this article. If there is more data existing, more accurate and efficient results could be presented. Given the pressure on companies to demonstrate that they are behaving as good. 政 治 大 reporting on and reviewing the CSR activities of companies. However, the long-term 立 corporate citizens, it is not surprising that a new industry has developed around. value of a reputation for CSR can only be preserved if a company’s CSR activities are. ‧ 國. 學. aligned with the values and goals of the organization (Porter and Kramer, 2006). This. ‧. will continue to be an ongoing challenge. In determining a CSR strategy, stakeholder. sit. y. Nat. engagement must be at the core and firms must develop an understanding of their. io. er. current performance through the use of appropriate metrics. In the end, this may be the real value in participating in indices like the DJSI. By demanding that companies. al. n. v i n C h performance, account for their social and environmental the DJSI serves as an engchi U. excellent benchmarking tool for those organizations that truly wish to remain best in class.. 40.
(42) References Barnea, A., & Rubin, A. Corporate Social Responsibility as a Conflict Between Shareholders. [10.1007/s10551-010-0496-z]. Journal of Business Ethics. Becchetti, L., R. & Hasan, I. (2007). Corporate Social Responsibility and Shareholder’s Value: An Event Study Analysis. Working Paper, Federal Reserve Bank of Atlanta. Bertrand, M., & Mullainathan, S. (2003). Enjoying the Quiet Life? Corporate Governance and Managerial Preferences. The Journal of Political Economy, 111(5), 1043-1075.. 政 治 大. Cowen, S. S., Ferreri, L. B., & Parker, L. D. (1987). The impact of corporate characteristics on social responsibility disclosure: A typology and frequency-based analysis. [doi: DOI: 10.1016/0361-3682(87)90001-8]. Accounting, Organizations and Society, 12(2), 111-122.. 立. ‧ 國. 學. ‧. Dhaliwal, D. S., Lee, K. J., & Fargher N. L. (1991). The association between unexpected earnings and abnormal security returns in the presence of financial leverage*. Contemporary Accounting Research, 8(1), 20-41.. sit. y. Nat. n. al. er. io. Dutton, J. E., & Dukerich, J. M. (1991). Keeping an Eye on the Mirror: Image and Identity in Organizational Adaptation. The Academy of Management Journal, 34(3), 517-554.. Ch. engchi. i n U. v. Fama, E. F., & French, K. R. (1993). Common risk factors in the returns on stocks and bonds. [doi: DOI: 10.1016/0304-405X(93)90023-5]. Journal of Financial Economics, 33(1), 3-56. Fombrun, C., & Shanley, M. (1990). What's in a Name? Reputation Building and Corporate Strategy. The Academy of Management Journal, 33(2), 233-258. Fombrun, C. J., & Gardberg, N. A. (2000). Opportunity platforms and safety nets: Corporate citizenship and reputational risk. [Article]. Business & Society Review (00453609), 105(1), 85. Frey, B. S., & Oberholzer-Gee, F. (1997). The Cost of Price Incentives: An Empirical 41.
(43) Analysis of Motivation Crowding- Out. The American Economic Review, 87(4), 746-755. Jensen, M. C., & Meckling, W. H. (1976). Theory of the firm: Managerial behavior, agency costs and ownership structure. [doi: DOI: 10.1016/0304-405X(76)90026-X]. Journal of Financial Economics, 3(4), 305-360. Karlsson, J & Yana C. (2008). Does Corporate Social Responsibility Pay off? – An Event Study of the Impact of Corporate Entry and Exit from the Dow Jones Sustainability World Index on the Market Value of a Company. Unpublished Advanced level Thesis, School of Business, Economics and Law, Goteborg University.. 政 治 大 Lee E Preston, & Douglas P O'Bannon. (1997). The corporate social-financial 立 performance relationship. Business and Society, 36(4), 419-429.. ‧ 國. 學. ‧. Martin Curran, M., & Moran, D. (2007). Impact of the FTSE4Good Index on firm price: An event study. [doi: DOI: 10.1016/j.jenvman.2006.02.010]. Journal of Environmental Management, 82(4), 529-537.. y. Nat. sit. n. al. er. io. McGuire, J. B., Alison, S., & Schneeweis, T. (1988). Corporate Social Responsibility and Firm Financial Performance. The Academy of Management Journal, 31(4), 854-872.. Ch. engchi. i n U. v. Montiel, I. (2008). Corporate Social Responsibility and Corporate Sustainability: Separate Pasts, Common Futures. Organization & Environment, 21(3): 245-269. Newgren, K. A., Rasher, M. LaRoe & M. Szabo. (1985) Environmental Assessment and Corporate Performance: A Longitudinal Analysis Using Market-Determined Performance Measures. Research in Corporate Social Performance and Policy, 7(1), 153–164 O'Connor, M., & Spangenberg, J. H. (2008). A methodology for CSR reporting: assuring a representative diversity of indicators across stakeholders, scales, sites and performance issues. [doi: DOI: 10.1016/j.jclepro.2007.08.005]. Journal of Cleaner Production, 16(13), 1399-1415. 42.
(44) Porter, M. E. & M. R. Kramer. (2006). Strategy & Society: The Link Between Competitive Advantage and Corporate Social Responsibility. Harvard Business Review,84(12), 78-92. Posner, R. A. (1975). The Social Costs of Monopoly and Regulation. The Journal of Political Economy, 83(4), 807-827. Rosenbaum, P. R., & Rubin, D. B. (1985). Constructing a Control Group Using Multivariate Matched Sampling Methods That Incorporate the Propensity Score. The American Statistician, 39(1), 33-38. Rubin, D. B., & Thomas, N. (1992). Characterizing the Effect of Matching Using Linear Propensity Score Methods with Normal Distributions. Biometrika, 79(4), 797-809.. 立. 政 治 大. ‧ 國. 學. ‧. Ruf, B., Muralidhar, K., Brown, R., Janney, J., & Paul, K. (2001). An Empirical Investigation of the Relationship Between Change in Corporate Social Performance and Financial Performance: A Stakeholder Theory Perspective. [10.1023/A:1010786912118]. Journal of Business Ethics, 32(2), 143-156.. y. Nat. sit. n. al. er. io. Shen, C., & Chang, Y. (2009). Ambition Versus Conscience, Does Corporate Social Responsibility Pay off? The Application of Matching Methods. Journal of Business Ethics, 88, 133.. Ch. engchi. i n U. v. Brammer, S., Brooks,C. & Pavelin, S. (2006). Corporate Social Performance and Stock Returns: UK Evidence from Disaggregate Measures. Financial Management, 35(3), 97-116. Waddock, S. A., & Graves, S. B. (1997). The Corporate Social Performance-Financial Performance Link. Strategic Management Journal, 18(4), 303-319. Walley, N.& B. Whitehead. (1994). It’s Not Easy Being Green. Harvard Business Review, 72, 2–7. 43.
(45)
數據

+5
相關文件
批判絕對 多元經驗 社會責任 經驗變數 民主承諾
多組樣本重複測量分析方法 多組樣本重複測量分析方法 Repeated measures ANOVA Repeated measures ANOVA..
“UPDATE:Australia's Woodside Ready To Expand NW Shelf Gas,” Dow Jones Newswires, January 10,
The significant and positive abnormal returns are found on all sample in BCG Matrix quadrants.The cumulative abnormal returns of problem and cow quadrants are higher than dog and
Transparency International (2013), Global Corruption Barometer, National Results (Taiwan), 2014/10/12 Retrieved from http://www.transparency.org/gcb2013/country/?country=taiwan
The study explore the relation between ownership structure, board characteristics and financial distress by Logistic regression analysis.. Overall, this paper
mid: 左半部 array 的最大 index high: array 最大的 index.. 股市大亨 之
One, the response speed of stock return for the companies with high revenue growth rate is leading to the response speed of stock return the companies with
