行政院國家科學委員會專題研究計畫 成果報告
企業改名對股價的影響:台灣、亞洲股市及與黃金相關企
業的實證研究(第 3 年)
研究成果報告(完整版)
計 畫 類 別 : 個別型 計 畫 編 號 : NSC 96-2628-H-004-003-MY3 執 行 期 間 : 98 年 08 月 01 日至 99 年 10 月 31 日 執 行 單 位 : 國立政治大學財務管理學系 計 畫 主 持 人 : 張元晨 計畫參與人員: 學士級-專任助理人員:謝立威 報 告 附 件 : 國外研究心得報告 出席國際會議研究心得報告及發表論文 公 開 資 訊 : 本計畫涉及專利或其他智慧財產權,2 年後可公開查詢中 華 民 國 100 年 04 月 11 日
1
行政院國家科學委員會補助專題研究計畫成果報告
※※※※※※※※※※※※※※※※※※※※※※※※※
※ ※
※
企業改名對股價的影響:
※
※
台灣、亞洲股市及與黃金相關企的實證研究(2/3)
※
※
※
※※※※※※※※※※※※※※※※※※※※※※※※※
計畫類別:個別型計畫 整合型計畫
計畫編號:
NSC 96-2628-H-004 -003 -MY3執行期間:97 年 8 月 1 日至 98 年 7 月 31 日
計畫主持人:張元晨
本成果報告包括以下應繳交之附件:
□赴國外出差或研習心得報告一份
□赴大陸地區出差或研習心得報告一份
□出席國際學術會議心得報告及發表之論文各一份
□國際合作研究計畫國外研究報告書一份
執行單位:國立政治大學財管系
中 華 民 國 99 年 11 月 22 日 updated
2
行政院國家科學委員會專題研究計畫成果報告
國科會專題研究計畫成果報告撰寫格式說明
Preparation of NSC Project Reports
計畫編號:
NSC 96-2628-H-004 -003 -MY3
執行期限:97 年 8 月 1 日至 98 年 7 月 31 日
主持人:張元晨 國立政治大學財管系
共同主持人:
計畫參與人員:林靜怡
一、中文摘要 本研究探討亞洲包括香港、日本、馬來 西亞籍韓國四個國家股市,企業改名對股價 造成的影響,實證結果發現香港企業比較多 改名的資料,其次為韓國,而香港、韓國馬 來西亞企業改名的行為對股價具有負面的 影響,其中小型企業及非房地產相關的香港 及馬來西亞企業的改名,對股價比較明顯有 負面的影響。 關鍵字:企業改名、亞洲股市、事件研究法Abstract: This paper examines the valuation
effects of corporate name changes in four countries at the Asian markets. We show that there are more company changing their corporate names in the Hong Kong stock market, followed by the Korean stock market. There are significant negative effects for major name changes in the Hong Kong, Korea and Malaysian stock markets. This negative effect is most significant for small firms and firms that are not related to real estate industries in the Hong Kong, Korea and Malaysian markets.
Keywords: name changes, Asian stock
market, event study 二、研究動機
There are an increasing number of corporate name changes in the Asian stock markets. There are 198 companies in Hong Kong, 43 in Japan, 79 in Korea and 68 in Malaysia adopted new titles in the 1999-2005
sample periods. This paper examines the valuation effects of corporate name changes in these countries. We study the effects of corporate name changes associated with major and minor, real estate related or not and big and small firm name changes on stock prices. We are interested in comparing the valuation effects name changes in these countries. Specifically, we test the following null hypotheses:
H1: Stock price reactions to major and minor announcements of name changes are insignificantly different from zero in these Asian countries.
H2:Stock price reactions to announcements of name changes in the real estate industry are insignificantly different from other industries in these Asian countries.
The real estate in Asian markets during our sample period has been doing very well so we compare valuation effects of corporate name changes in this industry to see whether investors are affected by the real estate boom in Asian countries.
H3: The magnitude of stock price reactions to announcements of name changes are the same between big and small firms in the Asian countries.
To investigate the valuation effects of different types of name changes, we classify corporate name changes into the three categories: (1) major versus minor name changes, and (2) real estate-related versus real estate-unrelated name changes. (3) big verse small asset firms. We test the hypotheses regarding the relationship between the valuation effects of corporate name changes and these types of name change for the Asian countries.
3
三、研究方法與結果
Our sample consists of companies in the Asian stock markets. There are 198 companies in Hong Kong, 43 in Japan, 79 in Korea and 68 in Malaysia adopted new titles in the 1999-2005 sample periods. We consider companies that are listed in these markets. These companies are traded in the major stock exchanges in these countries. We search for name changes from the stock exchanges. Since the information of name changes may be released to the market before it is officially announced by the stock exchanges, we also search for news reports for relevant name changes. We consider two choices regarding the announcement day (or the event day): (1) the day when stock exchanges announced corporate name changes; and (2) the first available day of name changes news in the LexisNexis database. We use the earlier one between these two dates as the event day. Daily stock returns, trading volumes, companies’ market value, benchmark indices, and gold price are obtained from Datastream.
Detailed empirical results are provided in Tables 1 to 7. It is seen that there are more company changing their corporate names in the Hong Kong stock market, followed by the Korean stock market. There are significant negative effects for major name changes in the Hong Kong, Korea and Malaysian stock markets. This negative effect is most significant for small firms and firms that are not related to real estate industries in the Hong Kong, Korea and Malaysian markets.
四、參考文獻
1. Bosch, Jean-Claude and Mark Hirschey, 1989, “The Valuation Effects of
Corporate Name Changes,” Financial Management, 18, 64-73.
2. Cooper, Michael J., Orlin Dimitrov and P. Raghavendra Rau, 2001, ”A Rose.com by Any Other Name,” The journal of Finance, 56, 2371-2388.
3. Foerster, Stephen R. and G. Andrew Karolyi, 1993, “International Listing of Stocks: The Case of Canada and the U.S.,” Journal of International Business Studies, 24, 763-784.
4. Foerster, Stephen R. and G. Andrew Karolyi, 1998, “Multimarket Trading and Liquidity: A Transaction Data Analysis of Canada U.S. Interlisting,” Journal of International Financial Markets, Institutions and Money, 8, 393-412.
5. Gonedes, Nicholas J., 1978, “Corporate Signaling, External Accounting, and Capital Market Equilibrium: Evidence on Dividends, Income and Extraordinary Items,” Journal of Accounting Research, 16, 26-79.
6. Horsky D. and P. Swyngedouw, 1987, “Does it Pay to Change Your Company’s Name? A Stock Market Perspective,” Marketing Science, 6, 320-335.
7. Howe, John S., 1982, “A Rose by Any Other Name? A Note on Corporate Name Changes,” The Financial Review, 17, 271-278.
8. Josev, T., A. Peker and R. Faff, 1999, “The Potential Distorting Effect of Extreme Observations in Event Studies: Australian Corporate Name Changes as an Illustrative Case,” Accounting, Accountability and Performance, 5, 1-10.
9. Josev, T., Howard Chan and Robert Faff, 2004, “What’s in a Name? Evidence on Corporate Name Changes from the
4
Australian Capital Market,” Pacific Accounting Review, 16, 56-76.
10. Karbhari, Yusuf, Zulkarnain Muhamad Sori and Shamsher Mohamad, 2004, “Share Price Reaction to Corporate Name Change Evidence from an Emerging Economy,” Corporate Ownership and Control, 2, 38-49.
11. Karpoff, Jonathan M. and Graeme Rankine, 1994, “In Search of a Signaling Effect: The Wealth Effects of Corporate Name Changes,” Journal of Banking and Finance, 18, 1027-1045.
12. Koku, Paul S., 1997, “Corporate Name Change Signaling in the Services Industry,” Journal of Services Marketing, 11, 392-408.
13. Lee, Peggy M., 2001, “What’s in a Name.com?: the Effects of ‘.com’ Name Changes on Stock Prices and Trading Activity,” Strategic Management Journal, 22, 793-804.
14. Rau, P. Raghavendra, Ajay Patel, Igor Osobov, Ajay Khorana and Michael J. Cooper, 2005, “Managerial Actions in Response to a Market Downturn: Valuation Effects of Name Changes in the Dot.com Decline,” Journal of Corporate Finance, 11, 319-335.
15. Tadelis, S., 1999, “What’s in a Name? Reputation as a Tradable Asset,” American Economic Review, 89, 548-563. Empirical results are provided in the following Tables.
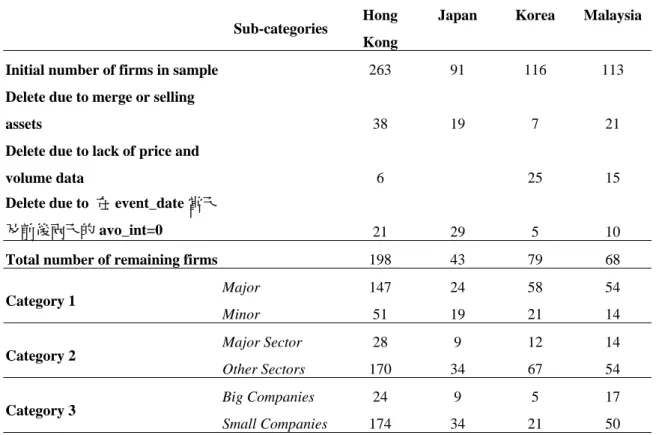
Table 1: Data Description
This table describes the sample companies that changed their names from January 1999 to October 2005. Firms are divided into three subcategories. Category 1: major versus minor name changes. Category 2: firms in major sectors versus in other sectors. Category 3: big company versus small company.
Sub-categories Hong
Kong
Japan Korea Malaysia
Initial number of firms in sample 263 91 116 113
Delete due to merge or selling
assets 38 19 7 21
Delete due to lack of price and
volume data 6 25 15
Delete due to 在 event_date 當天
及前後兩天的 avo_int=0 21 29 5 10
Total number of remaining firms 198 43 79 68
Category 1 Major Minor 147 51 24 19 58 21 54 14
Category 2 Major Sector
Other Sectors
28 9 12 14 170 34 67 54
Category 3 Big Companies
Small Companies
24 9 5 17 174 34 21 50
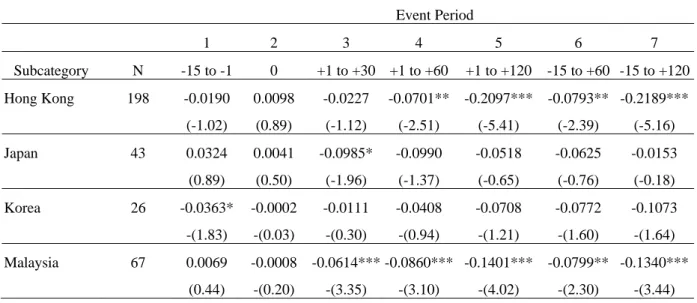
Table 2: Analysis of CARs for the full sample
This table reports market-adjusted cumulative abnormal returns (CARs). The CARs are calculated for various event periods for corporate names changes from January 1999 to October 2005. Each cell reports the average CAR for the respective event periods. T statistics are reported in parentheses. ***, **, and * indicate that the coefficient is significant at the 1%, 5%, and 10 level, respectively. Event Period 1 2 3 4 5 6 7 Subcategory N -15 to -1 0 +1 to +30 +1 to +60 +1 to +120 -15 to +60 -15 to +120 Hong Kong 198 -0.0190 0.0098 -0.0227 -0.0701** -0.2097*** -0.0793** -0.2189*** (-1.02) (0.89) (-1.12) (-2.51) (-5.41) (-2.39) (-5.16) Japan 43 0.0324 0.0041 -0.0985* -0.0990 -0.0518 -0.0625 -0.0153 (0.89) (0.50) (-1.96) (-1.37) (-0.65) (-0.76) (-0.18) Korea 26 -0.0363* -0.0002 -0.0111 -0.0408 -0.0708 -0.0772 -0.1073 -(1.83) -(0.03) -(0.30) -(0.94) -(1.21) -(1.60) -(1.64) Malaysia 67 0.0069 -0.0008 -0.0614*** -0.0860*** -0.1401*** -0.0799** -0.1340*** (0.44) -(0.20) -(3.35) -(3.10) -(4.02) -(2.30) -(3.44)
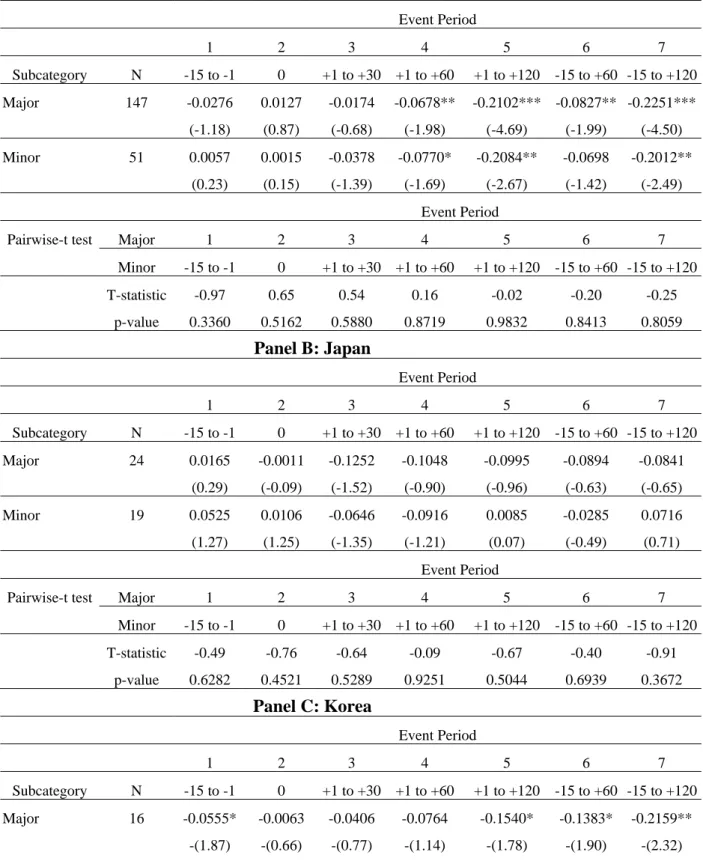
Table 3: Analysis of CARs of subcategory 1: major versus minor name changes
This table reports market-adjusted cumulative abnormal returns (CARs) for Category 1: major versus minor name changes. The CARs are calculated for various event periods from January 1999 to October 2005. Each cell reports the average CAR across all firms for the respective event periods. T statistics are reported in parentheses. ***, **, and * indicate that the coefficient is significant at the 1%, 5%, and 10 level, respectively.
Panel A: Hong Kong
Event Period 1 2 3 4 5 6 7 Subcategory N -15 to -1 0 +1 to +30 +1 to +60 +1 to +120 -15 to +60 -15 to +120 Major 147 -0.0276 0.0127 -0.0174 -0.0678** -0.2102*** -0.0827** -0.2251*** (-1.18) (0.87) (-0.68) (-1.98) (-4.69) (-1.99) (-4.50) Minor 51 0.0057 0.0015 -0.0378 -0.0770* -0.2084** -0.0698 -0.2012** (0.23) (0.15) (-1.39) (-1.69) (-2.67) (-1.42) (-2.49) Event Period
Pairwise-t test Major 1 2 3 4 5 6 7
Minor -15 to -1 0 +1 to +30 +1 to +60 +1 to +120 -15 to +60 -15 to +120 T-statistic -0.97 0.65 0.54 0.16 -0.02 -0.20 -0.25 p-value 0.3360 0.5162 0.5880 0.8719 0.9832 0.8413 0.8059 Panel B: Japan Event Period 1 2 3 4 5 6 7 Subcategory N -15 to -1 0 +1 to +30 +1 to +60 +1 to +120 -15 to +60 -15 to +120 Major 24 0.0165 -0.0011 -0.1252 -0.1048 -0.0995 -0.0894 -0.0841 (0.29) (-0.09) (-1.52) (-0.90) (-0.96) (-0.63) (-0.65) Minor 19 0.0525 0.0106 -0.0646 -0.0916 0.0085 -0.0285 0.0716 (1.27) (1.25) (-1.35) (-1.21) (0.07) (-0.49) (0.71) Event Period
Pairwise-t test Major 1 2 3 4 5 6 7
Minor -15 to -1 0 +1 to +30 +1 to +60 +1 to +120 -15 to +60 -15 to +120 T-statistic -0.49 -0.76 -0.64 -0.09 -0.67 -0.40 -0.91 p-value 0.6282 0.4521 0.5289 0.9251 0.5044 0.6939 0.3672 Panel C: Korea Event Period 1 2 3 4 5 6 7 Subcategory N -15 to -1 0 +1 to +30 +1 to +60 +1 to +120 -15 to +60 -15 to +120 Major 16 -0.0555* -0.0063 -0.0406 -0.0764 -0.1540* -0.1383* -0.2159** -(1.87) -(0.66) -(0.77) -(1.14) -(1.78) -(1.90) -(2.32)
Minor 10 -0.0055 0.0096 0.0361 0.0163 0.0623 0.0204 0.0664 -(0.31) (1.06) (0.77) (0.53) (1.45) (0.62) (1.31)
Event Period
Pairwise-t test Major 1 2 3 4 5 6 7
Minor -15 to -1 0 +1 to +30 +1 to +60 +1 to +120 -15 to +60 -15 to +120 T-statistic 0.22 0.63 -1.07 -1.37 -2.01** -1.18 -1.84* p-value 0.8248 0.5319 0.2881 0.1749 0.0474 0.2426 0.0704 Panel D: Malaysia Event Period 1 2 3 4 5 6 7 Subcategory N -15 to -1 0 +1 to +30 +1 to +60 +1 to +120 -15 to +60 -15 to +120 Major 53 0.0045 -0.0002 -0.0705*** -0.0842** -0.1354*** -0.0799** -0.1311*** (0.24) -(0.03) -(3.15) -(2.47) -(3.27) -(1.88) -(2.80) Minor 14 0.0162 -0.0033 -0.0269 -0.0931** -0.1578** -0.0801* -0.1449** (0.64) -(0.56) -(1.31) -(2.80) -(2.66) -(1.80) -(2.40) Event Period
Pairwise-t test Major 1 2 3 4 5 6 7
Minor -15 to -1 0 +1 to +30 +1 to +60 +1 to +120 -15 to +60 -15 to +120 T-statistic -0.31 0.50 -1.62 0.03 0.17 -0.11 0.07 p-value 0.7599 0.6214 0.1115 0.9774 0.8688 0.9139 0.9474
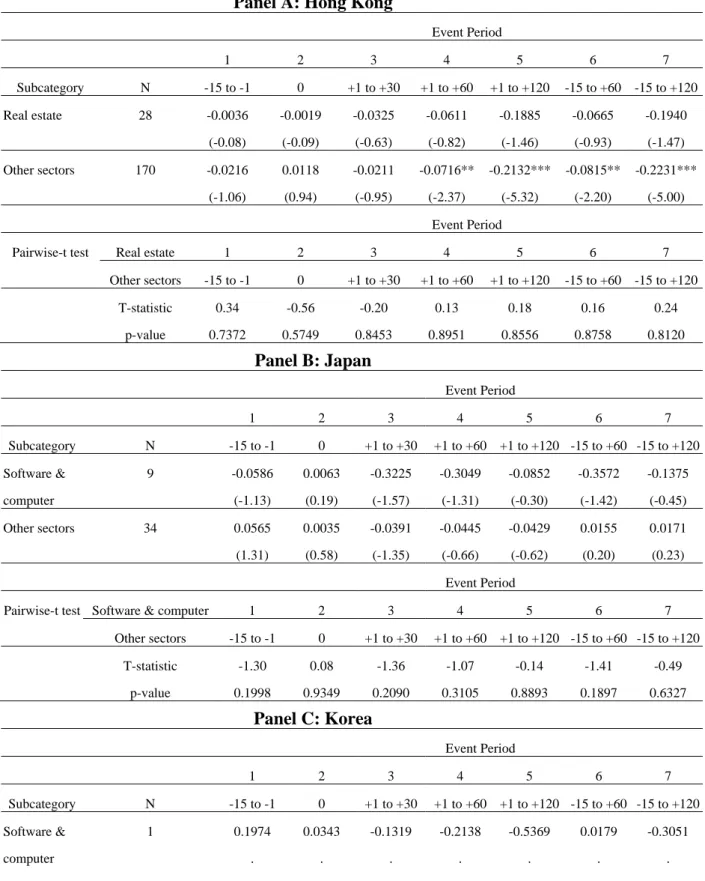
Table 4: Analysis of CARs of subcategory 2: major sectors versus other sectors
This table reports market-adjusted cumulative abnormal returns (CARs) for subcategory 2: firms in major sectors versus in other sectors. The CARs are calculated for various event periods from January 1999 to October 2005. Each cell reports the average CAR across all firms for the respective event periods. T statistics are reported in parentheses. ***, **, and * indicate that the coefficient is significant at the 1%, 5%, and 10 level, respectively.
Panel A: Hong Kong
Event Period 1 2 3 4 5 6 7 Subcategory N -15 to -1 0 +1 to +30 +1 to +60 +1 to +120 -15 to +60 -15 to +120 Real estate 28 -0.0036 -0.0019 -0.0325 -0.0611 -0.1885 -0.0665 -0.1940 (-0.08) (-0.09) (-0.63) (-0.82) (-1.46) (-0.93) (-1.47) Other sectors 170 -0.0216 0.0118 -0.0211 -0.0716** -0.2132*** -0.0815** -0.2231*** (-1.06) (0.94) (-0.95) (-2.37) (-5.32) (-2.20) (-5.00) Event Period
Pairwise-t test Real estate 1 2 3 4 5 6 7
Other sectors -15 to -1 0 +1 to +30 +1 to +60 +1 to +120 -15 to +60 -15 to +120 T-statistic 0.34 -0.56 -0.20 0.13 0.18 0.16 0.24 p-value 0.7372 0.5749 0.8453 0.8951 0.8556 0.8758 0.8120 Panel B: Japan Event Period 1 2 3 4 5 6 7 Subcategory N -15 to -1 0 +1 to +30 +1 to +60 +1 to +120 -15 to +60 -15 to +120 Software & 9 -0.0586 0.0063 -0.3225 -0.3049 -0.0852 -0.3572 -0.1375 computer (-1.13) (0.19) (-1.57) (-1.31) (-0.30) (-1.42) (-0.45) Other sectors 34 0.0565 0.0035 -0.0391 -0.0445 -0.0429 0.0155 0.0171 (1.31) (0.58) (-1.35) (-0.66) (-0.62) (0.20) (0.23) Event Period
Pairwise-t test Software & computer 1 2 3 4 5 6 7
Other sectors -15 to -1 0 +1 to +30 +1 to +60 +1 to +120 -15 to +60 -15 to +120 T-statistic -1.30 0.08 -1.36 -1.07 -0.14 -1.41 -0.49 p-value 0.1998 0.9349 0.2090 0.3105 0.8893 0.1897 0.6327 Panel C: Korea Event Period 1 2 3 4 5 6 7 Subcategory N -15 to -1 0 +1 to +30 +1 to +60 +1 to +120 -15 to +60 -15 to +120 Software & 1 0.1974 0.0343 -0.1319 -0.2138 -0.5369 0.0179 -0.3051 computer . . . .
Other sectors 25 -0.0456** -0.0016 -0.0063 -0.0339 -0.0522 -0.0811 -0.0994
-(2.51) -(0.22) -(0.16) -(0.76) -(0.90) -(1.61) -(1.47)
Event Period
Pairwise-t test Software & computer 1 2 3 4 5 6 7
Other sectors -15 to -1 0 +1 to +30 +1 to +60 +1 to +120 -15 to +60 -15 to +120 T-statistic 1.48 -0.36 -0.27 0.94 -0.23 1.22 0.17 p-value 0.1426 0.7187 0.7911 0.3519 0.8168 0.2263 0.8662 Panel D: Malaysia Event Period 1 2 3 4 5 6 7 Subcategory N -15 to -1 0 +1 to +30 +1 to +60 +1 to +120 -15 to +60 -15 to +120 Construction 14 0.0173 0.0005 -0.0685 -0.0930 -0.1520 -0.0753 -0.1342 & computer (0.56) (0.03) -(1.19) -(1.49) -(1.68) -(1.04) -(1.41) Other sectors 53 0.0042 -0.0012 -0.0595*** -0.0842*** -0.1370*** -0.0811** -0.1339*** (0.23) -(0.28) -(3.34) -(2.70) -(3.65) -(2.04) -(3.13) Event Period
Pairwise-t test Construction & Materials 1 2 3 4 5 6 7
Other sectors -15 to -1 0 +1 to +30 +1 to +60 +1 to +120 -15 to +60 -15 to +120
T-statistic 0.34 0.06 -0.04 -0.02 -0.08 0.15 0.07
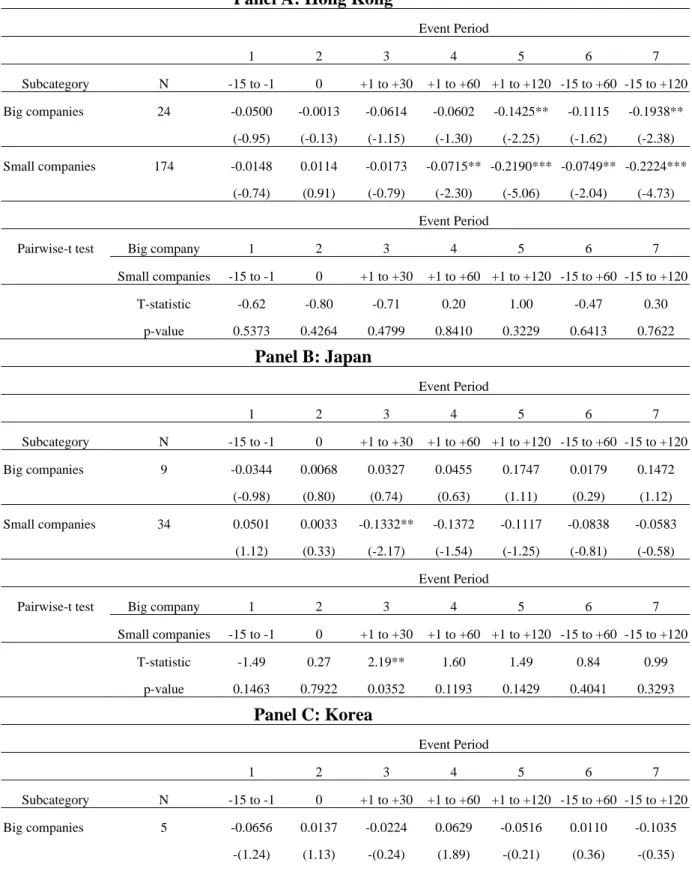
Table 5: Analysis of CARs of subcategory 3: big companies versus small companies
This table reports market-adjusted cumulative abnormal returns (CARs) for subcategory 3: big companies versus small companies. The CARs are calculated for various event periods from January 1999 to October 2005. Each cell reports the average CAR across all firms for the respective event periods. T statistics are reported in parentheses. ***, **, and * indicate that the coefficient is significant at the 1%, 5%, and 10 level, respectively.
Panel A: Hong Kong
Event Period 1 2 3 4 5 6 7 Subcategory N -15 to -1 0 +1 to +30 +1 to +60 +1 to +120 -15 to +60 -15 to +120 Big companies 24 -0.0500 -0.0013 -0.0614 -0.0602 -0.1425** -0.1115 -0.1938** (-0.95) (-0.13) (-1.15) (-1.30) (-2.25) (-1.62) (-2.38) Small companies 174 -0.0148 0.0114 -0.0173 -0.0715** -0.2190*** -0.0749** -0.2224*** (-0.74) (0.91) (-0.79) (-2.30) (-5.06) (-2.04) (-4.73) Event Period
Pairwise-t test Big company 1 2 3 4 5 6 7
Small companies -15 to -1 0 +1 to +30 +1 to +60 +1 to +120 -15 to +60 -15 to +120 T-statistic -0.62 -0.80 -0.71 0.20 1.00 -0.47 0.30 p-value 0.5373 0.4264 0.4799 0.8410 0.3229 0.6413 0.7622 Panel B: Japan Event Period 1 2 3 4 5 6 7 Subcategory N -15 to -1 0 +1 to +30 +1 to +60 +1 to +120 -15 to +60 -15 to +120 Big companies 9 -0.0344 0.0068 0.0327 0.0455 0.1747 0.0179 0.1472 (-0.98) (0.80) (0.74) (0.63) (1.11) (0.29) (1.12) Small companies 34 0.0501 0.0033 -0.1332** -0.1372 -0.1117 -0.0838 -0.0583 (1.12) (0.33) (-2.17) (-1.54) (-1.25) (-0.81) (-0.58) Event Period
Pairwise-t test Big company 1 2 3 4 5 6 7
Small companies -15 to -1 0 +1 to +30 +1 to +60 +1 to +120 -15 to +60 -15 to +120 T-statistic -1.49 0.27 2.19** 1.60 1.49 0.84 0.99 p-value 0.1463 0.7922 0.0352 0.1193 0.1429 0.4041 0.3293 Panel C: Korea Event Period 1 2 3 4 5 6 7 Subcategory N -15 to -1 0 +1 to +30 +1 to +60 +1 to +120 -15 to +60 -15 to +120 Big companies 5 -0.0656 0.0137 -0.0224 0.0629 -0.0516 0.0110 -0.1035 -(1.24) (1.13) -(0.24) (1.89) -(0.21) (0.36) -(0.35)
Small companies 21 -0.0293 -0.0035 -0.0084 -0.0655 -0.0754 -0.0982 -0.1082**
-(1.37) -(0.44) -(0.20) -(1.26) -(1.53) -(1.67) -(2.21)
Event Period
Pairwise-t test Big company 1 2 3 4 5 6 7
Small companies -15 to -1 0 +1 to +30 +1 to +60 +1 to +120 -15 to +60 -15 to +120 T-statistic -0.72 0.98 -0.14 2.08** 0.09 1.65 0.02 p-value 0.4809 0.3355 0.8866 0.0498 0.9289 0.1128 0.9884 Panel D: Malaysia Event Period 1 2 3 4 5 6 7 Subcategory N -15 to -1 0 +1 to +30 +1 to +60 +1 to +120 -15 to +60 -15 to +120 Big companies 17 -0.0206 0.0028 -0.0273 -0.0355 -0.0029 -0.0533 -0.0207 -(0.69) (0.29) -(0.92) -(0.83) -(0.05) -(0.83) -(0.31) Small companies 50 0.0163 -0.0021 -0.0730*** -0.1032*** -0.1868*** -0.0890** -0.1725*** (0.88) -(0.44) -(3.28) -(3.03) -(4.54) -(2.15) -(3.76) Event Period
Pairwise-t test Big company 1 2 3 4 5 6 7
Small companies -15 to -1 0 +1 to +30 +1 to +60 +1 to +120 -15 to +60 -15 to +120
T-statistic -1.02 0.50 1.09 1.06 2.37** 0.44 1.72*
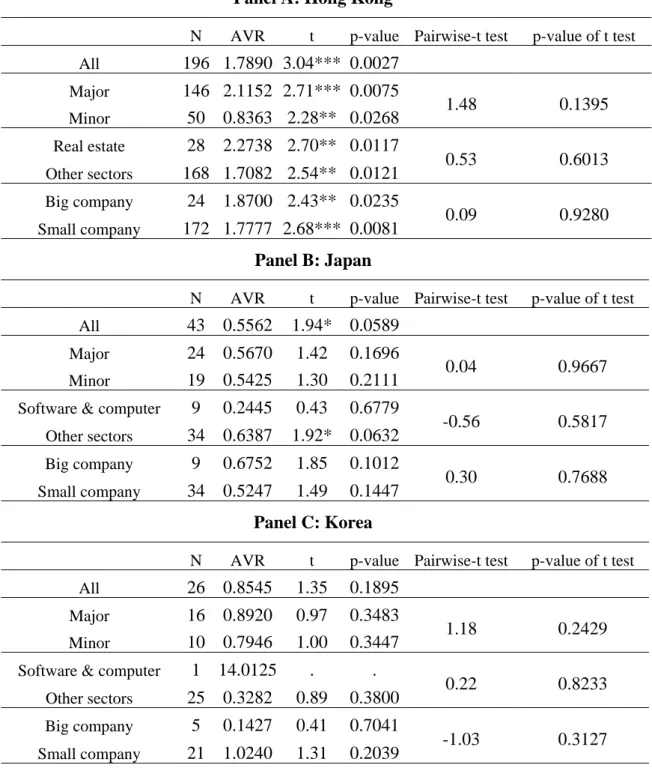
Table 6: Analysis of abnormal volume ratios on day 0 in the Hong Kong, Japan,
Korea and Malaysia market
This table reports the abnormal volume ratios on the event day. The abnormal volume on the event date is calculated for companies that changed their names from January 1999 to October 2005. ***, **, and * indicate that the coefficient is significant at the 1%, 5%, and 10 level, respectively. Firms are divided into three subcategories. Category 1: major versus minor name changes. Category 2: firms in major sectors versus in other sectors. Category 3: big company versus small company.
Panel A: Hong Kong
N AVR t p-value Pairwise-t test p-value of t test
All 196 1.7890 3.04*** 0.0027 Major 146 2.1152 2.71*** 0.0075 1.48 0.1395 Minor 50 0.8363 2.28** 0.0268 Real estate 28 2.2738 2.70** 0.0117 0.53 0.6013 Other sectors 168 1.7082 2.54** 0.0121 Big company 24 1.8700 2.43** 0.0235 0.09 0.9280 Small company 172 1.7777 2.68*** 0.0081 Panel B: Japan
N AVR t p-value Pairwise-t test p-value of t test
All 43 0.5562 1.94* 0.0589
Major 24 0.5670 1.42 0.1696
0.04 0.9667
Minor 19 0.5425 1.30 0.2111
Software & computer 9 0.2445 0.43 0.6779
-0.56 0.5817 Other sectors 34 0.6387 1.92* 0.0632 Big company 9 0.6752 1.85 0.1012 0.30 0.7688 Small company 34 0.5247 1.49 0.1447 Panel C: Korea
N AVR t p-value Pairwise-t test p-value of t test
All 26 0.8545 1.35 0.1895
Major 16 0.8920 0.97 0.3483
1.18 0.2429
Minor 10 0.7946 1.00 0.3447
Software & computer 1 14.0125 . .
0.22 0.8233
Other sectors 25 0.3282 0.89 0.3800
Big company 5 0.1427 0.41 0.7041
-1.03 0.3127
Panel D: Malaysia
N AVR t p-value Pairwise-t test p-value of t test
All 66 1.5670 1.50 0.1377
Major 52 2.0740 1.58 0.1213
1.80* 0.0774
Minor 14 -0.3164 -1.68 0.1168
Construction & Materials 13 1.5689 1.61 0.1332
0.02 0.9838
Other sectors 53 1.5665 1.22 0.2266
Big company 17 0.7339 1.06 0.3050
-0.72 0.4716
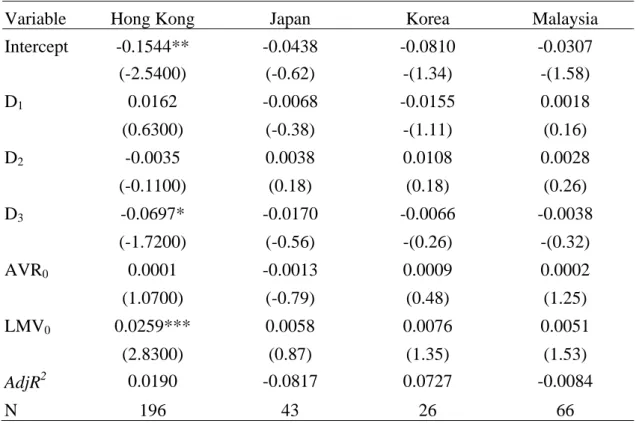
Table 7: Cross-sectional regressions of CAR on the event day:
This table reports results of following regression: CAR001D12D23D34AVR05LMV0e0.
The CAR0 is the abnormal return on the event day for companies that undergo a name change. D1equals to 1 for major name
changes and 0 for minor name changes. D2 equals to 1 for firms in major sectors and 0 for firms in others sectors. D3 equals to
1 for big companies and 0 for small companies. AVR0 is the abnormal volume ratio on the event day which calculated in the
section D. LMV0 is the natural logarithm of the equity market value on the event day. Each cell reports the average abnormal
volume across all firms for the respective event windows. T statistics are reported in parentheses. ***, **, and * indicate that the coefficient is significant at the 1%, 5%, and 10 level, respectively.
Variable Hong Kong Japan Korea Malaysia
Intercept -0.1544** -0.0438 -0.0810 -0.0307 (-2.5400) (-0.62) -(1.34) -(1.58) D1 0.0162 -0.0068 -0.0155 0.0018 (0.6300) (-0.38) -(1.11) (0.16) D2 -0.0035 0.0038 0.0108 0.0028 (-0.1100) (0.18) (0.18) (0.26) D3 -0.0697* -0.0170 -0.0066 -0.0038 (-1.7200) (-0.56) -(0.26) -(0.32) AVR0 0.0001 -0.0013 0.0009 0.0002 (1.0700) (-0.79) (0.48) (1.25) LMV0 0.0259*** 0.0058 0.0076 0.0051 (2.8300) (0.87) (1.35) (1.53) AdjR2 0.0190 -0.0817 0.0727 -0.0084 N 196 43 26 66
表 Y04
行政院國家科學委員會補助國內專家學者出席國際學術會議報告
99 年 12 月 05 日 報告人姓名 張元晨 服務機構及職稱 政大財管系 會議時間 地點 98 年 10 月 21 日到 24 日 Reno, USA 本會核定 補助文號 NSC 96-2628-H-004 -003 -MY3 會議 名稱 (中文) 2009 美國財務學年會 (英文) 2009 FMA Annual Meeting 發表論文 題目
(中文) Does Hedging Add Value? Evidence from the Global Airline Industry
(英文) 避險是否會影響公司價值?國際航空公司的實證結果 報告內容應包括下列各項: 一、參加會議經過 本次年會所在地為美國 Reno,飛機旅途遙遠,但此行本人發表論文並與相關學者討論議 題,有許多學術研究方面的收穫。 二、與會心得 此會議為美國財務管理學界的年會,與會學者均來自全美各校,經由研討會的交流,除 了與研究主題類似的學者深入交談之外,也因此得以結識日後學術研究合作對象。除此 之外,本人也參加幾場有關學術論文主編討論如何發表期刊論文的研討會,對國外重要 學術期刊的審稿方式有進一步的瞭解。 三、考察參觀活動(無是項活動者省略) 無。 四、建議 無。 五、攜回資料名稱及內容
FMA 2009 Annual meeting programs. 六、其他
國科會補助計畫衍生研發成果推廣資料表
日期:2010/12/06國科會補助計畫
計畫名稱: 企業改名對股價的影響:台灣、亞洲股市及與黃金相關企業的實證研究 計畫主持人: 張元晨 計畫編號: 96-2628-H-004-003-MY3 學門領域: 財務無研發成果推廣資料
96 年度專題研究計畫研究成果彙整表
計畫主持人:張元晨 計畫編號:96-2628-H-004-003-MY3 計畫名稱:企業改名對股價的影響:台灣、亞洲股市及與黃金相關企業的實證研究 量化 成果項目 實際已達成 數(被接受 或已發表) 預期總達成 數(含實際已 達成數) 本計畫實 際貢獻百 分比 單位 備 註 ( 質 化 說 明:如 數 個 計 畫 共 同 成 果、成 果 列 為 該 期 刊 之 封 面 故 事 ... 等) 期刊論文 0 0 100% 研究報告/技術報告 0 0 100% 研討會論文 0 0 100% 篇 論文著作 專書 0 0 100% 申請中件數 0 0 100% 專利 已獲得件數 0 0 100% 件 件數 0 0 100% 件 技術移轉 權利金 0 0 100% 千元 碩士生 5 0 100% 博士生 2 0 100% 博士後研究員 0 0 100% 國內 參與計畫人力 (本國籍) 專任助理 1 0 100% 人次 期刊論文 0 0 100% 研究報告/技術報告 0 0 100% 研討會論文 0 0 100% 篇 論文著作 專書 0 0 100% 章/本 申請中件數 0 0 100% 專利 已獲得件數 0 0 100% 件 件數 0 0 100% 件 技術移轉 權利金 0 0 100% 千元 碩士生 0 0 100% 博士生 0 0 100% 博士後研究員 0 0 100% 國外 參與計畫人力 (外國籍) 專任助理 0 0 100% 人次其他成果