台北公共自行車租賃系統使用型態之分析
154
0
0
全文
(2) 台北公共自行車租賃系統使用型態之分析 Better understanding the Taipei public bikesharing system: Exploring activity patterns 研 究 生:鄭 群 彥. Student: Chun-Yen Cheng. 指導教授:汪 進 財 博士. Advisor: Dr. Jinn-Tsai Wong 國 立 交 通 大學. 運輸與物流管理學系 碩士論文. A Thesis Submitted to Department of Transportation and Logistics Management College of Management National Chiao Tung University in partial Fulfilment of the Requirements for the Degree of Master in Traffic and Transportation July 2014. Taipei, Taiwan, Republic of China. 中華民國一○三年七月.
(3) Better understanding the Taipei public bikesharing system: Exploring activity patterns Student: Chun-Yen Cheng. Advisor: Dr. Jinn-Tsai Wong Traffic and Transportation. Department of Transportation and Logistics Management National Chiao Tung University. ABSTRACT City-wide urban infrastructure are increasing reliant on information and communication technology (ICT) to improve and expand the service. Therefore, by taking advantage of passive sensors and Open Data policy, large scale of human behaviour data can be sensed and become more easily accessed independently. Data mining plays a vital role in helping to discover the patterns of human behaviour. In this study, we focus on the emerging urban transport infrastructure: public bikesharing system of Taipei City: YouBike. YouBike is launched from August 2012, operated by Giant, recognised as the world’s largest bicycle manufacturer. Besides, it was the first large-scale public bike sharing system to be implemented in Taiwan. Currently, there are 166 bike station is operation. This study has shown that how bikesharing usage data which mainly focuses on the changes of the number of available bicycles across all stations not only reveals the station activity patterns but also explores the underlying temporal and spatial dynamics of a city. The clustering results indicate that station activity patterns could be categorised into three groups: which are daytime origins nighttime destinations, daytime destinations nighttime origins, and combined origins and destinations. Each cluster groups reveal the different activity patterns throughout the day. We believe that the visualisation of average temporal activity patterns and the clustered results could easily lead to a better understanding of the bicycle availability information. In addition, it is expected to improve the Taipei YouBike service itself, avoiding a future empty or full station through an improved redistribution of bicycles via rebalancing trucks. As a result, it would help to improve user satisfaction with the enhanced service and it is possible to attract more people to use YouBike as an enhanced green transport system. Keywords: public bikesharing system, station activity pattern, data mining, cluster analysis i.
(4) Acknowledgements 論文的結束,另一階段的起始。從入學至畢業的這三年中(密集緊湊的一年北交 生活、一年的英國留學生活以及近一年的替代役生活)即將畫上圓滿的句點。這一路走 來眾多貴人的提攜與幫助,謹以此篇表達對各位的感謝! 能夠順利完成此篇論文,首先要感謝我的指導教授汪進財老師,不管是在問題 的釐清、邏輯思路的理清,在與老師會談後均豁然開朗; 此外老師也不時耳提面命地提 醒除了專業能力的培養,養成獨立思考、解決問題的重要性,方是個人在現今競爭社 會中立足的根本。其次要感謝的是我的口試委員胡守任老師與葉文健老師,提出了許 多寶貴的問題與建議,讓本篇論文臻於完善與健全。此外,也要感謝所上老師的教導, 馮正民老師、陳穆臻老師、邱裕鈞老師、溫傑華老師、黃寬丞老師以及轉任至台大商 研所的許鉅秉老師於申請英國里茲 ITS 提供的幫助。感謝網路無遠弗屆,特別感謝 Shane Lynn 提供接取程式的基礎以及林 yume 的撥空指導;也萬分感謝認識多年的好友 中閔的熱情幫忙,加速資料的的處理,是順利完成論文的一大功臣。也感謝共同奮鬥 的汪家小夥伴們敬莘、涵恩、弼元、憲天,以及研究所的各位榕芳、怡心、紹谷、得 政、筱茜、修豪、思遠等人,讓研究生活充了笑顏與樂趣。 也感謝各位在金瓜寮的同袍們的包容與幫助,感謝育賢與瓜子對於投影片的建 議,柏勛的餅乾、八寶粥,中閔大廚每天中午的張羅,何泓的神奇寶貝紓壓與無限咖 啡供應、涵郁活寶、志遠提供的各種零食,釗暉的人性化管理和 CS 開打,還有每天下 午大家一起做運動聊天打屁的時間,溜溜小黑,讓寫論文時的各種高壓、煩躁得到了 宣洩,能在這一年中在金瓜寮一片群山環繞清幽的環境裡完成論文,實屬天大之幸福。 最後感謝我的父母與家人背後的包容與支持,在未來的日子裡,必定讓你們驕 傲以及無憂。祝各位平安喜樂。. 群彥 謹致於 國立交通大學交通運輸研究所 中華民國 103 年八月 ii.
(5) Table of Contents Abstract ...................................................................................................................................... i Acknowledgements ................................................................................................................... ii Table of Contents .....................................................................................................................iii List of Figures .......................................................................................................................... vi List of Tables ............................................................................................................................ ix List of abbreviations ................................................................................................................. x 1.. Introduction ................................................................................................................... 1 1.1. Background and motivation ....................................................................................... 1 1.1.1. Motivation: the trends of adopting sustainable transport in transport policy ..... 1. 1.1.2. Increasing attention of public bikesharing system ............................................. 3. 1.1.3. The potential benefits and drawbacks of public bikesharing ............................. 5. 1.2. Statement of the problem............................................................................................ 7. 1.3. Aims and Objectives................................................................................................... 9. 1.4. Scope of the dissertation ........................................................................................... 10. 1.5. Dissertation framework ............................................................................................ 10. 1.6. Dissertation structure ................................................................................................ 12. 2.. Literature review ......................................................................................................... 14 2.1. 2.2. 2.3. Public bikesharing system ........................................................................................ 14 2.1.1. Potential benefits of public bikesharing ........................................................... 16. 2.1.2. History and evolution ....................................................................................... 19. 2.1.3. The present ....................................................................................................... 21. 2.1.4. Components ...................................................................................................... 24. 2.1.5. Business model ................................................................................................. 26. Determinants of bikesharing use ............................................................................. 29 2.2.1. Insights from factors influencing cycling ......................................................... 29. 2.2.2. Factors influencing the use of shared bicycles ................................................. 35. 2.2.3. Remarks and key findings ................................................................................ 37. Station activity and spatiotemporal patterns............................................................. 38 2.3.1. Clustering algorithm ......................................................................................... 42 iii.
(6) 2.4 3.. Urban sensing and Open Data .......................................................................... 44. 2.3.3. Prediction of bike stations activity ................................................................... 45. Remarks .................................................................................................................... 48 Public bikesharing scheme in Taipei - YouBike ....................................................... 49. 3.1. Cycling development and policy context ................................................................. 49 3.1.1. Government policy on promoting cycling ........................................................ 49. 3.1.2. Cycling development in Taipei City................................................................. 52. 3.2. Transport characteristics in Taipei City.................................................................... 55. 3.3. Characteristics of Taipei YouBike ........................................................................... 59. 4.. 3.3.1. Design and planning concept............................................................................ 59. 3.3.2. The bloom of Taipei YouBike .......................................................................... 61. 3.3.3. Descriptive analysis of YouBike stations ......................................................... 62. 3.3.4. Pricing and operation management .................................................................. 66. 3.3.5. Trip duration, trip distance and behaviours ...................................................... 67. Data collection and processing ................................................................................... 69 4.1. 4.2. 5.. Data retrieval ............................................................................................................ 69 4.1.1. Basic quantities of the data collected ............................................................... 72. 4.1.2. Limitation ......................................................................................................... 73. Data cleansing and pre-processing ........................................................................... 74 4.2.1. Definition and notations ................................................................................... 74. 4.2.2. Cleansing process and processing .................................................................... 75. 4.2.3. Analysis tool ..................................................................................................... 78. Station activity patterns .............................................................................................. 79 5.1. 5.2. 5.3 6.. 2.3.2. Temporal patterns ..................................................................................................... 81 5.1.1. Local activity patterns ...................................................................................... 81. 5.1.2. Global activity patterns..................................................................................... 95. 5.1.3. Remarks ............................................................................................................ 97. Cluster analysis ......................................................................................................... 98 5.2.1. Clustering process .......................................................................................... 100. 5.2.2. Normalised available bicycles (NAB) clusters............................................... 106. Discussions ............................................................................................................. 117 Conclusions ................................................................................................................ 120 iv.
(7) 6.1. Conclusions ............................................................................................................ 120. 6.2. Suggestions for future research .............................................................................. 121. Reference ............................................................................................................................... 124 Appendix A: YouBike station list by administration region ............................................ 131 Appendix B: description of stations .................................................................................... 133 Appendix C: clustering results by stations ......................................................................... 140. v.
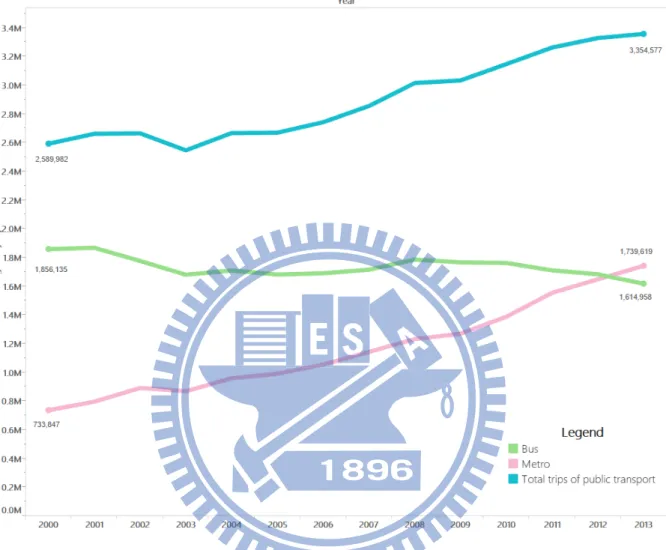
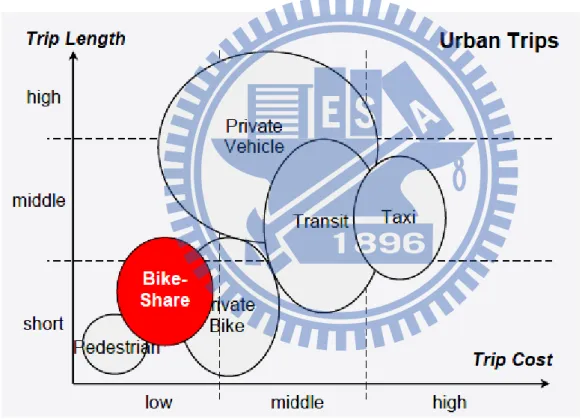
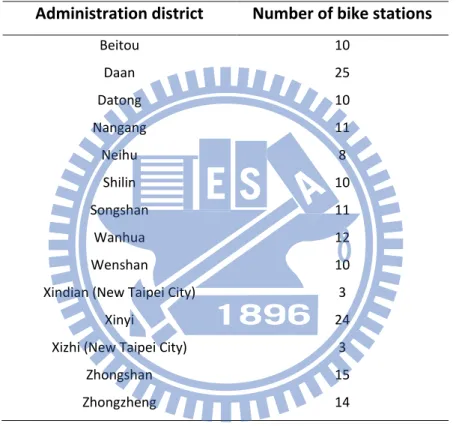
(8) List of Figures Figure 1 Research framework................................................................................................... 11 Figure 2 research flow diagram ................................................................................................ 13 Figure 3 Typical third generation bikesharing system ............................................................ 21 Figure 4 Bicycle elements ........................................................................................................ 24 Figure 5 Types of docking stations .......................................................................................... 25 Figure 6 Policy structure of green transport development in Taiwan ...................................... 50 Figure 7 Cycling path in Taipei City ........................................................................................ 54 Figure 8 Mode split for commuting purpose in 2012 ............................................................... 56 Figure 9 Public transport ridership in Taipei City in recent years............................................ 57 Figure 10 The niche of bikesharing system in urban transport systems ................................... 59 Figure 11 Taipei YouBike station map .................................................................................... 62 Figure 12 Evolution of the number of stations and bikes since operation ............................... 64 Figure 13 Number of trips of YouBike since operation ........................................................... 65 Figure 14 Average turnover rate of YouBike bicycles per day by months .............................. 66 Figure 15 Trip duration of YouBike users ............................................................................... 68 Figure 16 Trip purpose of YouBike users ................................................................................ 68 Figure 17 Demonstration of Python script run in PyCharm ..................................................... 70 Figure 18 Demonstration of part of data stored in the database ............................................... 71 Figure 19 Bikesharing data analysis process diagram .............................................................. 79 Figure 20 Numbers of stations by geography attributes ........................................................... 80. vi.
(9) Figure 21 Time series of the number of available bicycles (blue line) and total slots (red line) at station No. 0111: MRT Zhongxiao Fuxing Station (Exit 2)......................................... 82 Figure 22 Average weekly station activity patterns of station No. 0111: MRT Zhongxiao Fuxing Station (Exit 2) ................................................................................................................. 83 Figure 23 Average NAB during weekdays and weekends of station No. 0111 ....................... 85 Figure 24 Average NAB during weekdays and weekends of station No. 0014 ....................... 86 Figure 25 Average NAB during weekdays and weekends of station No. 0055 ....................... 87 Figure 26 Average NAB during weekdays and weekends of station No. 0063 ....................... 88 Figure 27 Average NAB during weekdays and weekends of station No. 0064 ....................... 89 Figure 28 Average NAB during weekdays and weekends of station No. 0144 ....................... 90 Figure 29 Average NAB during weekdays and weekends of station No. 0007 ....................... 91 Figure 30 Average NAB during weekdays and weekends of station No. 0049 ....................... 92 Figure 31 Average NAB during weekdays and weekends of station No. 0109 ....................... 93 Figure 32 Average NAB during weekdays and weekends of station No. 0128 ....................... 94 Figure 33 Daily average NAB of total stations ........................................................................ 96 Figure 34 Weekly average NAB of total stations ..................................................................... 97 Figure 35 Agglomerative and divisive hierarchical clustering................................................. 99 Figure 36 Cluster analysis steps ............................................................................................. 100 Figure 37 Popular agglomerative clustering approach of measuring proximity .................... 103 Figure 38 Scree plot of NAB clusters on weekdays ............................................................... 107 Figure 39 Dendrogram of four NAB clusters on weekdays by different ways of cutting level ........................................................................................................................................ 108 Figure 40 The R code of K-means and Silhouette coefficient ............................................... 109 vii.
(10) Figure 41 K-means Silhouette coefficient of the clustering results ....................................... 110 Figure 42 Usage patterns for average NAB of 3 clusters in weekdays .................................. 111 Figure 43 Map visualisation of NAB clustering results on weekdays ................................... 113 Figure 44 Usage patterns for average NAB of 4 clusters in weekends .................................. 114 Figure 45 Map visualisation of NAB clustering results on weekdays ................................... 116. viii.
(11) List of Tables Table 1 Potential benefits and drawbacks of public bikesharing system ................................... 6 Table 2 Measures for alleviating imbalanced distribution of bikes by planning horizons ......... 8 Table 3 Type of trips replaced by bikesharing by cities ........................................................... 17 Table 4 Impacts of public bikesharing on CO2 emissions reduction........................................ 18 Table 5 Worldwide bikesharing systems overview .................................................................. 22 Table 6 Bikesharing business models and examples ................................................................ 27 Table 7 Strengths and weakness by type of operators .............................................................. 28 Table 8 Overview of determinants of cycling (to work)s ......................................................... 33 Table 9 Reference table relating to activity patterns ................................................................ 41 Table 10 Bicycle infrastructure development plans ................................................................. 51 Table 11 Cycling policy context evolution in Taipei City ....................................................... 52 Table 12 Facts and figures of transport services in Taipei City ............................................... 55 Table 13 Number of bike stations by administration district ................................................... 63 Table 14 Usage fees and rates .................................................................................................. 66 Table 15 Structure of bikesharing ride data ............................................................................. 70 Table 16 Errors during data retrieval period ............................................................................ 72 Table 17 Changes of station size during data collection period ............................................... 73 Table 18 Details of removed data ............................................................................................. 77 Table 19 Summary of studies using clustering....................................................................... 101 Table 20 Summary of Silhouette coefficient in different number of clusters ........................ 109. ix.
(12) List of abbreviations API BN BoE CO CO2 CSV DoT Taipei EM EU GHG GIS ICT. Application Programming Interface Bayesian Network Bureau of Energy, Ministry of Economic Affairs (Taiwan) Carbon monoxide Carbon dioxide Comma-Separated Values Department of Transportation, Taipei City Government Expectation Maximisation European Union Greenhouse Gas Geographic Information System Information and Communication Technologies. IDE IOT ITS JSON KlOE KM Km2 MOTC Mt NAB NOx PBIC PBS PPP SIB SO2 SSE TDG TEO TFEA TfL TRL TRTC WCED. Integrated Development Environment Institute of Transportation, MOTC Intelligent Transport System JavaScript Object Notation Kilolitre of Oil Equivalent K-means Square Kilometres Ministry of Transportation and Communications, R.O.C. Million tonnes Normalised Available Bicycles Nitrogen Oxides Pedestrian and Bicycle Information Centre Public Bike Sharing Public-Private Partnership Sequential Information Bottleneck Sulphur dioxide Error Sum of Squares Toole Design Group Traffic Engineering Office Taipei Friendly Environment Association Transport for London Transport Research Laboratory Taipei Rapid Transit Corporation World Commission on Environment and Development. x.
(13) 1. Introduction This chapter briefly describes the background to this dissertation and briefly highlights the important role of bike-sharing systems in daily mobility and achieving sustainable transport. It also demonstrate these issues by contributing to defining the research questions, the aims and objectives, the structure and research process, and the scope of the dissertation. Finally, it concludes with a brief outline of each chapter.. 1.1 Background and motivation 1.1.1. Motivation: the trends of adopting sustainable transport in transport policy. The need to achieve sustainable transport is evident. While transport system underpins the basic daily life, maintaining and delivering activities of different sectors in society, it is critical to think that what cost or long term effect that transport sectors may bring about, especially in terms of the environment impacts and externalities. Sustainable transport is based on the context of sustainable development which Brundtland Report defined it as “development meets the needs of the present without compromising the ability of future generations to meet their own needs” in three perspectives of sustainability: economic, social, and environmental (WCED, 1987). More specifically, World Bank (1996) defined sustainable transport in terms of three pillars in sustainability where: 1). economic sustainability: to make transport more cost-effective and can respond to growing demands by competition and the enhancement of user participation;. 2). social sustainability: to provide universal access to transport and meet the needs particularly of the poor; and. 3). environmental sustainability: to address adverse impacts that transport brings about in terms of land use, energy consumptions, water, air quality etc. for more liveable environment. Noted that sustainable transport is not only in accordance with ecology-friendly of sustainable development which satisfies current transport and mobility needs and still being functional by future generations but also being avoidance of institutional failures (Zuidgeest et al., 2000; Chapman, 2007).. 1.
(14) For example, generally speaking in 2011 transport accounts for 22% of energy related carbon dioxide (CO2) emissions globally 1 (IEA, 2012). Hence, it achieves 6.9 Gt CO2 emissions 2, as the largest end-used sector source, and more than half the oil used (IEA, 2012). It is widely accepted that increasing mobilisation and reliance on motorcars associated to increasing urban traffic leads to higher demand on energy consumption, greater CO2 emissions and brings about externalities (Plaut and Shmueli, 2000; European Commission, 2004). These incorporate air pollution, noise and vibration, and traffic accidents at local level whereas climate change at the global level. Emissions from transport not only refer to CO2 but also incorporating particulates (PM10 and PM2.5), Nitrogen oxides (NOx), carbon monoxide (CO), Sulphur dioxide (SO2) etc., resulting in harming human health as well as environment. Notably, it would also cause negative impacts on urban quality of life in term of equity, economic efficiency, visual intrusion, severance and competitiveness (European Commission, 2004). Growing concerns about climate change, global warming, energy security, and unstable fuel prices have caused a large number of policy makers and experts to explore sustainable travel solutions (Shaheen et al., 2010). As a result, a variety of non-motorised transport modes has been promoted by transport planners, professionals and policy makers in recent years, which are often considered as vital elements in sustainable transport (Rietveld and Daniel, 2004). Promoting active transport from motorised travel towards walking and cycling would expect to yield environmental benefits, such as limiting greenhouse gases (GHG) emissions (e.g., CO2 emissions), reducing air pollution, noise, and alleviating traffic congestion (Rabl and de Nazelle, 2012; Woodcock et al., 2014). Moreover, it is increasing recognised that cycling and walking represent practical opportunities for people to integrate physical activity into daily life and yield positive impacts on public health (Cavill et al., 2008; Dill, 2009). Based on the concerns described above, more and more policy planners and transport planning researchers have increasing interested in sustainable transport alternatives which could be seen as possible solutions to combat those challenges. Specifically, reducing carbon emission to mitigate climate change and adapting to the potential impacts of climate change have become a major policy in many countries in the world (Wadud, 2014).. 1 2. including international aviation and bunkers Gt = 1,000,000,000 tonnes. 2.
(15) Accordingly, one possible way could be adopted to deal with these problems is the promotion of cycling through implementing public bikesharing scheme, which is economical, ecofriendly, healthy, ultra-low carbon emissions and more equitable. 1.1.2. Increasing attention of public bikesharing system. Public bikesharing systems (PBS), also known as public bikes or bikesharing or shared bicycle system, have received increasing attention in the last decade and have rapidly emerged in many cities all over the world. In addition, it could be considered as an innovative scheme in the realm of urban transport (Parkes et al., 2013; Zaltz Austwick et al., 2013; Bührmann, 2007). Bikesharing schemes are networks of public use of bicycles operated in urban areas for use at low cost and accessed from a fixed number of stations which are distributed around a city (NYC Dept. City Planning, 2009; Lathia et al., 2012). Travellers can pick up bicycles at any selfservice bike station and return them to any of the stations’ parking slots, making it ideal for point-to-point trips (NYC Dept. City Planning, 2009). The bikesharing usage is limited by time rather than the usage in terms of origination and destination (Lathia et al., 2012). For example, the first 30 minutes is free which is an often fare structure in many cities, and penalty fare would occur if the bicycle is not returned within given time for ensuring circulation rate at certain level. The prosperity of bikesharing system may be mainly because that it “provides the missing link between existing points of public transportation and desired destinations” (Midgley, 2009). It also covers the issue that bridging the gap between distances that are deemed too far to walk, but too close to justify a car/public transport trip (Casiello et al., 2013). In this role, bikesharing systems increase transit accessibility. Accordingly, it could be an alternative and complementary transport mode, even as part of green and versatile public transport in cities (Borgnat et al., 2011; Faghih-Imani et al., 2014). Over the past ten years, public bikesharing schemes have developed from being pilot experiments in urban mobility to mainstream public transport options in cities as large and complex as Paris and London (Midgley, 2011). Currently, there are almost 700 cities in the world have implemented bike-share systems till at the end of April 2014 and more than 200 cities are planning to install public bikesharing (DeMaio and Meddin, 2014).. 3.
(16) This system is intended to generate the benefits associated with cycling while providing users with free or rental bicycles particularly suitable for short distance journey in urban areas (Bachand-Marleau et al., 2012; Etienne and Latifa, 2012). A public bicycle sharing scheme enables users to ride bicycles whenever needed rather than maintaining cost and taking responsibilities for owing a bicycle since bicycle theft is a common issue in urban regions (Rietveld and Daniel, 2004; Shaheen et al., 2010; Bachand-Marleau et al., 2012; Faghih-Imani et al., 2014). In addition, It allows more people experiencing health benefits, cost savings, flexibility, and enjoyment while cycling across the city (ITDP, 2013; Fishman et al., 2013). Not only a bikesharing system can be interpreted as an individual mode for short trips but also served as a vital segment of an intermodal route for longer trips (Nair et al., 2013). If it serves for an “extension” of the existing transit system, public bikesharing system could be construed as a first-mile or last-mile connection (DeMaio, 2009; Liu et al., 2012; Casiello et al., 2013). In fact, it is suitable for its fast, convenient and flexible characteristics in short term trips whereas for long term trips it would be suitable for bridging the gap among using multimodal transport options. As a result, commuters in urban area could use shared bicycles to connect to their desire destinations from their homes, working places, schools, transit stops or other places. It implies that bikesharing systems play the role in increasing transit accessibility, which is strongly aligned with integrated transit systems explored in the past that also aims to increase the catchment area of transit (Nair et al., 2013). All these characteristics have provoked a growing number of cities to carry out public bikesharing programmes with initiatives to promoting cycling, addressing the first-mile/lastmile connection to transit, and eliminating environmental impacts.. 4.
(17) 1.1.3. The potential benefits and drawbacks of public bikesharing. To some extent, the advantages of bicycle sharing schemes are similar to those of cycling in general (Wiersma, 2010). For example, there are several advantages of public shared bicycle systems from the view of system implementation. It includes (a) low cost of implementation, (b) ease of installation, and (c) less infrastructure required than other modes (DeMaio, 2009; Heinen et al., 2010). Additionally, it also provides a number of potential benefits that implementing bikesharing system. Generally speaking, public bikesharing may offer environmental, social, economic, transport benefits, and other benefits. For instance, it offers users increased travel utility through flexibility and cost (Nair et al., 2013). Travellers can pick up the bikes at any time at any bike stations, choose the route and destinations based on their desires. Compared to other modes, public bikesharing is attractive by its low cost. Shaheen et al. (2010) point out that it has the potential to play an important role in bridging the gap in existing transport networks for solving the first/last mile issue where the short distance between home and public transit or transit stations to work place would be too far to walk. Also, it encourages travellers to use multimodal transport options, and creates larger cycling population. It implies that some personal car trips would be replaced by public bikesharing and it forms the basis of environmental benefits that bikesharing provides. For example, cycle mode share in Barcelona was increased to 1.76% from 0.75 % during the year that Bicing was launched in 2007 (Romero, 2008 as cited in DeMaio, 2009). However, it could be argued that bikesharing schemes also have some drawbacks attached in terms of riding itself. It includes riding skill required, a great physical effort, the difficulty of carry loads while cycling, being at the mercy of weather, travelling more slowly in outside urban area than motorised transport, and etc. (Heinen et al., 2010). A wide range of potential benefits and drawbacks are summarised in Table 1 below.. 5.
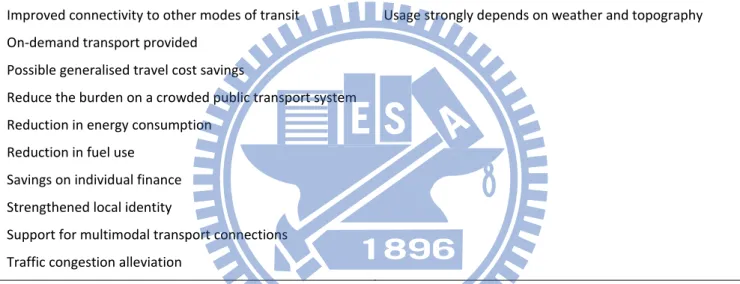
(18) Table 1 Potential benefits and drawbacks of public bikesharing system Potential benefits. Drawbacks. Added benefit of exercise provided to users. Can be used in ways unsafe to riders and pedestrians. (public health improvement) Additional mobility provided. Difficulty of carrying loads. Air quality improvement. May be difficult to ride in some topography. Environmentally friendly. May be inaccessible to people with certain disabilities. Extending the public transport catchment area. Most appropriate for short distance. Freedom from fear of bicycle theft. Riding skills required. GHG emissions reduction. More likely to be affected by the weather while cycling. Have potential on creating larger cycling population. Travelling more slowly than motorised transport outside urban areas. Improved connectivity to other modes of transit. Usage strongly depends on weather and topography. On-demand transport provided Possible generalised travel cost savings Reduce the burden on a crowded public transport system Reduction in energy consumption Reduction in fuel use Savings on individual finance Strengthened local identity Support for multimodal transport connections Traffic congestion alleviation Source: Adapted from DeMaio (2003); DeMaio and Gifford (2004); Bührmann (2007); DeMaio (2009); Heinen et al. (2010); Shaheen et al. (2010); Wadud (2014). 6.
(19) 1.2 Statement of the problem There is an increasing demand of leisure activities since Taiwan has practiced the “weekend” policy for labours since 2001. In addition, the importance of keeping physical activity receives increasing attentions by more and more people, and meanwhile life style has been starting to alter. Thus, it provides the great opportunity for government to establish leisured-based public rental system in the attraction points, encouraging more people to use it. According to MOTC (2010), the main purpose of riding bicycles would be for leisure use, exercise, and travelling, which accounts for 60.5%, followed by community activities for 26.4% such as buying groceries, visiting friends and relatives, shopping etc., and commuting purpose accounting for 12.5%. Notably, for those using bicycles to commute to work, most of users (88.2%) commute less than 30 minutes and only 10% of users would spend time between 30 minutes and 60 minutes for commuting (MOTC, 2010). By 2013, modal split in Taipei city of active transport and public transport for all trips accounts for 19.7% and 37.5% respectively whereas for commuting purpose, public transport accounts for 41.8% and active transport for 10.7% (MOTC, 2014). The transformation of YouBike bikesharing scheme seems to be successful through altering the operational strategy in terms of more bike stations supplied, simplified registration and competitive price. As Lathia et al. (2012) found that simper access to the systems in association with not only greater weekend (i.e., recreational) usage but also reinforcing the weekday commuting trend. However, recently the survey done by Taipei Friendly Environment Association (TFEA) reported that publics reckon that there are six issues should be addressed in higher priority: (a) more bike stations integrated with New Taipei City (46.2%), (b) cannot pick up and return the bikes due to imbalanced distribution (36.3%), (c) higher broken rates of bikes (10.5%), (d) broken docks(9.3%) and (e) uncomfortable saddle (6.6%) and (f) fare (6.6%) (黃福其, 2014). Similarly, there are also two biggest problem in Barcelona’s public bikesharing system which results in user frustration, are (1) unable to find a bike while trying to start their journeys and (2) unable to return the bike in the desired destinations due to full stations occupied with bicycles (Kaltenbrunner et al., 2010). Bikesharing operators have to ensure the sufficient bike availability to satisfy customers. The problem of impossibility to pick up/return bikes due to imbalanced distribution seems to be a universal feature and is one of the main issues raised by many users in cities where have 7.
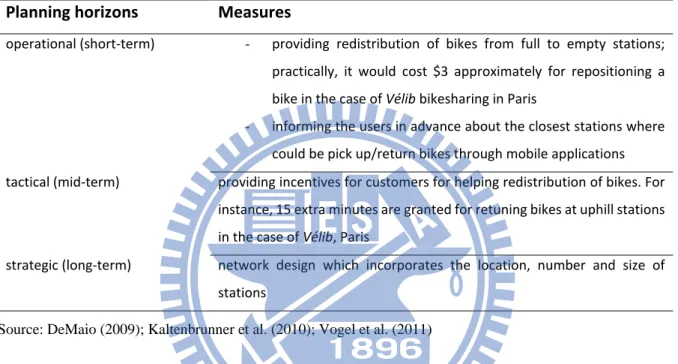
(20) implemented bikesharing (Kaltenbrunner et al., 2010; Shaheen et al., 2010; Vogel et al., 2011; Shaheen and Guzman, 2011; Zhang et al., 2012; Liu et al., 2012; Nair et al., 2013). It is believed that the shared bikes designed for short-term and one-way use resulting in the imbalanced spatial distribution of bikes at stations over time (Vogel and Mattfeld, 2011). Normally, this issue could be addressed through design and management measures in terms of different of planning horizons shown in Table 2 below: Table 2 Measures for alleviating imbalanced distribution of bikes by planning horizons Planning horizons. Measures. operational (short-term). -. providing redistribution of bikes from full to empty stations; practically, it would cost $3 approximately for repositioning a bike in the case of Vélib bikesharing in Paris. -. informing the users in advance about the closest stations where could be pick up/return bikes through mobile applications. tactical (mid-term). providing incentives for customers for helping redistribution of bikes. For instance, 15 extra minutes are granted for retuning bikes at uphill stations in the case of Vélib, Paris. strategic (long-term). network design which incorporates the location, number and size of stations. Source: DeMaio (2009); Kaltenbrunner et al. (2010); Vogel et al. (2011). Addressing imbalanced bicycle distributions is one of the research topics on public bikesharing system. Since the short history of modern bikesharing systems, researches on such system and their impacts are still quite few though growing rapidly in recent years. There are number of studies of bikesharing systems have mainly focused on (a) optimisation of bike station locations (Lin and Yang, 2011; García-Palomares et al., 2012; Martinez et al., 2012; Sayarshad et al., 2012; Hu and Liu, 2013; Lin et al., 2013), (b) user perception and satisfaction of such system (Bordagaray et al., 2012), and (c) exploring spatial and temporal characteristics or spatiotemporal trends from the station hire data (Froehlich et al., 2008; Froehlich et al., 2009; Kaltenbrunner et al., 2010; Borgnat et al., 2011; Vogel et al., 2011; Lathia et al., 2012; Borgnat et al., 2013; O’Brien et al., 2014).. 8.
(21) 1.3 Aims and Objectives Based on the above premise, the primary aim of this dissertation is to contribute to the solution of imbalanced distribution of bikes, i.e. unable to pick up/return bikes due to empty/full stations through the analysis of spatio-temporal station activity patterns. In order to achieve the research aim, the objectives of this dissertation are as follows: 1. To identify and understand the role of bikesharing system playing in urban mobility;. 2. To identify, study and analyse spatial and temporal activity patterns of bike stations,. 3. To help gaining the insights into classifying bike stations; and. 4. To explore spatial relations between bike usage and location of stations and how station activity data can be used to infer cultural and geographical layout of Taipei City. By better understanding the role of pubic bikesharing systems in urban mobility, it helps cities search for ways to increase cycling population, meet increasing mobility demands and mitigate adverse environmental impacts (Midgley, 2009). As the ubiquitous ICT embedded in transport systems and higher penetration rate of smartphones, it not only enables users to acquire realtime information about bicycle availability but also amenable to investigation for researchers. Taking the advantages of ICT and Open Data, this research provides the potential of a novel way of retrieving real-time bike station data as a data source in urban transport research particularly. The bike stations usage data reveals spatial and temporal bikesharing patterns; moreover, these patterns reflect the culture and the spatial layout of the city (Froehlich et al., 2009). For instance, station activity patterns may disclosure relations with certain type of customers using certain stations depending on the stations’ surroundings. It is believed that the contribution of this dissertation would have implications for the design and operation of existing bikesharing system in Taipei City as well as future public bikesharing schemes deployment in other cities of Taiwan. Additionally, the findings would also have impacts on three different stakeholders depending on their roles: (1) bike users interest in finding available bicycles or docking slots, (2) transport planners cope with the imbalanced distribution problem and other issues while in operation, and (3) urban planners decide the land use and spatial layout of the city (Lathia et al., 2012). Hence, it leads to a better service of bikesharing afterwards. 9.
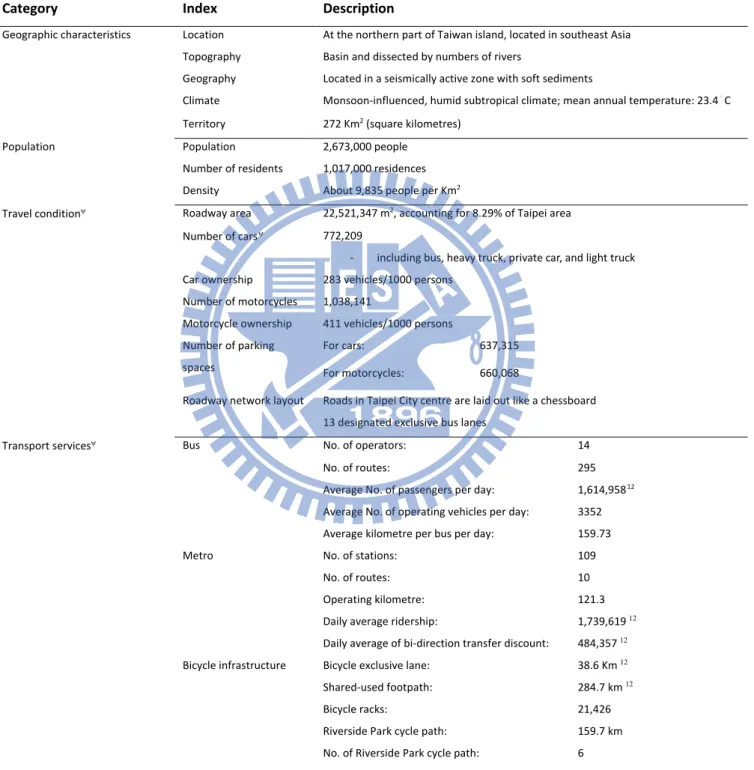
(22) 1.4 Scope of the dissertation Our study area Taipei City, the capital city of Taiwan, has the largest mode share of public transport and active transport (walking and cycling) either for all purposes or commuting among the cities in Taiwan. With 2.67 million people by 2012 where live in only 272 square kilometres (Km2), resulting in extremely high population density for about 9800 people per Km2 (DoT Taipei, 2013a). YouBike which has been discussed in the following sessions refers to the second bikesharing system however the first large scale of bikesharing system deployed in Taiwan since 30 August 2012 (YouBike, 2014d). Although there is another public bikesharing system in Kaohsiung, located in southern Taiwan, which launches since 1 March 2009, this dissertation only covers the study of spatio-temporal activity data among stations in Taipei YouBike system. There are 165 stations of data collected in this study and shown in below Appendix A: YouBike station list by administration region. More detailed station information such as station capacity, id number, establishment time, etc… is presented in Appendix B: description of stations. Notably this study focuses on the temporal analysis and clustering of bike stations through retrieving data of bicycle availability collected at a fixed timespan automatically rather than collecting flow data of bikes at stations. Therefore, it demonstrates another way of looking human mobility data in an urban area instead of identifying changes in travel behaviour over space and time via OD matrix. Public bikesharing schemes mentioned in this research would be mainly refer to the third generation of bikesharing system.. 1.5 Dissertation framework Below Figure 1 illustrates the overall dissertation framework, beginning from literature review which includes introduction of public bikesharing system, identifying the factors influencing bicycle use and studies about station activity and temporal patterns. Followed by three main parts: (a) data collection: retrieving data from Taipei Government Open Data source; (b) station activity pattern analysis based on bicycle availability; and (c) discussions and implications: discussing the bicycle redistribution in the view of operation managements towards stakeholders.. 10.
(23) Literature review. Public bikesharing system. Station activity and temporal patterns. Factors influencing bicycle use Internal factors. External factors Policy influenced. Non-policy influenced. •. Physical infrastructure. •. Non-physical context. •. Individual characteristics. Hilliness Weather/climate Seasons …... Bikesharing characteristics Operation and management. Data collection. Type of data. Time. Station name. Available bikes. Free slots. Data cleansing. Analysis. Clustering. Temporal patterns. Spatiotemporal patterns. Implication. end-users. Operation. transport planners Strategic. urban planners. Figure 1 Research framework 11.
(24) 1.6 Dissertation structure This dissertation is divided into six stages including this introduction. The remainder of this dissertation is organised as follows and research flow diagram is shown in Figure 2 below: Stage 2: Literature Review – It provides an overview of public bikesharing in urban mobility through its characteristics, potential benefits, components, business model and evolution. It is followed by the reviews of the determinants of bicycle use as to discover the factors influencing public bikesharing system usage. This gives us the insights on promoting shared bicycles usage in terms of planning and strategic measures. Researches on station activity and mobility pattern are also reviewed, helping to clarify provide the analysing basis of station usage patterns. Additionally, related works on bikesharing system are discusses, allowing us to cover multiple aspects of this system. Stage 3: Taipei YouBike overview – It provides the detailed description of Taipei public bikesharing system: YouBike, by means of (1) cycling development in Taiwan and how it transforms to fulfil the goal of green transport by Taipei Government, (2) transport characteristics in Taipei City, (3) basic YouBike characteristics, including design and planning concept Stage 4: Data collection and processing – By taking advantage of open data and open source code, the station activity data (e.g., available bikes and free slots) in a given time is collected in an automatically based. Consequently, the collected data is required to be pre-processed, enabling to analyse later. Stage 5: Analysis and results – To explore temporal and spatiotemporal patterns of station activities in the YouBike system, highlighting how these patterns reflect the underlying cultural and spatial layouts and characteristics of the City. When taking account of geographic distribution of these patterns based on clustering results, it enables to visualise the mobility patterns of Taipei city. Stage 6: Conclusions and suggestions – It contains the limitation of this dissertation, suggestions for future works and conclusions.. 12.
(25) Stage 1. Background and motivation. Identify the problem. Aims and objectives, research scope Stage 2. Stage 4 Literature review. • • •. Data collection. Public bikesharing system characteristics; Determinants of bicycle use and bikesharing; Station activity and spatiotemporal patterns. Stage 3 Description of Taipei YouBike Stage 5 Activity patterns analysis Stage 6 Conclusions and suggestions. Figure 2 research flow diagram Source: this study. 13. Data cleansing.
(26) 2. Literature review This literature review in this chapter can be divided into five parts. Firstly, it provides an overview of public bikesharing in urban mobility through its characteristics, potential benefits, components, business model and evolution. Then followed by the reviews of the determinants of bicycle use as to discover the factors influencing public bikesharing system usage. Thirdly, researches on station activity and mobility pattern are also reviewed, helping to clarify provide the analysing basis of station usage patterns. Consequently, related works on bikesharing system are discusses, allowing us to cover multiple aspects of this system. Finally, it concludes with key findings and remarks for this chapter.. 2.1 Public bikesharing system Bikesharing, generally speaking, is the shared use of a bicycle fleet. Since it is the comprehensive citywide system which designed for shared use for publics, it is also known as shared bicycles, public bikesharing scheme, etc. Such systems go by a variety of names around the world: such as “bicycle sharing” or simply “bike-share” in North America, “cycle hire” in the United Kingdom, “cycle sharing “ in South Asia and “public bike” in China (ITDP, 2013). It has received increasing attention recently and rapidly emerged in many cities across the globe. Note that in this study, we usually the term of bikesharing. Pucher et al. (2010) identify that there are three main actions for promoting cycling: travel related infrastructure, measures for integrating bicycles with public transport, and programmes and legal interventions to promote cycling. Bikesharing is the programme for promoting cycling aiming to reducing vehicle travel through shifting to transit, walking and cycling. The primary goals for bike-sharing system are reduction of congestion, pollution and other environmental externalities such as GHG emissions, improvement of public health, promotion for bicycle usage and integration to wider transport system ultimately (Vogel et al., 2011; Murphy and Usher, 2013). It is one of the sustainable transport alternatives that could help to address growing concerns about global motorisation, global climate change, energy security, and unstable fuel prices (Shaheen et al., 2010). In other words, it allows individuals to meet their transport needs in an environmentally sound manner (DeMaio, 2003). Additionally, it seems to be important for social inclusion, which provides sufficient supports for access public transport or carries out the whole journey. It enables people to have access to participate in life. 14.
(27) opportunities, and in reaching activities and services such as education, work, shipping and recreational activities (Daniels and Mulley, 2013). The principle of bikesharing is simple. Bikesharing schemes are networks of public use of bicycles operated in urban areas for use at low cost and accessed from a fixed number of stations which are distributed around a city (NYC Dept. City Planning, 2009; Lathia et al., 2012). Travellers can pick up bicycles at any self-service bike station and return them to any of the stations’ parking slots, making it ideal for point-to-point trips (NYC Dept. City Planning, 2009). The bikesharing usage is limited by time rather than the usage in terms of origination and destination (Lathia et al., 2012). For example, the first 30 minutes is free which is an often fare structure in many cities, and penalty fare would occur if the bicycle is not returned within given time for ensuring circulation. Such system enables users to ride bicycles whenever needed rather than maintaining cost and taking responsibilities for owing a bicycle since bicycle theft is a common issue in urban regions (Rietveld and Daniel, 2004; Shaheen et al., 2010; BachandMarleau et al., 2012; Faghih-Imani et al., 2014).. In addition, It allows more people. experiencing health benefits, cost savings, flexibility, and enjoyment while cycling across the city (ITDP, 2013; Fishman et al., 2013). It is essential to distinguish between general bikesharing scheme and traditional, mostly leisurebased bicycle rental system. In essence, it differs in the following ways (Midgley, 2009): •. can be fast and easily accessed at one location and either returned there or at another location;. •. they have diverse business models;. •. ICT technology embedded and make use of applied technology; for instance, smart cards for fast access and integration with public transport and mobile phone apps for informing available bike at stations; and. •. they are often designed and integrated as part of public transport system.. Moreover, bikesharing bike stations normally “located in close proximity to major transit hubs (e.g., metro stations) and in both residential (origin) and commercial or manufacturing (destination) neighbourhoods”, enabling it ideal for a short-term, commuter transport system (NYC Dept. City Planning, 2009).. 15.
(28) 2.1.1. Potential benefits of public bikesharing. Bikesharing has a lot of potential benefits not only for individuals but society in terms of social, environmental and even economic benefits. One of the main contributions of implementing public bikesharing scheme would be that it plays a vital role in fostering the use of bicycles in cites (García-Palomares et al., 2012). In other words, to explore the potential benefits of bikesharing is actually the synonym of identifying the contributions of cycling it brings about in some extent. Basically, the potential benefits of bikesharing can be concluded and derived from two ways: modal shift and riding itself. These benefit are discussed in the following in terms of four aspects: transport, social, environmental, and economic benefits. 1.. transport benefits The transport benefits which bikesharing brings about may refer to enhanced accessibility and mobility, providing complementary services to public transport, behaviour changes and modal shifts. Since bikesharing systems provide the missing link between existing points of public transport and desired destinations, it bridges the gap between distances that are deemed too far to walk, but too close to justify a car/public transport trip (Midgley, 2009; Casiello et al., 2013). DeMaio and Gifford (2004) mention that the proximity of bikesharing stations to downtown transit stations tends to be ideal for transit customers. As a result, it not only allows users to have greater access to place that are beyond their reach on foot but enhance users’ mobility in a cheaper way. In fact, bikesharing system is suitable for its fast, convenient and flexible characteristics in short term trips whereas for long term trips, it would be suitable for bridging the gap among using multimodal transport options. It offers an alternative for short trips that people would have otherwise made on transit (ITDP, 2013). If it serves for an “extension” of the existing transit system, public bike share could be construed as a first-mile or last-mile connection (DeMaio, 2009; Liu et al., 2012; Casiello et al., 2013). For instance, about 10% of Velo'v users also take public transport in trip chains (Bührmann, 2007). Behaviour shifts also can be identified after the introduction of public bikesharing system. It is reported that during the first year of Velo'v, there is a 44% increasing in bicycle riding in Lyon (Bührmann, 2007). According to Rojas-Rueda et al. (2011), 16.
(29) Bicing has increased the number of cycling trips by 30% since inception. In addition, modal shifts could also be identified after the introduction of bikesharing. For example, Bührmann (2007) reports that in the case of Velo'v, 7% of trips of private car is replaced by public bikes and 37% of walking, 50% of public transport, 4% of private bicycle trips are also replaced by public bikes respectively. Following Table 3 summarises some bikesharing programmes impact on modal shift. Table 3 Type of trips replaced by bikesharing by cities Type of trips replaced. Bicing (Barcelona). BIXI (Montreal). Vélib' (Paris). Velo'v (Lyon). Bus / Metro. 51%. 33%. 65%. 50%. Car / Motorcycle. 10%. 2%. 8%. 7%. 8%. 5%. 26%. 25%. 20%. 6%. 28%. 4%. 4%. 2%. Taxi Walk Bicycle New users. 37%. Source: Midgley (2011). 2.. social benefits The social benefits of shared bicycles may include addressing the parking issue that cyclist faced, increasing public awareness of bikesharing, and improving a city’s image and branding. There is a common issue that although cycling lane has been added and extended longer than before, it is still used not well. For instance, Paris government identified the biggest deterrent was the lack of bicycle parking, especially once they reached their destinations (ITDP, 2013). Implementing bikesharing seems to be able to address the needs for bicycle parking as well as increase cycling populations. In terms of enhanced public awareness of bikesharing, Shaheen et al. (2010) found that according to a 2008 Vélib' survey, 89% of Vélib' users agree that riding with Vélib' makes travel easier in Paris. This phenomenon also happens in Washington D.C, where approximately 79% of users consider using Capital Bikeshare (former: SmartBike) is faster or more convenient than other transport options (Shaheen et al., 2010); and 70% said that t has been important in helping or encouraging them to cycle more often (LDA Consulting 2012 as cited in ITDP, 2013). It is believed that for those cities implement bikesharing system would. 17.
(30) strengthen its image as green or innovative city; for example, Paris’ Vélib' won the British Guild of Travel Writers’ Best Worldwide Tourism project (ITDP, 2013). 3.. environmental benefits As bikesharing provides a low carbon solution for the first/last mile of a shortdistance trip, linking trips between home and public transit or transit stations and the workplace that are too far to walk to, even as a many-mile solution (Shaheen et al., 2012). In terms of environmental benefits, it would come from modal shifts due to more bikesharing users and increased cycling level; hence bikesharing trips replace automobile trips. Additionally it also generates positive impacts not only on environment but also individual health and fitness in a number of ways, incorporating congestion reduction, improved air quality, noise pollution reduction, CO2 emissions reduction, physical health improvements (DeMaio and Gifford, 2004; Bührmann, 2007; DeMaio, 2009; Shaheen et al., 2010; ITDP, 2013). Although the contribution of cycling to pollution and congestion reduction is highly depended on substituting car use for cycling trips, it is more likely to be most effective as part of a wider set of transport measures (SQW, 2007). Below Table 4 clearly demonstrates several examples of bikesharing system impacts on CO2 emissions reduction. Table 4 Impacts of public bikesharing on CO2 emissions reduction. Bikesharing Bicing (Barcelona) BIXI (Montreal). Year of Data. Trips per day. Km per day. CO2 reduction. Rojas-Rueda et al. (2011). 9M Kg/year. DeMaio (2009). 3M pounds/year. Hangzhou. 2009. 172,000. 1,032,000. 191,000/day. Vélib' (Paris). 2009. Velo'v (Lyon). DeMaio (2009). 25,000 (by 2011). 18.6 M pounds 3. Boulder B-cycle. 2011. 18,500. 47,174. Denver B-cycle. 2011. 202,731. Boston. 2011. 140,000. Madison. 2011. 18,500. 46,805. San Antonio B-cycle. 2011. 22,709. 38,575. 694,942. Source: adapted from Shaheen et al. (2012); DeMaio (2009); Rojas-Rueda et al. (2011). 3. since inception. 18. 280,339.
(31) Notably, researches have shown that there is a strong link between physical activity and health. Furthermore, physical and mental health benefits of shared bicycle use are well investigated (see (Fraser and Lock, 2010; Rojas-Rueda et al., 2011; Woodcock et al., 2014). There is an evidence shown that spending 20 minutes on a bike everyday causes a significant positive impact on mental health (Obis 2011 as cited in ITDP, 2013). It may be argued that the using bikesharing would be likely to exposure to traffic-related pollutants than other modes. However, cyclists may be less exposures to these pollutants than motorises actually, assumed that these pollutants concentrate inside automobiles. For instance, the amount of exposure to CO and nitrogen dioxide (NO2) by cyclists only accounts for about 40% and 56% of that pollutants faced by motorists respectively (Gris Orange Consultant, 2009). 4.. Economic benefits The main economic benefits of introducing bikesharing would be that it generates investment in local industry, the cost of implementation and infrastructure maintenance and footprint are substantially lower with comparison to motorised vehicles and public transport (Gris Orange Consultant, 2009; ITDP, 2013). It has the potential to support this system through service providing, demand for hardware and software. However, the research of studying economic benefits is scarce. Note that a wide range of potential benefits and drawbacks of bikesharing has been disclosed and summarised in previous chapter (see Table 1 in chapter 1).. 2.1.2. History and evolution. Over the past decades, public bikesharing could be categorised into four generations in terms of characteristics and components, which are discussed in the following. Bikesharing system has evolved significantly over decades and is firstly emerged in 1965 while Amsterdam introduced the world’s first large scale public bikesharing scheme called “white bikes”, known as the first generation of bikesharing (DeMaio, 2009; Shaheen et al., 2010). The common characteristics of first generation system are that bicycles are typically painted in one colour, unlocked bikes, and distributed around the city for anyone for free use. Note that in some of the systems, the bikes are locked and have to get access key from a local business and deposit required; however the usage of bikes is still free (Shaheen et al., 2010; Shaheen et al.,. 19.
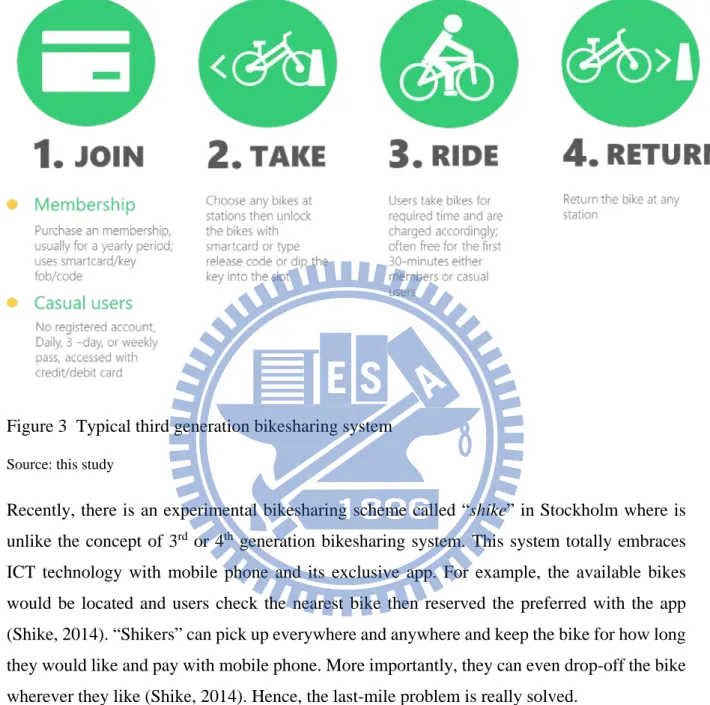
(32) 2012). There were lots of cities implemented a free bike system; for example, La Rochelle, France implemented bikesharing system in 1974 where was considered as successful and continued to operate till today. In the contrast, Cambridge (UK) in 1993 ended with failure due to theft and bicycle vandalism (Shaheen et al., 2010). The general failure of first generation of bikesharing leads to the emergence of a second generation, known as coin-deposit systems which adopt a more structured and improved secure approach to the system (Parkes et al., 2013). Initially, 2nd generation systems were both emerged in Farsø and Grenå, Denmark, but until 1995 that the first large scale of 2nd generation was opened as Bycyken in Copenhagen (DeMaio, 2009). The main differences of 2nd generation bikesharing system are (a) designated docking stations where bikes can be borrowed, locked, and returned; and (b) deposit required to unlock the bikes (Shaheen et al., 2010). Theft is the main issue as well which is partly because of low cost of deposit (generally about US$4), likely to be used for a long time period or not return at all (Shaheen et al., 2010). Bikesharing system in Rennes (France) introduced in 1998 was the first bikesharing scheme using smartcard technology; and it was the introduction of a variety of technology improvements that facilitates 3rd generation bikesharing scheme (IT-based system) and gains popularity worldwide (Midgley, 2011; Shaheen et al., 2010). A number of new characteristics which differentiate from previous generations are: improved bicycle designs, ICT embedded for bicycle pickup, drop-off, locking and tracking, sophisticated docking stations, improved user accountability through the use of credit/debit card or mobile phone numbers (Shaheen et al., 2012; Parkes et al., 2013; Bachand-Marleau et al., 2012). In addition, mobile apps and website are also used to provide real-time information about bike availability for users and as a portal for them to manage their accounts (Parkes et al., 2013). Until 2005 Lyon introduced “Vélo’v”, 3rd generation bikesharing system starts to bloom worldwide. Following Figure 3 shows a system diagram for a typical third generation public bikesharing system and demonstrates the rental process while using the system. Shaheen et al. (2010) propose the concept of 4th generation bikesharing and is still evolving and yet to be fully deployed. Generally speaking, it is demand-responsive, multimodal systems that builds upon the third generation with enhanced features and emphasis on mobile, clean docking stations or solar-powered stations; bicycle redistribution innovations (e.g., demand-responsive, and value pricing for encouraging self-rebalancing); multimodal access with smartcard integration with other modes; GPS tracking, real-time transit integration and system data 20.
(33) dashboards; and electric bikes (Shaheen et al., 2010; Shaheen et al., 2012). Montreal bikesharing system could be seen as 4th generation for example (Bachand-Marleau et al., 2012).. Figure 3 Typical third generation bikesharing system Source: this study. Recently, there is an experimental bikesharing scheme called “shike” in Stockholm where is unlike the concept of 3rd or 4th generation bikesharing system. This system totally embraces ICT technology with mobile phone and its exclusive app. For example, the available bikes would be located and users check the nearest bike then reserved the preferred with the app (Shike, 2014). “Shikers” can pick up everywhere and anywhere and keep the bike for how long they would like and pay with mobile phone. More importantly, they can even drop-off the bike wherever they like (Shike, 2014). Hence, the last-mile problem is really solved. 2.1.3. The present. Public bikesharing system has become a significant trend worldwide. According to Shaheen et al. (2010), at that time approximately 101 public bikesharing schemes are in operation with almost 140,000 shared bicycles across about 125 countries throughout the world. By 2012, it is reported that the number of bikesharing schemes are more than 150 in Europe and almost 30 in North America, respectively. Below Table 5 clearly demonstrates part of bikesharing schemes in the world currently. 21.
(34) Table 5 Worldwide bikesharing systems overview City. Country. Scheme name (system). Operator. Operator type. Launched date. # of stations 4 ( or active). # of bikes4 (or active). Europe Barcelona. Spain. Bicing. Clear Channel. Private. 22th March, 2007. 421. 10,280. Bordeaux. France. VCub. Keolis Bordeaux. Private. 20 February, 2010. 149. 1,700. Brussels. Belgium. Villo!. JCDecaux. Private. 19th May, 2009. 329. 7,868. Dublin. Ireland. Dublinbikes. JCDecaux. Private. June, 2009. 75. 2,104. Gothenburg. Sweden. Styr & Ställ. JCDecaux. Private. 10 August, 2010. 58. 1,278. Lille. France. V'Lille. Keolis. Private. 16th September, 2011. 203. 4,097. London. U.K.. Barclays Cycle Hire. Serco Group. Private. 30 July, 2010. 734. 10,000+. Ljubljana. Slovenia. Bicikelj. JCDecaux. Private. 2011. 33. 646. Luxembourg City. Luxembourg. Vel'oh!. JCDecaux. Private. 2008. 70. 1,327. Lyon. France. Vélo’v. JCDecaux. Private. 19 May, 2005. 340. 4,000. Milan. Italy. BikeMi. Clear Channel. Private. 3 December, 2008. 188. 5,120. Oslo. Norway. Bysykkel. Clear Channel. Private. 2002. 97. 1,442. Nice. France. Vélo Bleu. Veloway. Private. 18 July, 2009. 168. 2,984. Paris. France. Vélib'. JCDecaux. Private. July 15 , 2007. 1,800. 20,000+. Rennes. France. STAR. Keolis. Private. 6th June, 2009. 80. 1,635. Saragossa. Spain. BIZI. Clear Channel. Private. May, 2008. 129. 2,611. Sevilla. Spain. SEVici. JCDecaux. Private. July, 2007. 259. 5,069. Turin. Italy. ToBike. Bicincittà. Private. 6th June, 2010. 133. 1,813. Valencia. Spain. Valenbisi. JCDecaux. Private. 21 June, 2010. 276. 5,497. Vienna (Wien). Austria. Citybike Wien. Cyclocity. Private. May, 2003. 117. 2,913. Warsaw. Poland. VETURILO. Nextbike. Private. August 1st, 2012. 175. 2,500. th. th. th. th. rd. th. th. th. Australasia Brisbane. Australia. CityCycle. JCDecaux. Private. October 1st, 2010. 144. 3,000. Melbourne. Australia. Melbourne Bike Share (BIXI). Alta Bicycle Share. Private. May 30th, 2010. 51. 886. 4. Most of the figure based on the end of April 2014 statistics. 22.
(35) Cont. Table 5 North America Boston. USA. Hubway (BIXI). Alta Bicycle Share. Private. 28 July, 2011. 134. 2,284. Chicago. USA. Divvy (PBSC). CDOT. Public. June 28th, 2013. 300. 5,184. Denver. USA. Denver B-Cycle. Denver Bike Sharing. Non-profit. 22 April, 2010. 81. 1,210. Miami Beach. USA. Deco Bike. DecoBike, LLC. Private. 15 March, 2011. 96. 1,420. Minneapolis. USA. Nice Ride (BIXI). Nice Ride Minnesota. Non-profit. 10th June, 2010. 169. 3,020. Mexico City. Mexico. Ecobici. Clear Channel. Private. 16 February, 2010. 273. 7,335. Montreal. Canada. Bixi (BIXI). PBSC Urban Solutions. Public. 12 May, 2009. 450. 8,864. New York City. USA. Citi Bike (BIXI). Alta Bicycle Share. Private. 27th May, 2013. 330. 11,467. San Antonio. USA. San Antonio B-Cycle (B-cycle). San Antonio Bicycle Share. Non-profit. 26 March, 2011. 52. 781. Toronto. Canada. Bike Share Toronto (BIXI). Public Bike System Company (Bixi). Public. 3 May, 2011. 80. 1,437. Washington, D.C. USA. Capital Bikeshare. Alta Bicycle Share. Private. 20th September, 2010. 319. 2,600+. th th. rd. South America Buenos Aires. Argentina. Mejor en Bixi. City Government of Buenos Aires. Public. 1st December, 2010. 28. 750. Rio de Janeiro. Brazil. Bike Rio (Serttel Samba ). mobilicidade. Private. November 2011. 63. 784. São Paulo. Brazil. Bike Sampa (Samba). mobilicidade. Private. 23 May, 2012. 137. 1,648. Daejeon. South Korea. Tashu (HongChui). DaeJeon Metropolitan City. Public. 2009. 144. 1909. Guangzhou. China. Guangzhou Public Bicycle. Guangzhou Public Bicycle Operation. Public. 22 June, 2010. 50. 4,840. Public. 1st May, 2008. 2,177. 66,500. rd. Asia th. Management Co. Hangzhou. China. Hangzhou Public Bicycle. Hangzhou Public Transport Bicycle Service. Kaohsiung. Taiwan. City Bike. Kaohsiung Rapid Transit Corp. (KRTCO). Public. 1st March, 2009. 149. 4,130. Shanghai. China. Shanghai Forever Bicycle. Shanghai Forever Bicycle Co.. Public. October, 2011. 594. 19,000. Taipei. Taiwan. YouBike. Giant Manufacturing Co. Ltd.. Private. 11 March, 2009. 165. 5,350. Zhongshan. China. ZSBicyle (Changzhou Eversafe). changzhou Eversafe Public Bicycle System. Public. 10th October, 2011. 483. 11,886. Development Co.. Co., Ltd. Source: this study; the figure is collected from official website; O’Brien (2014); DeMaio and Meddin (2014). 23. th.
(36) 2.1.4. Components. Generally speaking, a typical public bikesharing system (3rd generation) would have numbers of essential elements which are demonstrated in the following (Midgley, 2011): 1) bicycles: The design concept of bicycle amis to provide users a comfortable riding experience, hence it should be adaptable to different users in terms of height and weight, mechanically reliable, resistant to theft or vandalism and distinguishable in appearance. Bicycles in most of bikesharing system (3rd or latest generation) are equipped with ICT equipment such as GPS, RFID tag or other tracking technology, facilitating the operation management.. Figure 4 Bicycle elements Source: ITDP (2013). 2) docking stations: It is suggested by Gris Orange Consultant (2009) that there are three types of docking stations: fixed permanent, fixed-portable (modular) and flexible, respectively. The difference between fixed permanent and modular docking stations is mainly on the mobility of service terminals, the bike stands as well as the support of self-powered 24.
(37) (solar power) for providing service. Thus, modular station has more flexibility in terms of installation; once the desired location is determined, it can be installed in a very short time (Gris Orange Consultant, 2009). One typical example of using modular station is Montreal bikesharing system, BIXI. In contrast, the flexible station has larger differences than the other two types. There is no need that bicycle should be locked in the docks; instead, it can be locked to any stationary object when not in use. Such flexible dockings used to be adopted by Copenhagen (Bycyklen); however, such system was abolished in October 2012 was launched again in 2014 with electronic bikes and fixed bike stands (DeMaio, 2012; Bycyklen, 2014). Below Figure 5 demonstrates fixed and mobile type of docking stations; note that some of bike stands in London also adopt mobile type. In addition, there are two types of station design which accommodate check-in and check-out: docking spaces and bike parking areas (ITDP, 2013). Normally each dock is for one bicycle; however two bicycles are for one dock in Taipei YouBike. Regarding bike parking area, bikes are stored together in a secured area, on racks.. Figure 5 Types of docking stations Source: (a) image by swanksalot, http://goo.gl/PVdXjM; (b) image by spacewaitress, http://goo.gl/rSN4nv. 3) System access and user registration Most of bike stations provide kiosks for users to register with debit/credit card or mobile phone to gain access to bicycles. The payment is usually processed through using smartcard or credit/debit card. There are number of ways for unlocking bikes, such as pin code, key fob or smartcard with an electronic user interface for bike check-out.. 25.
(38) Advanced ICT not only facilitates the rental process but enabling to track bicycle usage and user information and helping to curb bicycle theft (TDG and PBIC, 2012). 4) System status information systems Real time information about availability of bikes at stations, empty or full stations are provided on website and shown on mobile apps which is usually visualised presented. 5) Bicycle redistribution mechanism It is expected that it would have asymmetric demand and supply among stations due to a wide range of factors such as geography layout of bike stations, weather etc. Therefore, redistribution mechanism is essential to ensure to meet the demand as possible, reducing the situation of empty or full stations. Redistribution is broadly defined as the rebalancing bicycles form stations which at low capacity or close to empty and is one of the greatest challenges in operation, accounting for around 30% of operating cost in European systems (ITDP, 2013). The redistribution mechanism used by YouBike is discussed in the next chapter (Chapter 3) afterwards. 2.1.5. Business model. The business model defines “the asset ownership and revenue flow between the government and the operator”, aiming to balance service provision with resource allocation (ITDP, 2013). Normally, there are three main types of contracting structure as defined by the ownerships of the assets: (1) publicly owned and operated, (2) publicly owned and privately operated, and (3) privately owned and operated. Note that regardless of these structures, the government still take responsibility of overseeing the system, managing the contracts and monitoring the level of service. In terms of operators of bikesharing systems, it can be categorised into five main varieties: government agencies, public transport authority, or private entities which include forprofit companies and non-profit organisations (ITDP, 2013). Table 6 below provides an overview of bikesharing business models by types of providers. Operating public bikesharing is generally not profitable since revenues from membership and usage fees are not sufficient to cover operation costs (Gris Orange Consultant, 2009). Therefore, a continuous steam of external funding is needed, which mostly come from the public sector or the private sector, or a combination of these two sectors depending on the business model. There. 26.
數據

+7


相關文件
Microphone and 600 ohm line conduits shall be mechanically and electrically connected to receptacle boxes and electrically grounded to the audio system ground point.. Lines in
Therefore, this study is focusing on designing the bicycle traffic safety Lesson Plan to enhance the bicycle riding safety of students.. Through the pre-teaching test and the
Furthermore, in order to achieve the best utilization of the budget of individual department/institute, this study also performs data mining on the book borrowing data
For meeting the requirement in aggregate usage and maximizing utilization ratio of E&R resources obtained from the site, this study tried to adjust the optimum
The usage of computer and Internet has provided a passageway to satisfy the needs.The purpose of this study is to probe into the Internet usage/online behavior and Internet
The purpose of this study was to explore the effects of learning organization culture on teachers’ study and teaching potency in Public Elementary Schools.. The research tool of
This study not only investigated the difference of the character-belief of the sixth graders between the experimental group and the control group but also
The aim of this research is to study changes resulting from parents attending a study group designed by class teacher that include reading a chosen book and engaging in
