企業經營社群影響之實證研究 - 政大學術集成
99
0
0
全文
(2) 企業經營社群影響之實證研究. 摘要 社群網站是目前蓬勃發展的網路應用服務,其多樣化功能與高互動性不僅影 響使用者生活習慣也促進其購買行為。越來越多企業投入大量成本經營社群網站, 希望從中得到好處,但仍有部分企業質疑經營社群無法替企業帶來實質效益。本 研究目的在探討經營社群是否可以帶給企業效益。藉由大量文獻探討,提出了六 個關於社群效益的假設。透過四階段研究來驗證假設,第一階段蒐集了全球 16 個跨國企業資料加以分析,得到了一個概略性的了解; 第二階段蒐集了 58 個跨 國企業的資料進行社群能力與產品銷售之關聯性分析;第三階段研究將焦點放回 台灣企業,蒐集了電信、航空、銀行以及便利商店四個產業中 11 個企業資料進. 政 治 大 行社群能力與產品銷售的關聯性分析;第四階研究段針對第三階段的 11 個企業 立 進行社群經營與企業效益的分析。 ‧. ‧ 國. 學. 本研究發現,經營社群與提升顧客滿意度以及提高品牌知名度上關聯性較低; 而在航空,銀行以及便利商店產業中,經營社群可以提高整體收益。此外,企業 提供具有 1)較低價位、2)較低耐受度的產品或服務以及 3)消費者參與度較低的 購買決策較容易受到社群經營影響。更進一步發現,企業以提升顧客成長以及強 化顧客忠誠度為目標去經營社群會獲得較高的成功率,也較容易得到實質效益。. n. Ch. engchi. 2. er. io. al. sit. y. Nat. 關鍵字:社群網路,Facebook,粉絲專頁,企業績效. i Un. v.
(3) An Empirical Study on the Effects of an Enterprise Fan Page Abstract Most of the major enterprises have invested in social networks to provide services, promote products, or communicate with customers. However, to date no clear understanding on the effects of the social networks on business performance has emerged. This study examined the relationship between the capability of the enterprise to manage social networks and the resultant benefits of their investing in the social network. A fan page on Facebook is the selected target of study. By analyzing the efforts required to manage a fan page, we measure the fan page management capability by its reach, referrals, activities, and interactions. By analyzing literature and practical cases, we hypothesize six types of business benefit impacts can be experienced by enterprises investing in a fan page.. 政 治 大 The study applied four-stages of data collection and testing. The first stage is to 立 build a general understanding of the relationship between the number of fans and ‧. ‧ 國. 學. business revenue. Based on findings of the first stage, the study tested the fan page benefit hypotheses on selected global firms and sought patterns of benefits generated from the fan page. In the third and fourth stage, the study tested the fan page effect on product sold of selected firms in Taiwan and further examined other hypotheses by industries. This study builds deep understanding from various aspects about fan page. y. Nat. sit. n. al. er. io. effects on enterprises, and proposes that firms provide products and services with characteristics of low-product price, short-product durability and low-customer involvement are more influenced by the management of their fan pages. Retail industries such as: banking and airline with high capability of managing Facebook fan page are more likely to increase customer growth and intensify customer loyalty.. Ch. engchi. i Un. v. Key words: Social network, Facebook, Fan page, Business performance. 3.
(4) Acknowledgement Foremost, I would like to express my sincere gratitude to my dear advisor, Dr. Shari S. C. Shang for the continuous support of my master research, for her patience, motivation, enthusiasm, and immense knowledge. Her guidance helped me in all the time of research and writing of this thesis. I could not have imagined having a better advisor and mentor for my study. Besides my advisor, I would like to thank the rest of my thesis committee: Prof. Eldon Y. Li and Prof. Minder Chen, for their encouragement, insightful comments, and hard questions. I thank my fellow lab mates in National Chengchi University: Sam Lin, Jason Yeh and Chris Yu, for the discussions, for the sleepless nights we were working together before deadlines, and for all the fun we have had in the last two years. Also I thank my friends around me: Anne Lee, my soul form master and partner of losing. 政 治 大 weight, always accompanies with me; Gawain Chang, the best colleague in HP, 立 always supports me for the decisions; Jesse Kao, my boss of internship in HP, never ‧. ‧ 國. 學. cares about that I am a green for the work and teaches me all the things; Joan Chung, she was a beautiful girl before, and is a pals bosom friend in my life. I am indebted to my many student colleagues and friends, Alex Lai, Willy Liu, Daniel Shueh, Jessie Chen, C.C Lee, Heo-Chun Chian and others for providing a stimulating and fun environment in which to learn and grow. Last but not the least, I. y. Nat. sit. n. al. er. io. would like to thank my family: my parents, for giving birth to me at the first place and supporting me spiritually throughout my life.. Ch. engchi. 4. i Un. v.
(5) Table of Contents 摘要 ................................................................................................................................................... 2 ABSTRACT .......................................................................................................................................... 3 ACKNOWLEDGEMENT ................................................................................................................ 4 TABLE OF CONTENTS .......................................................................................................................... 5 LIST OF TABLES ................................................................................................................................... 7 LIST OF FIGURES ............................................................................................................................... 11 CHAPTER 1: INTRODUCTION ............................................................................................................ 12 1.1. COMPENDIUM OF SOCIAL NETWORKS ........................................................................................... 12. 1.2. RESEARCH MOTIVATION AND RESEARCH QUESTION .......................................................................... 13. 政 治 大. CHAPTER 2: LITERATURE REVIEW ..................................................................................................... 15. 立. THE CAPABILITY TO MANAGE A FAN PAGE ....................................................................................... 15. 2.2. IMPACTS OF A FAN PAGE ON BUSINESS PERFORMANCE ...................................................................... 15. ‧ 國. 學. 2.1. CHAPTER 3: METHODOLOGY ............................................................................................................ 20 RESEARCH MODEL..................................................................................................................... 20. 3.2. RESEARCH VARIABLES ................................................................................................................ 21. 3.3. DATA COLLECTION ..................................................................................................................... 23. 3.4. METHODS OF DATA ANALYSIS ...................................................................................................... 37. ‧. 3.1. io. sit. y. Nat. er. 3.4.1 Statistical method for 16 case analyses................................................................................ 37. al. n. iv n C hengchi U CHAPTER 4: RESEARCH RESULTS ....................................................................................................... 39 3.4.2 Statistical method for the following research ....................................................................... 38. 4.1. RESEARCH RESULTS OF EACH STAGE............................................................................................... 39. 4.2. ANALYZED RESULTS OF STAGE ONE: FAN-PAGE EFFECTS OF GLOBAL ENTERPRISES..................................... 40. 4.3. ANALYZED RESULTS OF STAGE TWO: FAN-PAGE EFFECTS OF GLOBAL ENTERPRISES BY INDUSTRY .................. 41. 4.3.1 The fan-page effect by total revenue of the food and beverage industry .............................. 43 4.3.2 The fan-page effect by total revenue of the clothing and accessories industry .................... 45 4.3.3 The fan-page effect by total revenue of the retail industry ................................................... 46 4.3.4 The fan-page effect by total revenue of the technology industry .......................................... 47 4.3.5 The fan-page effect by total revenue of the automobile industry.......................................... 48 4.4. ANALYZED RESULTS OF STAGE THREE: LONGITUDINAL ANALYSIS OF ENTERPRISES FAN PAGES IN TAIWAN ....... 49. 4.4.1 The fan-page effect by total revenue of the telecommunication industry in Taiwan ............. 49 4.4.2 The fan-page effect by total revenue of the airline industry in Taiwan ................................ 50 4.4.3 The fan-page effect by total revenue of the banking industry in Taiwan .............................. 52 5.
(6) 4.4.4 The fan-page effect by total revenue of the convenience-store industry in Taiwan .............. 53 4.5. THE TESTING OF OTHER HYPOTHESES ............................................................................................ 54. 4.5.1 The fan-page effect by customer satisfaction of the telecommunications industry in Taiwan ...................................................................................................................................................... 56 4.5.2 The fan-page effect by customer growth of the telecommunications industry in Taiwan ..... 57 4.5.3 The fan-page effect by customer loyalty of the telecommunications industry in Taiwan ..... 58 4.5.4 The fan-page effect by customer growth of the airline industry in Taiwan .......................... 59 4.5.5 The fan-page effect by customer loyalty of the airline industry in Taiwan........................... 60 4.5.6 The fan-page effect by customer growth of the banking industry in Taiwan ........................ 61 4.5.7 The fan-page effect by customer loyalty of the banking industry in Taiwan ........................ 62 4.5.8 The fan-page effect by customer satisfaction of the banking industry in Taiwan ................. 64 CHAPTER 5: DISCUSSION .................................................................................................................. 66. 政 治 大. 5.1. OVERVIEW OF RESEARCH FINDING ................................................................................................ 66. 5.2. VERIFICATION OF THE FAN-PAGE EFFECT BY TOTAL REVENUE ............................................................... 67. 立. 5.2.1 Verification of the fan-page effect by total revenue from 16 global cases ............................ 67. ‧ 國. 學. 5.2.2 Verification of the fan-page effect by total revenue from global firms ................................. 67 5.2.3 Verification of fan-page effect by total revenue from firms in Taiwan.................................. 68 VERIFICATION OF THE FAN-PAGE EFFECT BY CUSTOMER SATISFACTION .................................................. 69. 5.4. VERIFICATION OF THE FAN-PAGE EFFECT BY CUSTOMER GROWTH ........................................................ 70. 5.5. VERIFICATION OF THE FAN-PAGE EFFECT BY BRAND VALUE.................................................................. 70. 5.6. VERIFICATION OF THE FAN-PAGE EFFECT BY CUSTOMER LOYALTY .......................................................... 70. ‧. 5.3. sit. y. Nat. 6.2 6.3. al. iv n C RESEARCH CONTRIBUTIONS ........................................................................................................ 73 hengchi U FURTHER STUDY ....................................................................................................................... 73 n. 6.1. er. io. CHAPTER 6: CONCLUSION ................................................................................................................ 72 RESEARCH LIMITATIONS ............................................................................................................. 72. REFERENCES ..................................................................................................................................... 75 APPENDIX - 2011 FORTUNE 500 ENTERPRISES.................................................................................. 82. 6.
(7) List of Tables Table 3.1-1. Descriptions of research stages................................................ 21 Table 3.2-1. Research variables .................................................................... 22 Table 3.3-1. 16 global cases for non-parametric statistics ........................... 24 Table 3.3-2. 58 global cases for linear regression ........................................ 25 Table 3.3-3. Brand value of 38 cases for linear regression .......................... 30 Table 3.3-4. Public data of convenience store industry ............................... 33 Table 3.3-5. Public data of banking industry ................................................ 34 Table 3.3-6. Fan numbers of telecommunications industry ........................ 35 Table 3.3-7. Public data of telecommunications industry............................ 36 Table 3.3-8. Public data of airline industry .................................................. 37 Table 3.4-1. Interpretation of correlation coefficient .................................. 38. 政 治 大 Table 4.1-1. Research results of hypotheses verification in each stage....... 39 立 Table 4.2-1. The correlation of 16 global firms ............................................ 40 ‧. ‧ 國. 學. Table 4.3-1. Analysis description of the fan-page effect by total revenue of 58 firms ................................................................................................ 41 Table 4.3-2. Correlation coefficients between fan numbers and total revenue from 58 firms ......................................................................... 41 Table 4.3-3. Linear regression results between fan numbers and total. y. Nat. sit. n. al. er. io. revenue of 58 firms .............................................................................. 42 Table 4.3-4. Analysis description of the fan-page effect by brand value of 58 firms ..................................................................................................... 42 Table 4.3-5. Correlation coefficients between fan numbers and brand value of 58 firms ............................................................................................ 42 Table 4.3-6. Linear regression results between fan numbers and brand value of 58 firms .................................................................................. 43 Table 4.3-7. Analysis description of the fan-page effect by total revenue of the food and beverage industry ........................................................... 43. Ch. engchi. i Un. v. Table 4.3-8. Correlation coefficients between fan numbers and total revenue of the food and beverage industry ........................................ 44 Table 4.3-9. Linear regression results between fan numbers and total revenue of the food and beverage industry ........................................ 44 Table 4.3-10. Analysis description of the fan-page effect by total revenue of the of clothing and accessories industry ............................................. 45 Table 4.3-11. Correlation coefficients between fan numbers and total revenue in the clothing and accessories industry ............................... 45 7.
(8) Table 4.3-12. Linear regression results between fan numbers and total revenue of the clothing and accessories industry ............................... 45 Table 4.3-13. Analysis description of the fan-page effect by total revenue of the retail industry................................................................................. 46 Table 4.3-14. Correlation coefficients between fan numbers and total revenue in the retail industry............................................................... 46 Table 4.3-15. Linear regression results between fan numbers and total revenue of the retail industry .............................................................. 46 Table 4.3-16. Analysis description of the fan-page effect by total revenue of the technology industry ....................................................................... 47 Table 4.3-17. Correlation coefficients between fan numbers and total revenue in the technology industry ..................................................... 47 Table 4.3-18. Linear regression results between fan numbers and total revenue of the technology industry..................................................... 47. 政 治 大 Table 4.3-19. Analysis description of the fan-page effect by total revenue of 立 the automobile industry ...................................................................... 48 ‧. ‧ 國. 學. Table 4.3-20. Correlation coefficients between fan numbers and total revenue in the automobile industry .................................................... 48 Table 4.3-21. Linear regression results between fan numbers and total revenue of the automobile industry .................................................... 49 Table 4.4-1. Analysis description of the fan-page effect by total revenue of. y. Nat. sit. n. al. er. io. the telecommunication industry in Taiwan ......................................... 49 Table 4.4-2. Correlation coefficients between fan numbers and total revenue in the telecommunication industry in Taiwan ....................... 50 Table 4.4-3. Linear regression results between fan numbers and total revenue of the telecommunications industry in Taiwan ..................... 50 Table 4.4-4. Analysis description of the fan-page effect by total revenue of the airline industry in Taiwan ............................................................... 51 Table 4.4-5. Correlation coefficients between fan numbers and total revenue in the airline industry in Taiwan............................................. 51. Ch. engchi. i Un. v. Table 4.4-6. Linear regression results between fan numbers and total revenue of the airline industry in Taiwan ............................................ 51 Table 4.4-7. Analysis description of the fan- page effect by total revenue of the banking industry in Taiwan ............................................................ 52 Table 4.4-8. Correlation coefficients between fan numbers and total revenue in banking industry in Taiwan ................................................ 52 Table 4.4-9. Linear regression results between fan numbers and total revenue of the banking industry in Taiwan .......................................... 52 8.
(9) Table 4.4-10. Analysis description of the fan-page effect by total revenue of the CVS industry in Taiwan ................................................................... 53 Table 4.4-11. Correlation coefficients between fan numbers and total revenue in the CVS industry in Taiwan................................................. 53 Table 4.4-12. Linear regression results between fan numbers and total revenue of the CVS industry in Taiwan ................................................ 54 Table 4.5-1. Meanings of indicators used in the testing of other hypotheses .............................................................................................................. 54 Table 4.5-2. Analysis description of the fan-page effect by customer satisfaction of the telecommunications industry in Taiwan ................ 56 Table 4.5-3. Correlation coefficients between fan numbers and churn rate in the telecommunications industry in Taiwan .................................... 56 Table 4.5-4. Linear regression results between fan numbers and churn rate of the telecommunications industry in Taiwan.................................... 56. 政 治 大 Table 4.5-5. Analysis description of the fan-page effect by customer growth 立 of the telecommunications industry in Taiwan.................................... 57 ‧. ‧ 國. 學. Table 4.5-6. Correlation coefficients between fan numbers and total subscribers in the telecommunications industry in Taiwan ................. 57 Table 4.5-7. Linear regression results between fan numbers and total subscribers of the telecommunications industry in Taiwan ................ 57 Table 4.5-8. Analysis description of the fan page-effect by customer loyalty. y. Nat. sit. n. al. er. io. of the telecommunications industry in Taiwan.................................... 58 Table 4.5-9. Correlation coefficients between fan numbers and ARPU in the telecommunications industry in Taiwan .............................................. 58 Table 4.5-10. Linear regression results between fan numbers and ARPU of the telecommunications industry in Taiwan ........................................ 59 Table 4.5-11. Analysis description of the fan-page effect by customer growth of the airline industry in Taiwan .............................................. 59 Table 4.5-12. Correlation coefficients between fan numbers and customer number in the airline industry in Taiwan ............................................. 59. Ch. engchi. i Un. v. Table 4.5-13. Linear regression results between fan numbers and customer number of the airline industry in Taiwan ............................................. 60 Table 4.5-14. Analysis description of the fan-The page effect by customer loyalty of the airline industry in Taiwan ............................................... 60 Table 4.5-15. Correlation coefficients between fan numbers and passenger capacity in the airline industry in Taiwan ............................................ 60 Table 4.5-16. Linear regression results between fan numbers and passenger capacity of the airline industry in Taiwan ............................................ 61 9.
(10) Table 4.5-17. Analysis description of the fan-page effect by customer growth of the banking industry in Taiwan ........................................... 61 Table 4.5-18. Correlation coefficients between fan numbers and Credit Cd. in Circu in the banking industry in Taiwan ........................................... 62 Table 4.5-19. Linear regression results between fan numbers and Credit Cd. in Circu of the banking industry in Taiwan ........................................... 62 Table 4.5-20. Analysis description of the fan-page effect by customer loyalty of the banking industry in Taiwan ............................................ 62 Table 4.5-21. Correlation coefficients between fan numbers and CreditCard No.in For. in the banking industry in Taiwan ........................................ 63 Table 4.5-22. Linear regression results between fan numbers and CreditCard No. of the banking industry in Taiwan ............................... 63 Table 4.5-23. Analysis description of the fan-page effect by customer satisfaction of the banking industry in Taiwan .................................... 64. 政 治 大 Table 4.5-24. Correlation coefficients between fan numbers and Credit 立 Card_Stop in the banking industry in Taiwan ...................................... 64 ‧. ‧ 國. 學. Table 4.5-25. Linear regression results between fan numbers and Credit Card_Stop of the banking industry in Taiwan ...................................... 64 Table 5.1-1. Finding of six hypotheses in this study..................................... 66 Table 5.2-1. Research results of 16 global firms .......................................... 67 Table 5.2-2. Research results of 58 global firms .......................................... 68. y. Nat. sit. n. al. er. io. Table 5.2-3. Research results of firms in Taiwan .......................................... 69 Table 5.3-1. Research results about customer satisfaction by industry in Taiwan .................................................................................................. 69 Table 5.4-1. Research results about customer growth by industry in Taiwan .............................................................................................................. 70 Table 5.6-1. Research results about customer loyalty by industry in Taiwan .............................................................................................................. 71. Ch. engchi. 10. i Un. v.
(11) List of Figures Figure 1. Research model. ............................................................................ 20. 立. 政 治 大. ‧. ‧ 國. 學. n. er. io. sit. y. Nat. al. Ch. engchi. 11. i Un. v.
(12) Chapter 1: Introduction 1.1 Compendium of social networks The number of users of social networks is growing exponentially. The population of the social network grew from 100 million in August 2008 (Zuckerberg 2008) to more than 800 million at the end of 2011 (Ostrow 2011). Worldwide social media revenue is gradually reaching a total $10.3 billion in 2011 and expected grow to $14.9 billion in 2012 (Gartner 2011). Facebook, the most popular social network, has an estimated 770 billion page views each month (pingdom.com 2011). This powerful social networking medium appears to be a great opportunity for enterprises to extend their reach to customers. Social networks provide web-based services (Betonio 2010) that allows users to construct public or semi-public profiles, communicate lists of users with whom they share a connection, and view and traverse both their and others’. 政 治 大 lists of connections (Danah and Nicole 2007). People use social networks like 立 Facebook, twitter, Plurk, and Linkedin to make friends, share photos, express ‧. ‧ 國. 學. opinions, play games, and exchange a network of information in real time. Meanwhile, enterprises use these social platforms to spread information, promote new products, and interact with customers. For example, T-Mobile's (unrulymedia.com, 2009) shared with customers on YouTube and Facebook a video of commuters dancing at Liverpool Street Station in London: The video spread through social networks and. y. Nat. sit. n. al. er. io. generated over 21 million views on YouTube in three days (viralblog 2009). They then held dancing activities in Trafalgar Square to involve everyone in the square. This activity attracted more than 18 million video plays, 20,649 comments, and an increase in sales by 22%. With the maturing of cloud computing, networking, and communication, users have developed different behaviors and are now spending substantially more time on online networking (InsightXplorer 2011). According to a Nielsen report (Nielsen 2011), Americans spent 53.5 billion minutes a year on Facebook. In Taiwan, a high-internet-usage country, the reach rate of social networks is over 94% (12.3. Ch. engchi. i Un. v. million). In other words, people in Taiwan spend 508 minutes (31.5% of Internet usage) using social networks (InsightXplorer 2011). The social networks have a strong influence on consumers (Los Angeles Times 2011) and play such an important role in people’s lives that it can reach more people than any other channel. More enterprises have invested resources in social networking operations (inside.com 2010); the operating methods include operating a fan page, building photo or flash plug-in fan pages, developing applications, and placing attractive advertisements on Facebook. For this reason, many companies own a professional group in charge of 12.
(13) managing their social network. The budget for social network advertising accounted for a higher percentage than in the previous year (Business Next 2011). In the United States, the U.K., France, and Germany, the price per click of a Facebook advertisement increased by 74% in 2011 (TBG Digital 2011). Regardless of the positive or negative effects, user experiences circulate quickly, and brand value could change in only a few minutes. For example, users posted, “Dell posts wrong price, and they don’t perform it!” on a personal blog or social network, and the information caused a negative brand word-of-mouth (WOM) rise from 100 to more than 1,000 records (iBuzz 2009). Because of the fast and immense network effect, the “Brand Community” on social networks is one of the more influential groups that could have an impact on the minds of users (Huang & Chang 2007). Major enterprises on Facebook use the platform as part of a joint marketing strategy (WaveMetrix 2010). Top brands use Facebook for different purposes; Coca-Cola uses it to reach the youth market, Disney sells film tickets, and. 政 治 大 McDonald's uses it to introduce products nationally (Yi Chung et al 2010). 立 Although we see such influence by social networks, businesses remain uncertain ‧. ‧ 國. 學. on the value of investing in social networking. On the one hand, people believe that social networking can be beneficial for communication, product selling, image building, and customer services. On the other hand, reports (http://blog.shanger.net/ 2009, Manpower 2010, eMarketer 2010, http://techorange.com/ 2011) have detailed enterprises losing interest in maintaining communication with customers through. y. Nat. sit. n. al. er. io. social networks; some enterprises (TEEMA 2010, Chen 2011) believe that social networks generate limited benefits. These businesses (Hiscox 2011) do not believe it necessary to maintain a social network presence and invest too much effort into it. One explanation for the hesitation to invest in social networking is that firms may not manage well the interactions with customers on social networks. In fact, certain firms that have invested in social networking have concerns on what to invest and how to measure the capability of managing the social network. With the uncertainty of both the capability of managing social networks and the possibility of the social networks’ effects, building a clear understanding of the management and impact of this type of. Ch. engchi. i Un. v. platform is necessary. 1.2 Research motivation and research question The research objective is to determine the relationship between the capability of managing social networks and the impact of social networks on business performance. To understand clearly the effect of social networking, we chose enterprises’ fan pages on Facebook as the study field. Facebook is currently the most popular and functional social network (Nielsen 2010), and Facebook created pages for enterprises to invite 13.
(14) users to become members of their fan page, and member users can show friends their product/service preferences and recommend them by adding Pages to their personal profiles (Facebook 2011). The information is posted on the user’s wall and broadcasted to all friends. In addition, users can view friends’ joined fan pages and be aware of their interactions on these fan pages. For enterprises, a fan page can send updates to an unlimited number of people, and help enterprises keep up with customers (Direct Creative 2011). To verify the effectiveness of fan pages on Facebook, this research uses fourstages of empirical study. The first stage is to build general findings by selecting 16 global cases and collecting their fan page information through publicly available data sources, including fan page performance from Facebook insights and annual revenue reports and examining the relationship between these two items. The second stage is to verify the fan page effect by total revenue of 58 global enterprises; the third stage is to verify the fan page effect by total revenue of 11 firms in Taiwan, and base on the. 政 治 大 finding, some interesting differences in the various industries have lead us to test the 立 benefit hypotheses in greater depth in telecommunications, airline, banking credit ‧. ‧ 國. 學. cards and convenience store in forth stage, to seek patterns of benefit generation in the different dimensions.. n. er. io. sit. y. Nat. al. Ch. engchi. 14. i Un. v.
(15) Chapter 2: Literature Review 2.1 The capability to manage a fan page The social media phenomenon has introduced new channels and methodologies that drive and enhance enterprise marketing and customer services. Because social networking has spread among consumers and organizations, the capability to manage and use social media is critically required by enterprises (Briones et al. 2010). When firms fail to engage their customers in a social network, they also fail to fully exploit the capacities of social media platforms (Culnan et al. 2010). Although barriers to adopting social networks are substantially lower than for most other communication and branding channels, the resources invested by enterprises to manage social networks by enterprises have a price (Solis 2010). The resources required by enterprises to manage social networks are for establishing the platform, maintaining operations, developing content and activities,. 立. 政 治 大. ‧. ‧ 國. 學. promoting the platform, interacting with customers, storing and analyzing customer knowledge, and most importantly, leveraging customer knowledge for business decisions. When more time and resources are invested in managing fan pages, interaction increases (Torsten et al. 2011). Because the objectives of the fan page are not only for retaining a relationship (Lin & Lu 2011) with current customers but also for creating selling opportunities (Shih 2009) and interacting with prospective. y. Nat. sit. n. al. er. io. customers (Parent et al. 2011), measurements of the effectiveness of the fan page management capability should consider the engagement and attention of customers. Factors including the reach, referrals, activities and interactions of the fan page are key indicators for reflecting the management capability because customer-attracting content, interaction, and service design is crucial to increasing the patronage of the fan page.. Ch. engchi. i Un. v. 2.2 Impacts of a fan page on business performance The establishment of fan page impacts internal and external business practices. The published information and interactive communication can prompt purchases of the firm’s products and/or services. The interactive activities can also increase brand awareness among both current and prospective customers. Additionally, the personalized service and interaction enhance customer satisfaction, and customer feedback can provide important inputs for the product development process. Revenue from products/services Creating a Facebook fan page is the quickest and easiest method for establishing a web presence for a new product (Guy 2011). Consumers create, modify, share, and 15.
(16) discuss product content on the social network platforms (Kietzmann et al. 2011). Product recommendations on social networks can influence people’s purchase intentions (Hsiao et al. 2010). Increasing numbers of enterprises are creating, operating, and managing their own Facebook fan pages. In 2010, Milk-Bone used a service dog named Noble; by creating activities to promote products to fans on the Milk-Bone's service-dog star fan page, they increased revenue by 16% in North America (mediapost 2010). Word-of-mouth (WOM) also has a considerable impact on customers’ churn and purchase decisions. Users’ interest and attitudes regarding products directly predict their purchase intentions and indirectly determine the product’s persuasiveness (Prendergast et al. 2010). Thus, social networks can have a positive influence on a company's possibilities for increasing revenue through product sales (Vale and Guimaraes 2010). Therefore, we propose the following hypothesis: H1: The better the fan page managing capability, the higher the product sold.. 立. 政 治 大. ‧. ‧ 國. 學. Customer satisfaction Enterprises invest in product and service quality to increase customer satisfaction. On social networks, customers evaluate and comment on products and services. This feedback can assist firms in identifying weaknesses and strengths, and generate ideas for improvements (Wirtz et al. 2010). Social networks can be used to enhance user interaction, motivate customers to discuss their experience, and enable workers and. y. Nat. sit. n. al. er. io. managers to receive customer feedback (Gorry et al. 2011). The content and responses on a Facebook fan page can influence customers’ impression of product and service reliability. For example, 7-Eleven responded to product complaints on its fan page by rapidly resolving the issues, which satisfied their customers satisfied, resulting in growing loyalty (Vision 2011). Therefore, based on this perspective, we propose the following hypothesis: H2: The better the fan page management capability, the higher the customer satisfaction.. Ch. engchi. i Un. v. Customer growth An enterprise must understand consumer needs and motivations, promote member participation, and motivate members to cooperate by ensuring they feel included and empowered (Porter et al. 2011). When users receive appealing content, they tend to share or forward it, and may even invite it. The emergence of Internet-based social media has enabled one person to communicate with hundreds or thousands of people regarding products, designers, and manufacturers. The impact of consumer-to-consumer communications in the 16.
(17) marketplace has greatly increased (Mangold and Faulds 2009). Through WOM, potential members can be linked through existing members and may subsequently join the site (Trusovet et al. 2009). Enterprises can increase their fans and engage more potential customers of varying levels by initiating activities on a social network fan page. Thus, we propose the following hypothesis: H3: The better the fan page management capability, the greater the customer growth. Brand awareness The attitudes, strategies, and behaviors of market brands are affected by their relationship with the fan page site (Ho Chia-Hui 2010). Social media provides an unparalleled platform for consumers to publicize their personal evaluations of purchased products, thereby facilitating WOM communication. It has a crucial influence on brands. Profit-seeking organizations have used these platforms to launch. 政 治 大 products and strengthen existing brands (Waters et al. 2009, Mangold and Faulds 立 2009). ‧. ‧ 國. 學. Enterprises may use numerous tools to spread ideas and increase brand awareness. Nowadays, brands resource social media by joining online communities, sharing videos, and interacting with customers, which has gradually reduced traditional brand-building routes (Fournier and Avery 2011). Social networking tools are employed to enhance consumer-to-consumer communications and create virtual. y. Nat. sit. n. al. er. io. and viral marketing. Viral marketing, analogous to the spread of pathological and computer viruses, use social networks to increase brand awareness by self-replicating the viral diffusion of messages (Kiss and Bichler 2008). For example, UNIQLO used the tools on fan pages to create a game and several interesting activities to attract people. Through WOM, the number of users participating in the games reached 630,000 in two weeks in Taiwan (Today Weekly 2010, Digital Times 2010). Therefore, we propose the following hypothesis: H4: The better the fan page management capability, the higher the brand awareness.. Ch. engchi. i Un. v. Customer loyalty A firm's ability to obtain profitable customer relationships relies on its capability to take advantage of information obtained through successive customer interactions (Ramani and Kumar 2008). Social networking sites provide firms with opportunities to strengthen customer relationships through the site content and services (Pagani et al. 2011) and by co-learning, co-production, and collaboration activities (Marianna 2011). The new breed of customer requires corporate transparency, authenticity, and 17.
(18) interaction (Paul 2010). To reach this intelligent and aggressive social consumer, a greater insight than that of the past is necessary. Social tools, such as Facebook insights, Google trends, and social media statistics, provide the tools for creating social media channels (Paul 2010). A fan page enables more companies to build virtual customer environments, resulting in broader and more profound implications for customers (Nambisan and Nambisan 2008). Virtual customer environments provide services ranging, enabling firms to involve their customers in innovation and value creation. Best Buy’s employee communities increased to 2,200 members within 3 months; they interacted with over 13,000 customers on its fan page, responding to questions, concerns, and opinions from the public (Rob Petersen 2011). Increasing employee-customer interactions can enhance the connection between firms and customers, building strong relationships with customers. Thus, we propose the following hypothesis:. 政 治 大 H5: The better the fan page management capability, the better the customer loyalty. 立 ‧. ‧ 國. 學. Product development Successful product development depends on satisfying the needs of diverse customers. The ability of firms to interact successfully with their customers distinguishes them from their competitors (Ramani and Kumar 2008). Firms can benefit from involving customers in developing new products (Svendsen et al. 2011,. y. Nat. sit. n. al. er. io. Sioukas 1995). Collecting user feedback and monitoring user interaction on fan pages (Nambisan and Baron 2010) is a method to explore customers’ needs. Analysis and inference from communication records are effective methods to transfer customer insight to the development of new products and services. Furthermore, encouraging customers to adopt a more active role in new product development (Ernst et al. 2010) is a useful strategy to obtain ideas from fan page activities. Social networking allows companies to build strong online communities for feasible customer empowerment where they can listen to and integrate thousands of customers from all over the world (Fuchs and Schreier 2011).. Ch. engchi. i Un. v. Customer participation is contingent on the customer contribution context (Fang et al. 2008, Nambisan & Baron 2010), whether the contributions are to the customer community (through product support) or to the company (through product ideation). The sales of Toyota’s new Yaris model in 2008 were the highest in the market, which can be attributed to information collected from initiating activities on Facebook fan pages (NOWnews 2008). The cost-efficient and multimedia-rich interaction opportunities offered by social networks and the existence of online communities have made virtual co-creation a suitable means of creating value and improving the 18.
(19) success of new products (Fuller et al. 2009). Based on literature regarding customer contribution to product development, we propose the following hypothesis: H6: The better the fan page management capability, the more successful the product development.. 立. 政 治 大. ‧. ‧ 國. 學. n. er. io. sit. y. Nat. al. Ch. engchi. 19. i Un. v.
(20) Chapter 3: Methodology 3.1 Research model The research objective is to understand the impacts of fan-page management on business performance. By examining business goals and required resources of fan pages, we formulated several indicators of their management capability. Based on literature and practical cases, we formed hypotheses on the relationship between fan-page management capability and various business benefits (shown in Fig. 1).. 立. 政 治 大. ‧. ‧ 國. 學. n. er. io. sit. y. Nat. al. Figure 1. Research model.. Ch. engchi. i Un. v. To verify our hypotheses in an industry-specific environment, this research was conducted in four-stages. To clarify the overall research, we summarized a research-purpose table (see Table 3.1-1) that includes the scope of data collection of each stage, and the verifications and statistical methods used in each stage. The first stage was to collect data of global enterprises from different industries and develop characteristically classified findings on the relationship between fan-page management and business revenue. Based on these findings, in the second stage, we then selected enterprises from different global industries to make a longitudinal analysis and test the hypotheses within and across the industry to create a deeper understanding of fan-page effects. In the third stage, this study putted focus on firms in Taiwan and tested the fan-page effect by total revenue. Finally, this study performed other hypotheses verification by industry in Taiwan, finding a suitable 20.
(21) operational model on fan pages within different kind industries. Table 3.1-1. Descriptions of research stages Stage. Scope of Data Collection. Purpose. Hypotheses Verified. I. To build a • Collected annual data • Fan page & general from 16 global cases product sold understanding from 2008 to 2011 of the fan-page effect on global enterprises. II. To understand the fan-page effect by industries of global firms. • Collected annual data • Fan page & from 58 global cases product sold in 5 industries - Food • Fan page & & beverage, Clothing brand value & Accessories, Retail, Technology, Automobile from 2008 to 2011. • Linear regression. • Collected monthly. • Linear. 立. 政 治 大. n To test other hypotheses by industry. Ch. y. product sold. i Un. v. • Collected monthly • Fan page & data from 11 cases in customer Taiwan from April satisfaction 2010 to January 2012 • Fan page & customer growth • Fan page &. engchi. regression. sit. io. al. • Fan page &. er. ‧ 國 Nat. data from 11 cases in Taiwan from April 2010 to January 2012. ‧. To understand. the fan-page effects in detail. IV. • Spearman's rank correlation coefficient. 學. III. Statistical Method. • Linear regression. customer loyalty 3.2 Research variables The research variables are listed in Table 1 with a few operational indicators reflecting the value of the variables. Sources for collecting the indicators include http://www.socialbakers.com and http://monitor.wildfireapp.com,established in 2010 that track the number of fans, total reach, daily page activity and daily fan-page interaction. These sources also provide an annual report with information on products, 21.
(22) revenue, customers, and published reports such as A.C. Nielsen’s, a third-party evaluation of the firm’s brand value. Table 3.2-1. Research variables Research Variables. Operational Definition. Indicators. Sources. The management capability of fan pages. How enterprises build fan pages, share content , engage with customers and. •. http://www.socialbaker s.com http://monitor.wildfire app.com/. • •. maintain customer • engagement. The number of fans Total reach Total page activity Total interaction. The product’s sells Total sales. Customer satisfaction. 立. Customer satisfaction The attrition rate. To retain customers and increase customer contribution.. n. al. Ch. Average Revenue Per User (ARPU). Annual report. er. io. Customer Loyalty. y. Nat. customers with quality services.. The enterprise. sit. To satisfy customers by providing. Annual report. ‧. Product sold. Annual report. 學. Acquired more customers. ‧ 國. 治number 政Customer 大. Customer growth. engchi. i Un. v. Product development. To make products that fit customer needs.. Product achievement rate. The enterprise. Brand. To improve the. Brand value. Published report. awareness. brand value of enterprises.. This research uses the four independent variables—number of fans, total reach, daily page activities, and total interaction—for measuring fan pages. Initially, enterprises like to establish platforms and channels on social networks, such as fan pages on Facebook, to engage and provide customers with an easy-access platform. Customers can use the platform to easily communicate with people and access 22.
(23) information. To establish the fan page’s effectiveness, this research uses the number of fans and total reach to measure them. The number of fans means the number of people who become fans of this brand or enterprise; total reach means the total number of people who mention this brand on Facebook. After establishing the platform, the contents of the page are required. More important, enterprises should initiate activities and provide content that enable them to retain fans, promote frequent visits and long stays, encourage fans to read, respond, and provide frequent suggestions, and collect customer information for the long-term run of the page. To measure content provision, this study used total reach and totalpage activities—total page activities is the daily post (news, videos, and photos) on Facebook provided by enterprises. Enterprises must also provide customer service through fan pages to solve fans’ problems and ensure that customers are satisfied. To measure customer service on Facebook, we used total interaction, which includes the number of likes and fan. 政 治 大 comments for the content provided. 立 Enterprises should also ensure the continued running of the fan page and use ‧. ‧ 國. 學. platform promotion to encourage more customers to join. Customers would then recommend the page to others. To measure platform promotion, we used the number of fans and total reach.. n. al. er. io. sit. y. Nat. 3.3 Data collection The general findings on the effectiveness of fan-page management in different industries are useful. We used the number of fan pages as an indicator of the management capability of the fan page and business revenue as a simple indicator of the business performance. The number of fans is derived from http://monitor.wildfireapp.com, a website that analyzes social networks, and the business performance is retrieved from the firms’ annual reports. Data collected in our researches are mainly publicly available data of enterprise fan pages. We chose 16 cases for non-parametric statistics (see Table 3.2-1) in stage one, by analyzing the pattern of business revenue and number of fans, we formed. Ch. engchi. i Un. v. general findings on the relationship between fan-page management and business performance. Using findings on product types and product durability, we selected 58 global enterprises for linear regression (see Table 3.2-2) in stage 2. We also collected brand value form 38 global cases for statistical test (see Table 3.2-3) in stage 2. These enterprises were chose because they are all in the Fortune 500 global enterprises (all enterprises are listed in the Appendix), with different product durability and variant product types. We classified the information according to the following criteria. 1. The degree of their operation on the Facebook official fan page. We selected 23.
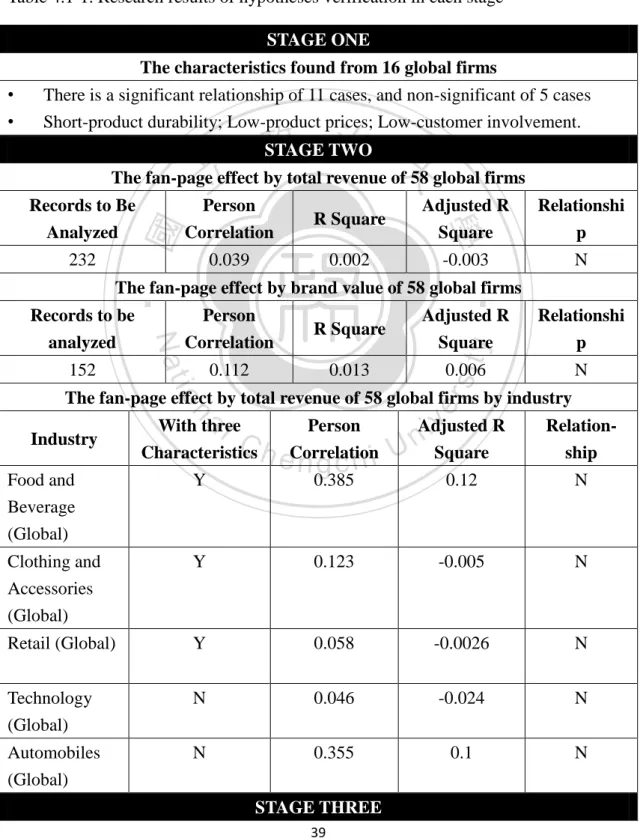
(24) enterprises with their own fan pages that had more than a half-million fans in 2011. We needed to ensure that the number of fans was enough to reflect on revenues. The more fans the company owns, the more accurate the customer opinion represents. 2. Observations on annual finance reports. This condition was based on whether or not the enterprises released a public financial report from 2008 to 2011. The annual reports give us the total-revenue information and are used as a dependent variable in our research. 3. Does the enterprise have independent brand in the market? We chose enterprises with their own market brands. We used these three conditions to select the following enterprises and took them as our objects. Table 3.3-1. 16 global cases for non-parametric statistics Enterprises. Industry. Data. Coca-Cola. Food &. # of Fans. 立. Retailer. Retailer. Nike. ZARA. Apparel. Apparel. Apparel. 71.8. (3). (4). 10(million). 15(million). 26(million). (1). (2). (3). 10.7(million). 11.7(million). (1). (2). y. sit. (3). 6.8(3). 12.1(4). 24(2). 27(3). 2(3). 11(4). 255(2). 258(3). 260(4). 3(#)*10. 10(#)*10. 15(#)*10. (1). (2). (3). 101.7. 114.6. 120.3. (1). (2). (3). # of Fans. 1(1). 8.31(2). 8.78(3). TR. 17.58(1). 18.81(2). 18.87(3). # of Fans. 0.6(1). 2(2). aTRl. 23.5(1). 22.7(4). Ch. # of Fans. er. (1). v ni. 0.6(2) e0.1(1) ngchi U 238(1). # of Fans. TR. H&M. 70.4. 68.7. 9.7(million). TR 7-11. (4). 66.6. TR. n. Walmart. (3). (2). io. Beverage. 35. (2). # of Fans. Nat Food &. 23.4. (1). Beverage. McDonald's. 2011. ‧. Food &. TR. 2010. 學. Starbucks. ‧ 國. Beverage. 政2008 治 2009大 1 6.7. # of Fans. 0.3(1). 1.2(2). 4.3(3). 9.1(4). TR. 18.627. 19.176. 19.014. 21.77. (1). (3). (2). (4). # of Fans. 0.7(1). 2.35(2). 7.77(3). 10.8(4). TR. 9.4(EUR). 10.4(EUR). 12.53(EUR). 14.7(EUR). (1). (2). (3). (4). 24.
(25) 0.02(1). 0.1(2). 0.3(3). 1.1(4). TR. 17.54(EUR). 17.43(EUR). 19.5(EUR). 20.1(EUR). (2). (1). (3). (4). 1(#)*10. 3.3(#)*10. 6.3(#)*10. 8.3(#)*10. (1). (2). (3). (4). 118.364. 118.369. 126. 127.2. (1). (2). (3). (4). 0.007. 0.01. 0.35. 5.72. (1). (2). (3). (4). 121. 119. 135. 159. (2). (1). (3). (4). # of Fans. 0.32(1). 1.2(2). 2.6(3). 4.8(4). TR. 50.7(EUR). 40.9(EUR). 42.4(EUR). 51(EUR). (2). (4). 3.6(#)*10. 15(#)*10. (3). (4). 93.6. 93.2. # of Fans. Packard TR. Samsung. Electronics. # of Fans. TR. SONY. # of Fans. (2). 115.1. 100.3. (4). (3). (2). (1). # of Fans. 0.1(1). 0.386(2). 1.75(3). 4(4). TR. 34.1(EUR). 29.8(EUR). 35.4(EUR). 32.4(EUR). # of Fans. 0.2(1). 1.3(2). 3.2(3). 6.5(4). TR. 80.4(JPY). 32.7(JPY). (4). (2). TR. Automobile. io Automobile. al. n. Ford. # of Fans TR. Ch. 0.1(1). e146.3 ngchi (4). ‧. Automobile. (1). Nat. Toyota. 立. Electronics. 政 (3) 治 (1)大 0.1(#)*10 1.3(#)*10. 學. Audi. Electronics. ‧ 國. Nokia. y. Electronics. # of Fans. sit. Hewlett-. FMCG. 26.2(JPY). er. L'Oreal. i n U 118.3 4(2). v. (1). 47.2(JPY). (1). (3). 11.3(3). 23.9(4). 128.9. 136.3. (2). (3). *The unit of # of fans: (million)*1000; *The unit of total revenue: (billion) in US$ *TR=Total revenue Table 3.3-2. 58 global cases for linear regression Enterprises Coca-Cola. Industry. Data. 2008. 2009. 2010. 2011. Food &. # of Fans. 30,000. 5,329,093. 21,535,556. 36,575,792. Beverages. Total 66,600. 68,700. 70,400. 71,800. 0. 6,536,632. 19,016,575. 26,557,049. 10,400. 9,700. 10,700. 11,700. Revenue Starbucks. Food &. # of Fans. Beverages. Total Revenue 25.
(26) McDonald's. Food &. # of Fans. Beverages. Total. 50,998. 2,050,623. 6,711,501. 12,213,017. 23,500. 22,700. 24,000. 27,000. 10,055. 96,245. 757,874. 2,378,115. 2,455. 2,537. 2,502. 2,455. 96,612. 823,042. 874,933. 5,009,675. 18,772.4. 19,273.2. 21,150.5. 22,448.4. 32,255. 250,000. 2,962,454. 6,889,396. 43,251. 43,232. 57,838. 66,504. 6,533. 880,311. 2,722,307. 3,503,016. 2,522. 2,798. 1,692,431. 2,970,877. Revenue Burger king. Food &. # of Fans. Beverages. Total Revenue. Heineken. Food &. # of Fans. Beverages. Total Revenue. Pepsi. Food &. # of Fans. Beverages. Total Revenue # of Fans. Beverages. Chicken) Food & Beverages. Total. # of Fans. Eagle. Accessories. Total. 684,000. 3,159.8. 2,967.6. 47,122. 253,668. Nat. Revenue. Clothing &. io. Accessories. 32,096. # of Fans Total. 2,251.9 2,083.6 aRevenue iv l C n U h e n90,113 # of Fans g c h i 552,673. n. GAP. Clothing & Accessories. 5,671.0. 6,080.8. 3,493,325. 5,750,911. 2,940.3. 2,948.7. ‧. Clothing &. HUGO BOSS. 5,298.7. Revenue. America. Outfitters. 5,132.8. 學. ‧ 國. HERSHEY'S. y. y Fried. 治 Total 政 2,179 2,297 大 Revenue 立# of Fans 50,177 843,701. sit. Food &. 511,138. 886,419. 2,307.0. 2,746.4. 1,239,002. 1,828,814. er. KFC(Kentuck. Total. 14,526. 14,197. 14,664. 14,549. 19,160. 512,543. 1,546,195. 2,755,611. 5,707. 5,808. 5,905. 5,674. 371,602. 1,489,334. 3,592,034. 6,015,235. 2,607.6. 2,807.6. 2,862.1. 3,009. 20,776. 321,748. 1,641,699. 2,947,883. 20,776. 321,748. 1,641,699. 2,947,883. 10,799. 10,381. 11,990. 13,344. Revenue Old Navy. Clothing &. # of Fans. Accessories. Total Revenue. Puma. Clothing &. # of Fans. Accessories. Total Revenue. Adidas. Clothing &. # of Fans. Accessories. Total Revenue. Hollister Co.. Clothing &. # of Fans. 26.
(27) Accessories. Converse. Total Revenue. 630,121. 1,034,997. 3,999,136. 6,411,366. Clothing &. # of Fans. 3,484.1. 2,928.6. 3,468.8. 4,158.1. Accessories. Total 10,299. 10,799. 10,381. 11,990. 18,000. 679,103. 10,336,621. 20,805,109. 10,299. 10,799. 10,381. 11,990. 870,622. 2,403,987. 3,673,357. 10,103,213. 1,577.0. 1,903.6. 2,027.8. 2,378.5. 599,023. 1,760,229. 3,475,846. 5,795,506. 3,468.7. 4,158.1. 2,654,349. 9,561,097. Revenue Burberry. Clothing &. # of Fans. Accessories. Total Revenue # of Fans. Abercrombie Clothing & & Fitch. Total. Accessories. Revenue Clothing &. # of Fans. 治 2,928.6 政 3,540.3 大 Revenue 立# of Fans 90,000 1,077,895. Accessories. Total. ‧ 國. # of Fans. Accessories. Total. Accessories. Total. io. # of Fans. Service. 1,329,018. 4,880.1. 5,018.9. 4000. 69000. 66,000. 7,010,039. 4,400. 4,760. 2,189,537. 4,189,029. 4,978.9. 5,660.3. y. aRevenue iv l Fans 3,180 n # ofC 3,230 hengchi U. n. Express. 70,000. Revenue. Clothing &. Finance. 4,100. ‧. Clothing &. American. 4,400 Revenue. Nat. ASOS. Total. 學. Coach. Accessories. 381110. 1496702. 1,486,318. 2,612,183. 3,607. 4,158. sit. Clothing & Ralph Lauren. er. Levi’s. Total. 4,000. 69,000. 381,110. 1,496,702. 128. 262. 353. 538. 3,089. 92,029. 310,165. 2,349,923. 15,025. 13,389. 27,582. 29,962. 67,000.0. 334,000.0. 716,968.0. 1,637,690.0. 2,860. 2,709.7. 3,085.3. 3,642.9. 1013.17. 975.89. 898.93. 1005.79. 71,303. 483,921. 502,294. 5,669,829. Revenue Tiffany & Co.. luxury. # of Fans Total Revenue. Dior. Cosmetics. # of Fans Total Revenue. Six Flags. Travel &. # of Fans. Leisure. Total Revenue. AirAsia. Travel &. # of Fans. 27.
(28) Leisure. Total 23,917.2. 32,846.4. 28,171.7. 23,666.5. 23,000. 530,122. 946,750. 1,385,719. 71,165. 475,219. 1,041,198. 2,330,892. 1,013.2. 975.9. 898.9. 1,005.8. 27,120. 214,698. 803,531. 1,327,941. 931.9. 1,022.7. 1,288.7. 1,460.1. 23,000. 530,122. 946,750. 1,385,719. 9,526. 11,661. 16,014. 18,731. 63,435. 65,786. 2,889,394. 11,145,395. 25,800. 26,000. 1,022,856. 1,595,314. Revenue # of Fans LEGO Toy Retail. Total Revenue. Walmart. Retail. # of Fans Total Revenue. 7-11. Retail. # of Fans Total Revenue. Target. Retail. # of Fans Total. 政 61,471治 62,884 大 # of Fans 12,008 803,706 立Total Revenue. Retail. Retail. 0. 326,544. 102. 101. 76,182. 1,006,159. 61,471. 62,884. Total. # of Fans Total. io. Revenue. a#l of Fans 6,091 97,940i v n C U Total h e i h n48,230 g c 47,220. n. Amazon.com. Retail. 114.6. 120.3. 3,561,513. 7,928,640. y. Revenue. sit. Retail. # of Fans. Nat. Tesco. 25,500. ‧. Depot. 23,800 Revenue. 學. The Home. ‧ 國. Improvement. er. Lowe's Home. 63,435. 65,786. 494,901. 786,009. 48,815. 50,208. Revenue. Walgreens. Drug retail. # of Fans. 10,348. 33,339. 206,313. 505,401. 2,260. 2,661. 3,338. 3,883. 54,312. 109,026. 260,072. 480,460. 75,513.6. 86,050.9. 90,859.7. 97,279.4. 4,300. 25,232. 484,365. 2,203,557. 19,166. 24,509. 34,204. 48,077. # of Fans. 40,124. 473,213. 799,005. 1,384,748. Total. 59,034. 63,335. 67,420. 72,184. Total Revenue Best Buy. Retail. # of Fans Total Revenue # of Fans. Internet eBay Service. Total Revenue. Google. Technology. 28.
(29) Revenue # of Fans. 306,170. 1,118,567. 2,080,895. 5,548,506. 40,023. 45,015. 49,694. 50,272. 12,000. 87,000. 392,786. 1,550,793. 8,541. 8,727. 28,680. 17,711. 20,146. 631,608. 2,400,964. 4,603,600. 21,796. 23,651. 29,321. 37,905. 19,033. 870,450. 1,101,091. 2,017,541. 97,354. 107,808. 106,565. 110,875. 政 20,037治 109,913 大. 253,716. 1,033,749. 62,484. 69,943. Verizon Technology. Total. Wireless. Revenue Microsoft. Technology. # of Fans Total Revenue. Dell. Technology. # of Fans Total Revenue. Nikon. Technology. # of Fans Total Revenue. 58,437. # of Fans. 6,219. 107,329. 61,133. 61,000. 32,623. 172,773. 11,534. 10,616. 17,122. 99,730. Technology. Revenue. Technology. # of Fans. 917,466. 52,900. 61,500. # of Fans. aTotal l C h Revenue. Technology. # of Fans. e n552.7 gchi. ni 517.7 U. y. v. 948,536. 9,479.4. 10,711. 256,599. 619,431. 463.4. 500.8. sit. Revenue. er. Technology. 455,575. Total. n. Motorola. 400,492. Total. io. HTC. 60,420. Nat. Motion(RIM). 立Total Revenue. ‧. Research In. # of Fans. 學. Intel. Technology. ‧ 國. SEGA. 24,409. 73,186. 286,592. 4,437,063. 37,600.0. 35,127. 43,623. 53,999. 10,144. 536,246. 2,784,750. 4,041,397. 37,995. 490,887. 4,421,950. 8,929,765. 6,009. 11,065. 14,953. 19,907. 10,679. 97,002. 386,162. 1,051,647. 5,116.1. 4,798.4. 9,361. 15,641.7. 20,976. 217,208. 291,514. 860,011. Total Revenue Audi. Automobiles. # of Fans Total Revenue. Toyota. Automobiles. # of Fans Total Revenue. Ford. Automobiles. # of Fans Total Revenue. 29.
(30) Honda. Automobiles. # of Fans. 17,099. 11,050. 11,460. 13,064. 10,144. 536,246. 2,784,750. 4,041,397. 45,161.4. 39,466.5. 46,883.1. 42,909.9. 21,069. 90,826. 323,858. 670,012. 10,057.8. 4,090.7. 3,277.6. 5,904.6. 24,115. 442,895. 1,137,247. 2,359,697. 14,630. 11,830. 12,890. 13,630. 69,103. 281,122. 815,654. 1,420,936. 14,824. 12,317. 10,555. 10,995. 2,103,473. 4,517,720. 71,254.3. 76,567.7. Total Revenue Mercedes. Automobiles. # of Fans. Benz. Total Revenue. NISSAN. Automobiles. # of Fans Total Revenue. KIA. Automobiles. # of Fans Total Revenue. Automobiles. # of Fans. 治 Total 政 22,770 300,564 大 Revenue 立# of Fans 63,713.5 55,105.8 Total 70,965. 67,608. 16,012. 39,208. 10,204.4. 90,920.6. 3,600. 427,455. 學. ‧ 國. BMW. Automobiles. 151,928. 456,883. 10,610.9. 107,470. # of Fans. y. Revenue. 1,209,885. 2,591,611. er. Telecommunic. io. Vodafone. Total. Nat. ations. 88,674. ‧. # of Fans. Telecommunic AT & T. 80,636. Revenue. sit. Peugeot. Total. n. 62,188 101,027 aRevenue v 192,238 1,262,076 i l C U n (million) in US$ *The unit of # of fans: (thousand); h *The e nunitg ofc total h i revenue: ations. Table 3.3-3. Brand value of 38 cases for linear regression Enterprises. Industry. 2008. 2009. 2010. 2011. Coca-Cola. Food & Beverages. 32,728. 34,844. 25,807. 31,082. Starbucks. Food & Beverages. 4,144. 5,187. 5,462. 6,750. McDonald's. Food & Beverages. 20,003. 20,193. 21,842. 22,230. Pepsi. Food & Beverages. 15,035. 15,991. 14,363. 17,096. HERSHEY'S. Food & Beverages. 1,718. 1013. 2,715. 3,053. GAP. Clothing &. 2,665. 2,246. 2,161. 2,589. 2,112. 1,493. 1,990. 2,291. Accessories Puma. Clothing & Accessories. 30.
(31) Adidas. Clothing &. 4,700. 5,702. 6,754. 7,150. 2,274. 2,952. 3,162. 3,367. Finance Service. 9,944. 12,737. 15,530. 18,231. Dior. Cosmetics. 1,438. 13,343. 2,114. 2,540. Walmart. Retail. 40,616. 41,365. 36,220. 38,320. 7-11. Retail. 6,743. 2,302. 3,905. 4,549. Target. Retail. 12,253. 15,224. 15,989. 15,267. Lowe's Home. Retail. 8,173. 9,784. 9,751. 8,882. The Home Depot. Retail. 14,310. 19,013. 20,423. 20,902. Tesco. Retail. 21,129. 20,051. Amazon.com. Retail. 17,780. 94,398. Walgreens. Drug Retail. 11,707. 11,564. Accessories Ralph Lauren. Clothing & Accessories. American Express. Improvement. Technology. 8,002. 8,959. 29,261. 36,191. 44,294. 47,463. 18,854. 23,029. 27,293. 27,616. Technology. 30,882. 33,605. Technology. 8,200. 9,750. 13,976 3,928. Technology. al Technology C Automobiles h. y. Audi. Technology. 5,148. n. Motorola. 4,026. 4,936. io. Intel. Internet Service. 6,534. 45,812. sit. Dell. 6,000. Nat. Microsoft. 4,107. 10,983. 11,605. 16,642. 19,078. 21,908. i Un. 5,585. 2,940. 3,398. 3,739. 4,561. 21,995. 27,319. 26,152. 24,461. e n g6,323 chi. 42,805. er. Verizon wireless. Retail. ‧ 國. Google. 9,983. ‧. eBay. 9,219. 學. Best buy. 立. 治 20,654 政 16,408 大 7,466 13,340. 6,254. v. Toyota. Automobiles. Ford. Automobiles. 9,822. 12,652. 16,662. 17,559. Honda. Automobiles. 11,461. 13,083. 16,356. 14,963. Mercedes Benz. Automobiles. 9,844. 13,883. 20,798. 19,762. NISSAN. Automobiles. 7,742. 10,412. 13,705. 14,167. KIA. Automobiles. 1,414. 2,264. 2,788. 5,089. Peugeot. Automobiles. 3,780. 4,485. 6,625. 7,976. BMW. Automobiles. 13,659. 16,616. 20,157. 21,262. AT & T. Telecommunications. 19,850. 26,585. 28,884. 28,379. Vodafone. Telecommunications. 24,647. 28,995. 30,674. 30,044. 31.
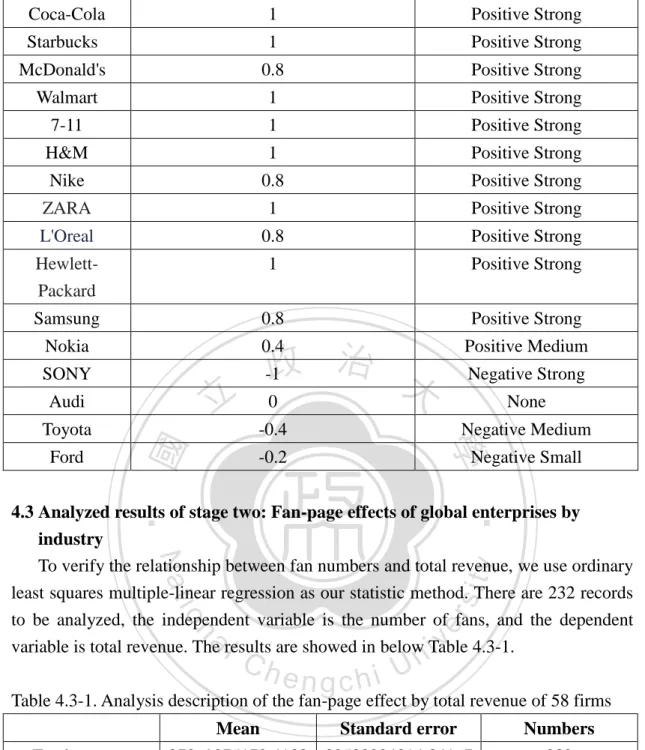
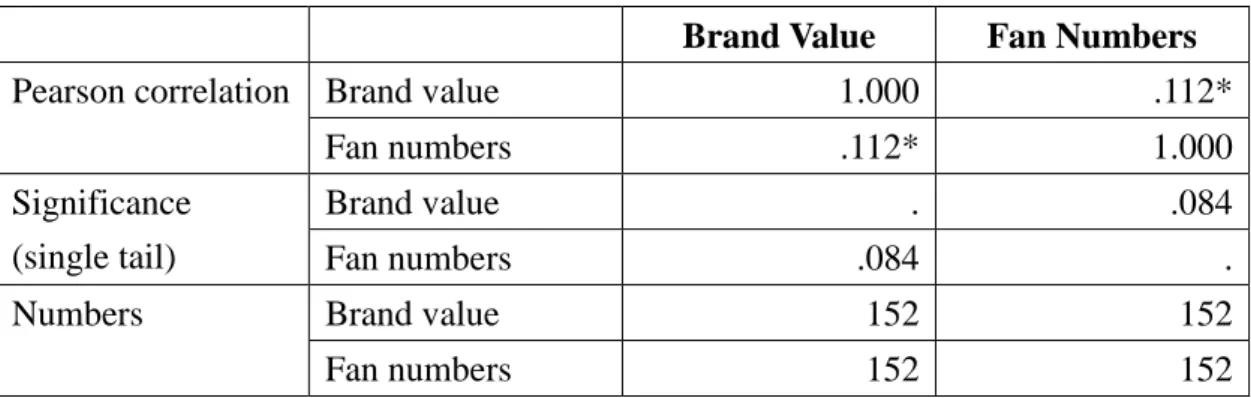
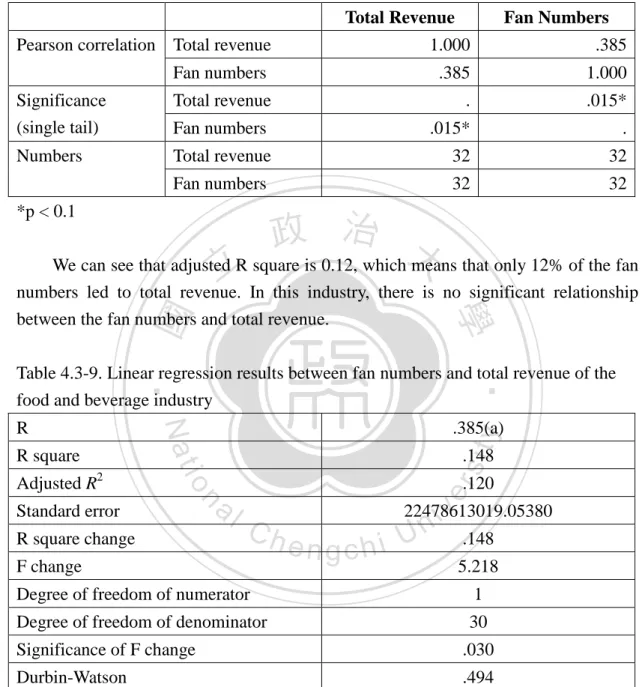
(32) For the third stage, we selected fan pages from 11 firms in Taiwan for hypothesis testing based on the findings of industries that with different abilities of fan-page management, the selected industries were convenience stores, banking credit-card services, telecommunication companies, and airline companies. These industries are all in full competition in a mature market where customers experience innovative services and have a high demand for tailored products. The detail data are listed in Table 3.2-4, 3.2-5, 3.2-6, 3.2-7, and 3.2-8. Data from fan-page management are collected from Facebook insights, and the six-dimensional benefit factors are collected from published business data, publicly accessible databases, and surveys. After analyzing data in the third stage research, we will use the 11 cases to test other hypotheses by product types, product durability and industry in the fourth stage research. However, we could not verify all of our hypotheses. In some industries, we could only verify a limited amount of data. The reasons are interpreted below.. 政 治 大. Data collection The measurements of some hypotheses could not be collected from public data such as the product-achievement rate for hypothesis 6, the attrition rate for hypothesis 2, and the customer number for hypothesis 3. These three indicators are confidential in many enterprises. Due to these reasons, we could not obtain the information from public data or through school-to-work programs, thus we could hardly verify hypotheses 2, 3, and 6 for all the cases. Independent variables such as total reach, daily page activity and daily interaction could be collected from special websites, but. 立. ‧. ‧ 國. 學. y. Nat. sit. n. al. er. io. we did not have enough in our budget to pay for their charges. Because of these difficulties, the three indicators could not be provided in our research to verify some of our hypotheses.. Ch. engchi. i Un. v. Data characteristics Some indicators only existed in specific industries like Average Revenue Per User (ARPU) for hypothesis 5. ARPU is usually used by telecommunications companies, but this information is not easily found in other industries, therefore, we could hardly measure customer loyalty in all industries and verify hypothesis 5. For the same reason, the churn rate is usually used in telecommunications, and some indicators are only used in the banking industry. Due to these reasons, we could only verify the hypotheses by the particular data we could obtain in each industry. Divergences between different industries We collected total revenue from 58 enterprises across five industries and there is a significant difference in revenue in different industries. For example, the number of revenue is related huge in automobile rather than food and beverage industry, and it 32.
(33) will lead to tremendous standard error of our records which will cause higher opportunity to reject our hypothesis. In the other way, some events in different industries may bring about influence to them. For example the credit squeeze in 2009 made a huge impact on the automobile industry, and some companies in our study went into bankruptcy, which led to some changes in their yearly revenue. However, the credit squeeze did not cause this result in other industries, hence the records in our research are not in the same comparison conditions, which impacts our statistic results. Table 3.3-4. Public data of convenience store industry. engchi. 33. y. sit. io. Ch. ‧. Nat. al. 學. ‧ 國. 立. 政 治 大. n. Apr-10 May-10 Jun-10 Jul-10 Aug-10 Sep-10 Oct-10 Nov-10 Dec-10 Jan-11 Feb-11 Mar-11 Apr-11 May-11 Jun-11 Jul-11 Aug-11 Sep-11 Oct-11 Nov-11 Dec-11 Jan-12. Family Mart Total Revenue Fans Number (thousnd) 3268256 47298 3717275 47878 3632261 50269 4003762 63138 3960021 84140 3704590 88157 3783590 94089 3547716 204520 3566106 210448 3495592 215676 3308275 222653 3507977 237736 3796799 270521 3927056 294338 3892256 314343 4186706 343323 4203710 360841 4444292 364510 4411963 376895 4145609 385498 4107737 394428 4523114 443549. er. Month. 7 ELEVEN Total Revenue Fans Number (thousnd) 8895036 355010 9686463 356135 9495227 356890 10289154 421623 10189963 673938 10040908 730190 10105227 819167 9341217 932522 9730864 1020811 9336890 1059456 9540881 1096903 9406303 1158673 9534967 1196281 10243258 1278436 10393956 1319610 10806588 1399987 10657507 1441589 10811993 1510567 10941694 1547623 10379518 1573318 10659172 1595314 11675088 1643919. i Un. v.
(34) Table 3.3-5. Public data of banking industry Union Bank of Taiwan Month. Taishin Bank. Transactio Credit Cd. CreditCard Credit Fans Transactio Credit Cd. CreditCard Credit n in Circu. No.in For. Card_Stop Number n Amt.Cred in Circu. No.in For. Card_Stop Amt.Cred. Fans Number. Apr-10. 3728278. 1658699. 947544. 13405. 0. 10716047. 3049535. 1823169. 15444. 0. May-10. 4157867. 1793987. 1023095. 25321. 0. 10657275. 2946559. 1791487. 24796. 0. Jun-10. 4192505. 1764740. 1014313. 34781. 0. 12861768. 2933887. 1788785. 32807. 0. Jul-10. 4250040. 1745592. 1004432. 25571. 0. 11375149. 2934194. 1787564. 20674. 0. Aug-10. 4651426. 1727309. 994288. 25340. 0. 12016057. 2939856. 1794309. 19501. 0. Sep-10. 3916390. 1711157. 991710. 21990. 0. 11150546. 2956256. 1788142. 19525. 0. Oct-10. 4030712. 1695790. 982082. 21289. 0. 12649512. 2958576. 1790305. 43025. 0. Nov-10. 4133349. 1688362. 980342. 13771. 0. 12505223. 2982212. 1802093. 20083. 23931. Dec-10. 4305792. 1680984. 974536. 13571. 0. 12976078. 3002853. 1819643. 21367. 24116. Jan-11. 5054595. 1681400. 967992. 15395. 0. 12935956. 3011266. 1827332. 19383. 24364. Feb-11. 3553430. 1673495. 963241. 12346. 0. 10435393. 3017134. 1819827. 14237. 24659. Mar-11. 3906580. 1666268. 952618. 13402. 145. 11732559. 3032236. 1826240. 19046. 25114. Apr-11. 3728278. 1658699. 947544. 13405. 1019. 10716047. 3049535. 1823169. 15444. 25519. May-11. 3934908. 1652384. 941153. 14297. 1210. 11518094. 3068803. 1824788. 18645. 26979. Jun-11. 3924818. 1645817. 938489. 15356. 3234. 14424295. 3086640. 1820452. 18593. 27521. Jul-11. 4179181. 1638565. 935809. 15332. 7781. 11500978. 3091098. 1822640. 30586. 27760. Aug-11. 4465628. 1634642. 933646. 14998. 8323. 13543713. 3087958. 1848331. 39794. 28554. Sep-11. 3906106. 1627906. 934633. 14827. 9192. 11994081. 3060830. 1858446. 62988. 29307. Oct-11. 4084887. 2079998. 928993. 33767. 10002. 13398894. 3035621. 1877943. 60204. 29840. Nov-11. 4061492. 2035262. 952886. 85312. 10433. 12589469. 2984368. 1891435. 88092. 30030. Dec-11. 4152054. 2068118. 981561. 73721. 12814187. 2960949. 1904510. 64190. 36035. Jan-12. 4267099. 2022063. 10964 11402. 13191548. 2924545. 1914425 59106 Bank of Taiwan. 35,974. ‧ 國. ‧. 57379. 學. 1017016 Chinatrust. Transactio Credit Cd. CreditCard Credit Fans Transactio Credit Cd. CreditCard Credit n in Circu. No.in For. Card_Stop Number n Amt.Cred in Circu. No.in For. Card_Stop Amt.Cred. Apr-10. 20945072. 4993676. May-10. 21726633. 5012321. Jun-10. 26835921. 5033476. Jul-10. 22812378. 5053523. 3472005. Aug-10. 24705751. 5071851. 3479941. Ch. Sep-10. 22255870. 5095720. 3490490. 22730. Oct-10. 22060956. 5117363. 3500046. 22560. 901. 0. 266253. v ni. 119195. 834. 0. 266512. 119222. 719. 0. 731720. 266284. 3468784. 19977. 0. 747592. 3474042. 19147. 0. 866416. n. 23989. engchi U. er. 0. io. 21724. 20372. Fans Number. 119735. 3465524. al. sit. y. Nat. Month. 立. 政 治 大. 0. 744423. 266637. 123439. 809. 0. 0. 799360. 266768. 123269. 770. 0. 3452. 721458. 266617. 122119. 907. 0. 4498. 684372. 266355. 122144. 1043. 0. Nov-10. 24057822. 5138919. 3512022. 22944. 6445. 764275. 266181. 121635. 930. 1224. Dec-10. 26439278. 5166407. 3525062. 27206. 9435. 780557. 265441. 121385. 1520. 1881. Jan-11. 25838701. 5182961. 3545504. 25630. 10032. 778571. 262767. 116099. 3588. 2429. Feb-11. 20043594. 5189076. 3555272. 22537. 19323. 655754. 262323. 115620. 803. 4225. Mar-11. 24442395. 5205124. 3552625. 26204. 30132. 735896. 262181. 115045. 1186. 5027. Apr-11. 20967831. 5227197. 3562580. 22132. 44034. 650815. 262198. 114542. 746. 7996. May-11. 23888528. 5258456. 3567969. 26977. 68324. 740723. 233650. 113638. 29750. 8551. Jun-11. 28531708. 5281748. 3580379. 30557. 93253. 812335. 234014. 113894. 969. 10244. Jul-11. 23876901. 5393994. 3584564. 32812. 110342. 691574. 234364. 114025. 1038. 13125. Aug-11. 26383430. 5331238. 3532529. 136151. 120350. 815589. 234702. 114090. 847. 18669. Sep-11. 23456880. 5370637. 3583471. 39012. 130000. 235000. 114102. 828. 20554. Oct-11. 24171582. 5485663. 3610246. 42135. 137605. 741812 702895. 235344. 114570. 808. 24340. Nov-11. 24790012. 5371730. 3651711. 52649. 143560. 736797. 235661. 114700. 797. 25005. Dec-11. 26751572. 5382359. 3679229. 33518. 150002. 760386. 235839. 111748. 883. 26158. Jan-12. 26361906. 5382452. 3696908. 30200. 170344. 756945. 235587. 114166. 961. 27000. 34.
(35) Table 3.3-6. Fan numbers of telecommunications industry. Fans Number. 政 治 大. io. n. Ch. engchi. 35. y. sit. Nat. al. 0 0 0 0 0 0 0 7063 7378 7745 9322 10218 10594 10937 11146 11269 11358 11454 14463 15792 15890 16050. ‧. ‧ 國. 立. 0 0 0 0 0 0 0 4737 7608 15061 17580 19531 21191 22323 24706 27531 28622 31975 37614 48451 62007 69737. 學. Apr-10 May-10 Jun-10 Jul-10 Aug-10 Sep-10 Oct-10 Nov-10 Dec-10 Jan-11 Feb-11 Mar-11 Apr-11 May-11 Jun-11 Jul-11 Aug-11 Sep-11 Oct-11 Nov-11 Dec-11 Jan-12. Taiwan Mobile. CHT. er. Month. Far EasTone Telecomm unication 0 0 0 0 0 0 0 3511 5408 7460 9016 10736 11314 13385 16033 17560 18130 21326 25537 29030 32815 34724. i Un. v.
(36) Table 3.3-7. Public data of telecommunications industry CHT M onth. Taiwan M obile. M obile Total Communicati mobile subs APRU churn rate ons Business (thousand). Far EasTone Telecommunication. Total Total churn Revenue M obile subs APRU rate (million) (thousand). total revenue (million). Total M obile churn subs APRU rate (thousand). Apr-10. 6553998. 9383. 664 0.008662771. 5778. 6383. 702. 1.7%. 4841. 6236. 692 2.0%. M ay-10. 6342288. 9417. 635 0.007650371. 5919. 6378. 719. 1.8%. 5089. 6247. 712 1.9%. 645 0.008434121. 5752. 6380. 712. 1.7%. 4927. 6263. 708 1.8%. Jun-10. 6311896. 9446. Jul-10. 6282842. 9487. 641 0.008760388. 5906. 6379. 736. 1.8%. 5111. 6276. 727 1.8%. Aug-10. 6350378. 9534. 659 0.009310207. 5873. 6386. 728. 1.8%. 5463. 6299. 720 2.0%. 647 0.008674096. 5933. 6390. 730. 1.8%. 5816. 6320. 716 1.9%. Sep-10. 6416082. 9577. Oct-10. 6540479. 9611. 643 0.008306726. 5907. 6392. 724. 1.8%. 6759. 6325. 719 2.0%. Nov-10. 6369142. 9645. 637 0.008727952. 5938. 6395. 714. 1.8%. 5621. 6339. 700 1.8%. 625. 6399. 741. 1.8%. 6094. 6360. 726 1.9%. 6275218. 9679. 0.00950101. 6056. Jan-11. 6763001. 9719. 661 0.008442819. 6107. 6405. 715. 1.7%. 6094. 6377. 698 1.7%. Feb-11. 6072271. 9753. 599 0.007882911. 5822. 6407. 677. 1.7%. 5485. 6399. 662 1.6%. M ar-11. 5743232. 9784. 557 0.008869388. 6293. 6417. 729. 1.8%. 6096. 6412. 718 2.0%. Apr-11. 5824151. 9810. 600 0.009190889. 5896. 6432. 707. 1.6%. 5948. 6433. 693 1.8%. M ay-11. 5824151. 9836. 578 0.009584093. 6058. 6447. 721. 1.8%. 6208. 6463. 715 1.9%. Jun-11. 6403640. 9862. 594. 0.009852. 6021. 6474. 719. 1.8%. 6297. 6,501. 712 1.7%. Jul-11. 6178420. 9896. 612. 0.01104146. 6896. 6508. 739. 1.8%. 6587. 6524. 732 1.8%. Aug-11. 6214513. 9923. 615 0.011666866. 7495. 6544. 739. 1.9%. 6585. 6549. 736 1.9%. Sep-11. 6056661. 9956. 602 0.010165204. 7338. 6574. 722. 1.8%. 6438. 6574. 723 1.8%. 9971. 597 0.009741639. 7550. 6601. 718. 1.8%. 6430. 6587. 723 1.8%. 10006. 6599. 6601. 718 1.9%. 6983. 6618. 740 2.0%. 7381. 6640. 737 1.8%. 立. 政 治 大. 學. 5922117. 591 0.009157721. 7507. 6634. 713. 1.9%. Dec-11. 6463240. 10072. 582 0.009577897. 8386. 6663. 723. 2.0%. 6603504. 10081. 588 0.011023611. 8330. 6690. 724. 1.8%. sit. io. n. al. er. Jan-12. y. Nov-11. ‧. 6004934. Nat. Oct-11. ‧ 國. Dec-10. Ch. engchi. 36. i Un. v.
數據

+7
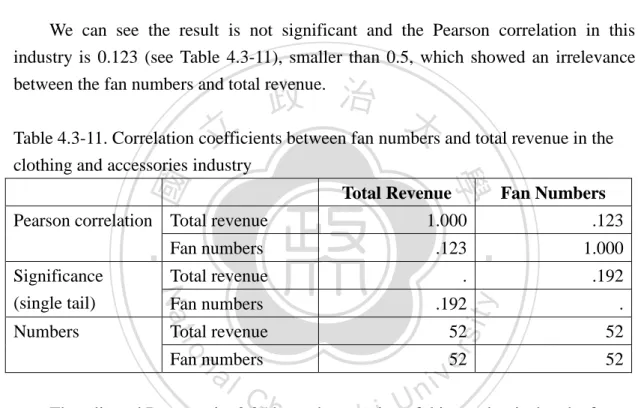
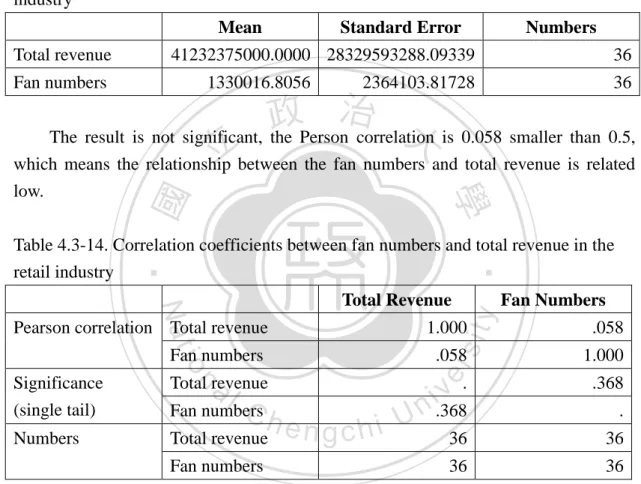


相關文件
譯註 1 本條文之原文”Domestic industry shall be understood to mean the producer of the like product or product directly compete with products subject to investigation, or
we often use least squares to get model parameters in a fitting problem... 7 Least
Generic methods allow type parameters to be used to express dependencies among the types of one or more arguments to a method and/or its return type.. If there isn’t such a
The presentation or rebranding by a company of an established product in a new form, a new package or under a new label into a market not previously explored by that company..
FMEA, fail mode and effective analysis, which is one of a common method to analysis and find out the fail mode of the product is to dig out the unobservable problem or hidden
In view of this, this paper attempt to explore the impact of service quality, product involvement, perceive risk on purchase intention.. For affected consumer’s major factor in
William and McCarthy (1997) claimed that the product’s life cycle - period usually consists of five major steps or phases: Product development, Product
and Clark, K., “Architectural Innovation: The Configuration of Existing Product Technologies and the Failure of Established Firms”, Administrative Science Quarterly,
