1
Deubiquitylation and stabilization of PTEN by USP13
Jinsong Zhang
1, Peijing Zhang
1,6, Yongkun Wei
2,6, Hai-long Piao
1, Wenqi Wang
1, Subbareddy
Maddika
3, Min Wang
1, Dahu Chen
1, Yutong Sun
2, Mien-Chie Hung
2,4,5, Junjie Chen
1,4and Li Ma
1,4,7The tumour suppressor PTEN is frequently lost in human cancers. In addition to gene mutations and deletions, recent studies
have revealed the importance of post-translational modifications, such as ubiquitylation, in the regulation of PTEN stability,
activity and localization. However, the deubiquitylase that regulates PTEN polyubiquitylation and protein stability remains
unknown. Here we screened a total of 30 deubiquitylating enzymes (DUBs) and identified five DUBs that physically associate with
PTEN. One of them, USP13, stabilizes the PTEN protein through direct binding and deubiquitylation of PTEN. Loss of USP13 in
breast cancer cells promotes AKT phosphorylation, cell proliferation, anchorage-independent growth, glycolysis and tumour growth
through downregulation of PTEN. Conversely, overexpression of USP13 suppresses tumorigenesis and glycolysis in PTEN-positive
but not PTEN-null breast cancer cells. Importantly, USP13 protein is downregulated in human breast tumours and correlates with
PTEN protein levels. These findings identify USP13 as a tumour-suppressing protein that functions through deubiquitylation and
stabilization of PTEN.
The lipid phosphatase PTEN (phosphatase and tensin
homologue deleted on chromosome 10) catalyses the
conversion
of
phosphatidylinositol-3,4,5-trisphosphate
to
phosphatidylinositol-4,5- bisphosphate
1,2. By antagonizing PI(3)K–
AKT signalling, PTEN plays crucial roles in many cellular processes
3–5. This protein is encoded by a tumour suppressor gene located at
10q23 (ref. 6), which is one of the most frequently mutated genes in
human cancer
7,8. Germline PTEN mutations occur in several
inherited syndromes (such as Cowden syndrome) characterized by
hamartomatous growth and predisposition to breast, thyroid and
endometrial cancers, and somatic mutations of PTEN are observed
in a wide cancer spectrum, including breast, prostate, kidney and
brain tumours
7–9.
Despite frequent genetic alterations of PTEN in human tumours,
only 25% of cancer patients show a correlation between loss of
PTEN protein and loss of its messenger RNA
10, which underscores
the importance of PTEN regulation at post-transcriptional and
post-translational levels. Indeed, mono- or polyubiquitylation,
phosphorylation, sumoylation, acetylation and regulation by
non-coding RNAs can control PTEN expression, activity or
localization
5,11,12. Whereas recent studies have revealed the role
of ubiquitylation in modulating the PTEN protein
5,11,12, the
regulation of
PTEN deubiquitylation
remains poorly
understood. Several ubiquitin ligases of PTEN, including
NEDD4-1 (refs NEDD4-13,NEDD4-14), WWP2 (ref. NEDD4-15), XIAP (ref. NEDD4-16) and CHIP (ref.
17), have been found to target
PTEN for proteasomal degradation. On the other hand, reversal
of the mono-ubiquitylation of PTEN by USP7 (also known as
HAUSP) regulates PTEN subcellular localization without affecting
its protein level
18. However, the deubiquitylase that regulates
PTEN polyubiquitylation and protein stability has not been reported.
In this study, we identified USP13 as the first deubiquitylase that
reverses PTEN polyubiquitylation and stabilizes PTEN protein, and
found that USP13 suppresses tumorigenesis and glycolysis through
PTEN. In human breast cancer, loss of USP13 is highly associated
with loss of PTEN.
RESULTS
USP13 regulates PTEN protein level and AKT signalling
DUBs are a group of proteases that regulate ubiquitin-dependent
pathways by cleaving ubiquitin-protein bonds
19. To identify
PTEN- interacting deubiquitylases, we screened a panel of DUBs, in
which a total of 30 deubiquitylase open reading frames (ORFs) were
fused with a triple-epitope tag, SFB (S-protein, FLAG tag and
streptavidin-binding peptide), and then co-transfected with
MYC-tagged PTEN into HEK293T cells. Immunoblotting assays showed
that MYC–PTEN could be detected on S-protein beads conjugated
with five DUBs, USP7, USP8, USP10, USP13 or USP39 (Fig. 1a).
Moreover, MYC–PTEN transfected into HeLa cells could also be
pulled down by each of these five SFB- tagged DUBs (Fig. 1b),
further corroborating a physical association.
1 Department of Experimental Radiation Oncology, The University of Texas MD Anderson Cancer Center, Houston, Texas 77030, USA. 2 Department of Molecular and Cellular Oncology, The University of Texas MD Anderson Cancer Center, Houston, Texas 77030, USA. 3 Laboratory of Cell Death and Cell Survival, Centre for DNA Fingerprinting and Diagnostics (CDFD), Nampally, Hyderabad 500001, India. 4 Cancer Biology Program, Graduate School of Biomedical Sciences, The University of Texas Health Science Center at Houston, Houston, Texas 77030, USA. 5 Center for Molecular Medicine and Graduate Institute of Cancer Biology, China Medical University, Taichung 402, Taiwan. 6 These authors contributed equally to this work.
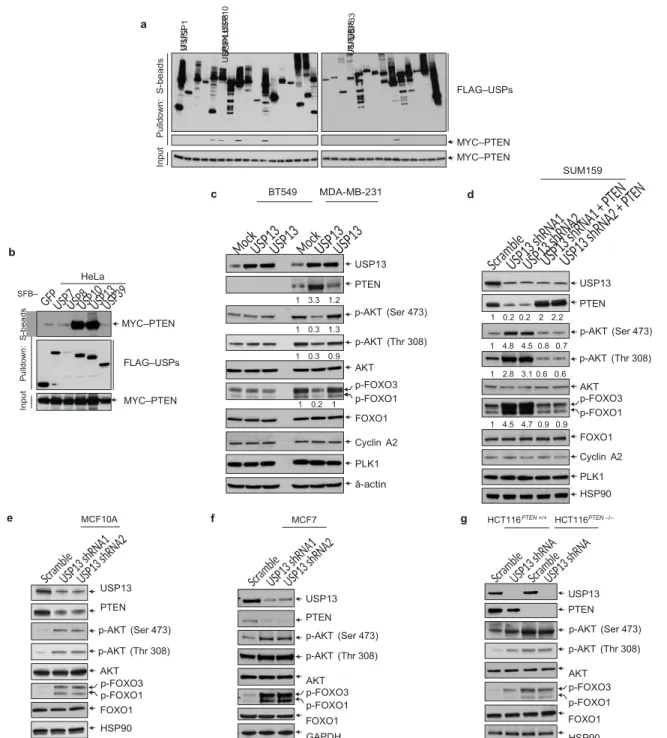
a FLAG–USPs c BT549 MDA-MB-231 MYC–PTEN MYC–PTEN d SUM159 b SFB– HeLa MYC–PTEN 1 3.3 1.2 USP13 PTEN p-AKT (Ser 473) 1 0.2 0.2 2 2.2 USP13 PTEN FLAG–USPs MYC–PTEN 1 0.3 1.3 1 0.3 0.9 1 0.2 1 p-AKT (Thr 308) AKT p-FOXO3 p-FOXO1 FOXO1 Cyclin A2 PLK1 â-actin 1 4.8 4.5 0.8 0.7 1 2.8 3.1 0.6 0.6 1 4.5 4.7 0.9 0.9 p-AKT (Ser 473) p-AKT (Thr 308) AKT p-FOXO3 p-FOXO1 FOXO1 Cyclin A2 PLK1 HSP90
e MCF10A f MCF7 g HCT116PTEN +/+ HCT116PTEN –/–
USP13
PTEN USP13
PTEN
USP13 PTEN
p-AKT (Ser 473) p-AKT (Ser 473)
p-AKT (Thr 308) p-AKT (Thr 308) p-AKT (Ser 473) p-AKT (Thr 308) AKT p-FOXO3 p-FOXO1 FOXO1 HSP90 AKT p-FOXO3 p-FOXO1 FOXO1 GAPDH AKT p-FOXO3 p-FOXO1 FOXO1 HSP90
Figure 1 USP13 is a PTEN-interacting deubiquitylase that regulates
PTEN and AKT signalling. (a) Five of 30 DUBs physically associate with PTEN. SFB-tagged DUBs were co-transfected with MYC–PTEN into HEK293T cells, followed by pulldown with S-protein beads and immunoblotting with antibodies against FLAG and MYC. (b) Five SFB-tagged DUBs were co-transfected with MYC–PTEN into HeLa cells, followed by pulldown with S-protein beads and immunoblotting with antibodies against MYC and FLAG. (c) Immunoblotting of USP13, PTEN, p-AKT, AKT, p-FOXO1, p-FOXO3, FOXO1, cyclin A2, PLK1 and
â-actin in BT549 and MDA-MB-231 cells transduced with wild-type USP13 or the USP13C345A mutant. (d) Immunoblotting of USP13,
PTEN, p-AKT, AKT, p-FOXO1, p-FOXO3, FOXO1, cyclin A2, PLK1 and HSP90 in USP13 shRNA-transduced SUM159 cells with or without ectopic expression of PTEN. (e–g) Immunoblotting of USP13, PTEN, p-AKT, AKT, p-FOXO1, p-FOXO3, FOXO1 and HSP90 (or GAPDH) in USP13 shRNA-transduced MCF10A (e), MCF7 (f), HCT116PTEN+/+
and HCT116PTEN−/− (g) cells. Uncropped images of blots are shown in
Supplementary Fig. 6.
To examine the effects of these five PTEN-associated DUBs on PTEN
expression and the growth of tumour cells, we stably expressed them
individually in the MCF7 human breast cancer cell line.
Although each of these five DUBs could interact with
endogenous PTEN (Supplementary Fig. 1a), only one of them,
USP13, significantly increased endogenous PTEN protein
expression (Supplementary Fig. 1a). Compared with the control
MCF7 cells, cells overexpressing
USP7, USP10 or USP13 exhibited a pronounced reduction in both
proliferation (Supplementary Fig. 1b) and anchorage-independent
growth (Supplementary Fig. 1c,d). Therefore, USP13 stood out
as the top candidate for a possible PTEN deubiquitylase and a
putative tumour suppressor.
As an alternative approach to identify PTEN-associated DUBs,
we isolated PTEN-containing protein complexes using SFB-tagged
In p u t P u lld ow n : S -b e a d s In pu t P ul ld o w n: S -b e a d s U S P 1 U S P 2 U S P 4 U S P 8 U S P 9 X U S P 1 0 U S P 1 1 U S P 1 2 US P 3 3 U S P 3 5 U S P 3 6 U S P 3 7
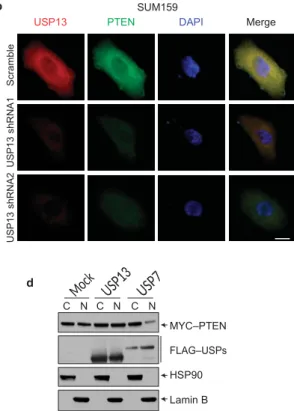
a MDA-MB-231 b SUM159
USP13 PTEN DAPI Merge USP13 PTEN DAPI Merge
c d MYC–PTEN FLAG–USPs GAPDH C N C N C N MYC–PTEN FLAG–USPs HSP90 Lamin B Figure 2 USP13 regulates the PTEN protein level but not its subcellular
localization. (a) Immunofluorescent staining of USP13 (red) and PTEN (green) in MDA-MB-231 cells transduced with wild-type USP13 or the USP13C345A mutant. The right panels are the overlay of
USP13, PTEN and nuclear 4,6-diamidino-2-phenylindole (DAPI; blue) staining of the same field. The GFP and RFP sequences in the pLOC vector were mutated to silence GFP and RFP expression from this vector. Scale bar, 10 µm. (b) Immunofluorescent staining of USP13 (red) and PTEN (green) in SUM159 cells infected with USP13 shRNA or the pGIPZ vector with a scrambled sequence. The right panels are the
overlay of USP13, PTEN and nuclear DAPI staining of the same field. The GFP sequence in the pGIPZ vector was mutated to silence GFP expression from this vector. Scale bar, 10 µm. (c) Immunoblotting of MYC–PTEN, FLAG–USP and GAPDH in whole-cell lysates of PC3 cells co-transfected with MYC–PTEN and FLAG-tagged USP13 or USP7. (d) Immunoblotting of MYC–PTEN, FLAG–USP, HSP90 (cytoplasmic marker) and lamin B (nuclear marker) in cytoplasmic (C) and nuclear (N) fractions of PC3 cells co-transfected with MYC– PTEN and FLAG-tagged USP13 or USP7. Uncropped images of blots are shown in Supplementary Fig. 6.
PTEN. Tandem affinity purification using streptavidin–Sepharose
beads and S-protein agarose beads followed by mass spectrometric
analysis identified six DUBs, USP10, USP13, USP7, USP8, USP39
and USP4, as PTEN interactors (Supplementary Table 1). Conversely,
purification of SFB-tagged USP13 complexes identified PTEN as a
USP13-interacting protein (Supplementary Table 2).
Next, we expressed USP13 in other human breast cancer cells.
This overexpression upregulated PTEN protein and downregulated
AKT, FOXO1 and FOXO3 phosphorylation in the MDA-MB-231
cell line (Fig. 1c), which expresses moderate but detectable levels
of endogenous PTEN (Supplementary Fig. 2a), and knockdown
of PTEN in USP13-overexpressing MDA-MB-231 cells rescued the
phosphorylation of both AKT, FOXO1 and FOXO3 (Supplementary
Fig. 2b). In contrast, expression of USP13 did not reduce phospho-AKT
and phospho-FOXO levels in BT549 cells (Fig. 1c), which showed
no PTEN protein expression (Supplementary Fig. 2a) owing to a
frameshift mutation
20,21. Overexpression of a catalytically inactive
mutant of USP13, C345A (ref. 22), had no effect on PTEN protein
levels and the phosphorylation of AKT, FOXO1 and FOXO3 in these
two cell lines (Fig. 1c).
To further validate regulation of the PTEN protein by USP13,
we performed loss-of-function analysis in multiple cell lines that
express abundant USP13 and PTEN protein levels. Two independent
USP13 short hairpin RNAs (shRNAs) both decreased PTEN protein
expression by 80% and increased phospho-AKT and phospho-FOXO1
and -FOXO3 levels by three- to fivefold in SUM159 breast cancer
cells, and restoration of PTEN or expression of an RNAi-resistant
‘silence mutant’ (that is, no amino acid change) of USP13 (USP13-RE)
in USP13-depleted SUM159 cells completely reversed the effect of
USP13 shRNA on upregulating the phosphorylation of AKT and FOXO
(Fig. 1d and Supplementary Fig. 2c,d). Similarly, depletion of USP13
downregulated PTEN protein and upregulated AKT, FOXO1 and
FOXO3 phosphorylation in MCF10A (Fig. 1e) and MCF7 (Fig. 1f)
mammary epithelial cells and in HCT116 colon cancer cells (Fig. 1g),
but not in the isogenic PTEN-null HCT116 cells (Fig. 1g). In
addition, USP13 shRNA potentiated insulin-induced AKT
phosphorylation in SUM159 cells, which could be reversed by
re-expression of PTEN (Supplementary Fig. 2e). We conclude from
these data that USP13 inhibits AKT signalling through positive
regulation of PTEN protein. It should be noted that neither knockdown
nor overexpression of USP13 affected PTEN mRNA levels
(Supplementary Fig. 3a,b). Thus, USP13 does not regulate PTEN
expression at the transcriptional level.
In contrast to the knockdown effect of USP13, silencing of the
other four PTEN-interacting DUBs, USP7, USP8, USP10 or USP39,
did not affect PTEN protein levels (Supplementary Fig. 4a–d). USP7
(HAUSP), the only known PTEN deubiquitylase reported so far,
U S P 13 C 3 4 5 A U S P 13 M o ck U S P 13 s hR N A 2 U S P 13 s hR N A 1 S cr a m b le
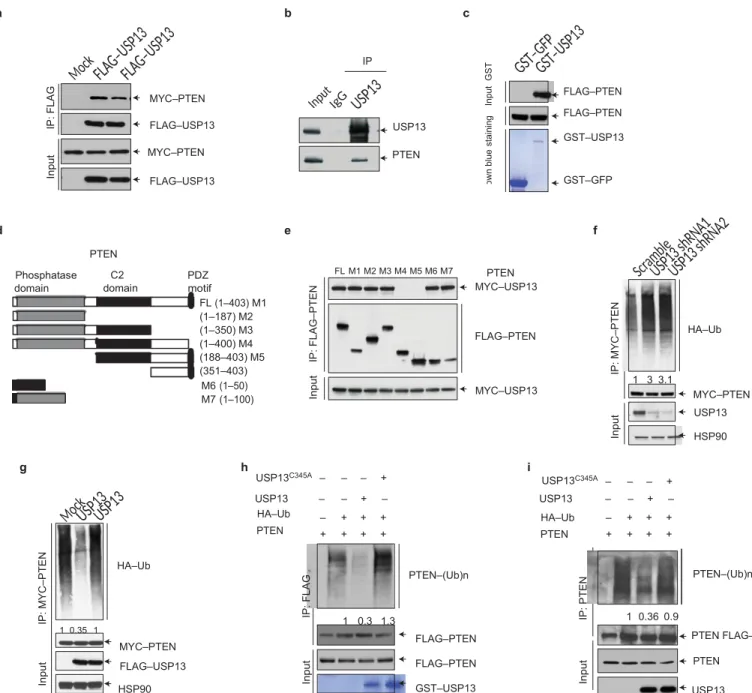
a b c IP MYC–PTEN FLAG–USP13 USP13 FLAG–PTEN FLAG–PTEN GST–USP13 MYC–PTEN PTEN FLAG–USP13 GST–GFP d e f Phosphatase domain PTEN C2 domain PDZ motif FL (1–403) M1 (1–187) M2 (1–350) M3 (1–400) M4 (188–403) M5 (351–403) FL M1 M2 M3 M4 M5 M6 M7 PTEN MYC–USP13 FLAG–PTEN HA–Ub 1 3 3.1 M6 (1–50) M7 (1–100) MYC–USP13 MYC–PTEN USP13 HSP90 g h i USP13C345A – – – + USP13C345A – – – + USP13 – – + – USP13 – – + – HA–Ub PTEN – + + + + + + + HA–Ub PTEN – + + + + + + + HA–Ub PTEN–(Ub)n PTEN–(Ub)n 1 0.35 1 MYC–PTEN FLAG–USP13 HSP90 1 0.3 1.3 FLAG–PTEN FLAG–PTEN GST–USP13 1 0.36 0.9 PTEN FLAG– PTEN USP13
Figure 3 USP13 directly interacts with and deubiquitylates PTEN.
(a) HEK293T cells were transfected with MYC–PTEN alone or in combination with FLAG-tagged USP13 or the USP13C345A mutant, immunoprecipitated
with FLAG beads and immunoblotted with antibodies against MYC and FLAG. (b) Endogenous USP13 was immunoprecipitated from SUM159 cells and immunoblotted with antibodies against USP13 and PTEN. (c) Top: GST–GFP or GST–USP13 was retained on glutathione–Sepharose beads, incubated with extracts of FLAG–PTEN-transfected HEK293T cells and then immunoblotted with the antibody against FLAG. Bottom: recombinant GST–GFP and GST–USP13 were purified from bacteria and analysed by SDS–PAGE and Coomassie blue staining. (d) Schematic representation of FLAG-tagged full-length PTEN (FL) and its various deletion mutants (M1–M7). (e) HEK293T cells were co-transfected with MYC–USP13 and FLAG-tagged full-length PTEN or its deletion mutants, immunoprecipitated with FLAG beads and immunoblotted with antibodies against MYC and FLAG. (f) HEK293T cells were co-transfected with MYC–PTEN, USP13 shRNA and HA–ubiquitin (Ub), immunoprecipitated with MYC beads and immunoblotted with antibodies against HA and MYC. Cells were treated with MG132 (10 µM) for 6 h before collection. (g) HEK293T cells were co-transfected with
MYC–PTEN, HA–ubiquitin (Ub) and FLAG-tagged USP13 or the USP13C345A
mutant, immunoprecipitated with MYC beads and immunoblotted with anti- bodies against HA and MYC. Cells were treated with MG132 (10 µM) for 6 h before collection. (h) Top: unubiquitylated or ubiquitylated SFB–PTEN was incubated with GST-tagged USP13 or the USP13C345A mutant purified from
bacteria with glutathione–Sepharose beads. After reaction, SFB–PTEN was immunoprecipitated with FLAG beads and immunoblotted with antibodies against HA and FLAG. Bottom (input for the in vitro assay): SFB–PTEN was purified with streptavidin–Sepharose beads and immunoblotted with the antibody against FLAG. Recombinant GST–USP13 was purified from bacteria and analysed by SDS–PAGE and Coomassie blue staining. (i) Top: unubiquitylated or ubiquitylated SFB–PTEN was incubated with SFB-tagged USP13 or the USP13C345A mutant purified from HEK293T cells with
streptavidin–Sepharose beads. After reaction, PTEN was immunoprecipitated with the antibody against PTEN and immunoblotted with the antibody against PTEN. Bottom (input for the in vitro assay): SFB–USP13 and SFB–PTEN were purified with streptavidin–Sepharose beads and immunoblotted with antibodies against USP13 and FLAG, respectively. Uncropped images of blots are shown in Supplementary Fig. 6.
In p u t IP : M Y C –P T E N In p u t IP : F LA G In p u t IP : F LA G In p u t IP : F LA G –P T E N C oo m as si e P ul ld o w n b lu e s ta in in g In pu t G S T In p u t IP : P T E N In p u t IP : M Y C –P T E N
a Mock USP13 USP13C345A
1.0
Mock USP13
b Mock USP13 USP13C345A MYC–PTEN + Mock
MYC–PTEN + USP13 0 6 9 18 0 6 9 18 0 6 9 18 CHX (h) PTEN USP13 HSP90 0.8 0.6 0.4 0.2 0 USP13C345A 0 3 6 9 12 15 18 Hours after CHX 0 3 6 9 0 3 6 9 0 3 6 9 CHX (h) MYC–PTEN FLAG–USP13 HA–GFP HSP90 1.0 0.8 0.6 0.4 0.2 0
MYC–PTEN + USP13C345A
0 3 6 9
USP13 treatment USP13 Hours after CHX
c Scramble shRNA Scramble d Scramble shRNA treatment
MYC–PTEN + scramble 0 6 9 18 0 6 9 18 CHX (h) PTEN USP13 HSP90 1.0 0.8 0.6 0.4 0.2 0 USP13 shRNA 0 3 6 9 12 15 18 Hours after CHX treatment 0 3 6 9 0 3 6 9 CHX (h) MYC–PTEN USP13 HA–GFP HSP90 1.0 0.8 0.6 0.4 0.2 0
MYC–PTEN + USP13 shRNA
0 3 6 9
Hours after CHX treatment Figure 4 USP13 stabilizes PTEN protein. (a) Left: MDA-MB-231 cells
were transduced with USP13 or USP13C345A , treated with 100 µg ml−1
cycloheximide (CHX), collected at different time points and then immunoblotted with antibodies against USP13, PTEN and HSP90. Right: quantification of PTEN protein levels (normalized to HSP90). (b) Left: HEK293T cells were co-transfected with MYC–PTEN, HA–GFP and FLAG-tagged USP13 or USP13C345A , treated with 100 µg ml−1 CHX,
collected at different time points and then immunoblotted with antibodies against MYC, FLAG, HA and HSP90. HA–GFP serves as the control for transfection. Right: quantification of PTEN protein levels (normalized to
HSP90). (c) Left: SUM159 cells were transduced with USP13 shRNA, treated with 100 µg ml−1 CHX, collected at different time points and
then immunoblotted with antibodies against USP13, PTEN and HSP90. Right: quantification of PTEN protein levels (normalized to HSP90). (d) Left: HEK293T cells were co-transfected with MYC–PTEN, HA–GFP and USP13 shRNA, treated with 100 µg ml−1 CHX, collected at different time
points and then immunoblotted with antibodies against MYC, USP13, HA and HSP90. HA–GFP serves as the control for transfection. Right: quantification of PTEN protein levels (normalized to HSP90). Uncropped images of blots are shown in Supplementary Fig. 6.
regulates PTEN mono-ubiquitylation and subcellular localization but
not its protein stability
18. In
the present study,
immunofluorescent staining (Fig. 2a,b) and fractionation assays
(Fig. 2c,d) demonstrated that manipulating USP13 levels altered
PTEN protein expression but not its localization; moreover, either
overexpression or knockdown of USP13 had no effect on the levels of
cyclin A2 and PLK1 (Fig. 1c,d), the key substrates of the APC–CDH1
complex, which has been shown to be regulated by nuclear PTEN in a
phosphatase-independent manner
23. In contrast, USP7 reduced
nuclear localization of PTEN in PC3 cells without affecting total
PTEN protein levels (Fig. 2c,d), consistent with previously reported
findings
18.
USP13 deubiquitylates and stabilizes PTEN
We sought to determine whether USP13 directly interacts with PTEN
and functions as a bona fide PTEN deubiquitylase. Consistent with
the interaction observed in the initial screen, co-immunoprecipitation
assays confirmed that ectopically expressed MYC-tagged PTEN could
be detected in FLAG-tagged wild-type or the C345A mutant of
USP13 immunoprecipitates (Fig. 3a), and that endogenous PTEN was
present in endogenous USP13 immunoprecipitates (Fig. 3b).
Moreover, purified GST–USP13, but not the GST–GFP control, was
able to bind to FLAG-tagged PTEN under cell-free conditions
(Fig. 3c), which demonstrated a direct interaction between USP13
and PTEN. PTEN consists of an amino-terminal phosphatase domain,
a C2 domain and a carboxy-terminal PDZ motif
24. To map the
USP13-binding region on PTEN, we co-expressed MYC-tagged
USP13 along with a series of deletion mutants of PTEN
15(Fig. 3d).
Co-immunoprecipitation assays demonstrated that the phosphatase
domain of PTEN is essential for its physical interaction with USP13
(Fig. 3e).
We reasoned that USP13 regulates PTEN through deubiquitylation.
Indeed, silencing USP13 expression by two independent shRNAs
R el at iv e P T E N l e ve ls R el at iv e P T E N l e ve ls R el at iv e P T E N l e ve ls R el at iv e P T E N l e ve ls
increased PTEN polyubiquitylation by approximately threefold
(Fig. 3f). On the other hand, ectopic expression of wild-type
USP13, but not the C345A mutant, which is still capable of
interacting with PTEN (Fig. 3a), reduced the polyubiquitylation
of PTEN by
65% (Fig. 3g), suggesting that the enzymatic activity of USP13 is
indispensable for USP13-dependent deubiquitylation of PTEN. To
determine whether PTEN is a direct substrate of USP13, we purified
USP13 and ubiquitylated PTEN and then incubated them in a cell-free
system. Wild-type USP13 purified from either bacteria or
HEK293T cells, but not its catalytically inactive mutant C345A,
decreased PTEN polyubiquitylation by 64–70% in vitro (Fig. 3h,i).
Therefore, USP13 can directly deubiquitylate PTEN.
To determine whether USP13 regulates the stability of the PTEN
protein, we examined ectopically expressed or endogenous PTEN
protein levels in the presence of cycloheximide (CHX), an inhibitor
of protein translation. Notably, overexpression of USP13, but not
the enzyme-dead mutant, led to a prominent increase in the stability
of endogenous or overexpressed PTEN protein, whereas the stability
of HSP90 or co-transfected GFP control was not affected (Fig.
4a,b). Conversely, knockdown of USP13 resulted in destabilization
of the PTEN protein (Fig. 4c,d). Collectively, these results suggest that
USP13 is a PTEN deubiquitylase that stabilizes PTEN.
Loss of USP13 promotes tumorigenesis through downregulation
of PTEN
We investigated whether USP13 functions as a tumour-suppressing
protein by regulating PTEN. Two independent USP13 shRNAs (Fig.
1d) both markedly increased the proliferation (Fig. 5a) and
anchorage- independent growth (Fig. 5b,c) of SUM159 breast
cancer cells, and restoration of PTEN (Fig. 1d) or expression of
an RNAi-resistant USP13 mutant (Supplementary Fig. 2c,d)
completely reversed the
a Scramble b USP13 c USP13 P = 2 × 10⁻³ P = 2 × 10⁻⁴ g P = 7 × 10⁻³ h P = 1 × 10⁻³ P = 0.01 P = 0.01
USP13 shRNA1 Scramble shRNA1 shRNA2
800 P = 2 × 10⁻⁴ P = 2 × 10⁻³ P = 0.01
USP13 shRNA2 USP13 shRNA1 + PTEN 7 USP13 shRNA2 + PTEN 6 5 4 3 2 1 0 –1 0 1 2 3 4 5 6 7 8 Days USP13 shRNA1 + PTEN USP13 shRNA2 + PTEN 600 400 200 0 P = 2 × 10⁻⁴ 0.4 0.3 0.2 0.1 0 P = 2 × 10⁻³ 2,000 P = 0.01 1,500 1,000 500 0 d SUM159 Scramble 7 USP13 shRNA 6 USP13 shRNA + 5 USP13-RE 4 3 2 1 0 0 1 2 3 4 5 6 7 8 Days e HCT116 HCT116PTEN+/+-scramble HCT116PTEN+/+-USP13 shRNA HCT116PTEN–/–-scramble 8 HCT116
PTEN–/–
-USP13 shRNA 6 4 2 0 0 1 2 3 4 5 6 7 8 Days f Vehicle MK-2206 USP13 p-AKT (Ser 473) AKT HSP90 SUM159 Scramble + vehicle USP13 shRNA + vehicle 8 Scramble + MK-2206 USP13 shRNA + MK-2206 6 4 2 0 0 1 2 3 4 5 6 7 8 Days i Scramble USP13 shRNA1 USP13 shRNA2 j k l P = 5 × 10⁻⁴ P = 1 × 10⁻³ P = 5 × 10⁻⁴ 600 500 400 300 200 100 0USP13 shRNA2 + PTEN
0 45 50 55 60 65 Time (d) 2,000 1,500 1,000 500 0 P = 2 × 10⁻⁴ Scramble USP13 shRNA1 USP13 shRNA2 + PTEN USP13 shRNA2 + PTEN USP13 PTEN p-AKT (Ser 473) p-AKT (Thr 308) AKT â-actin
Figure 5 Loss of USP13 promotes tumour growth and glycolysis through
downregulation of PTEN. (a) Growth curves of USP13 shRNA-transduced SUM159 cells with or without ectopic expression of PTEN. (b,c) Images (b) and quantification (c) of anchorage-independent growth of USP13 shRNA-transduced SUM159 cells with or without ectopic expression of PTEN. (d) Growth curves of USP13 shRNA-transduced SUM159 cells with or without ectopic expression of an RNAi-resistant mutant of USP13 (USP13-RE). (e) Growth curves of USP13 shRNA-transduced HCT116PTEN+/+ and HCT116PTEN−/− cells. (f) Left: immunoblotting of
USP13, p-AKT, AKT and HSP90 in USP13 shRNA-transduced SUM159 cells cultured in the presence or absence of the AKT inhibitor MK-2206 (1 µM). Right: growth curves of USP13 shRNA-transduced SUM159 cells cultured in the presence or absence of the AKT inhibitor MK-2206 (1 µM). (g,h) Lactate secretion (g) and 2-deoxy-D- 3 H]glucose (H3-DG)
uptake (h) by USP13 shRNA-transduced SUM159 cells with or without ectopic expression of PTEN. (i) Tumour growth by 5 ×10⁶
subcutaneously injected USP13 shRNA-transduced SUM159 cells with or without ectopic expression of PTEN. (j,k) Tumour weight (j) and tumour images (k) of mice with subcutaneous injection of 5 × 10⁶
USP13 shRNA-transduced SUM159 cells with or without ectopic expression of PTEN, at day 65 after implantation. Data in a and c–j are mean ± s.e.m. n = 5 mice per group in (i,j). Statistical significance was determined by a two-tailed, unpaired Student’s t -test. (l) Immunoblotting of USP13, PTEN, p-AKT, AKT and â-actin in tumour lysates from k. Data in a and c–h are the mean of 3 wells per group and error bars indicate s.e.m. The experiments were repeated three times. The source data for a and c–h can be found in Supplementary Table 3. Uncropped images of blots are shown in Supplementary Fig. 6.
effect of USP13 shRNA (Fig. 5a–d). Moreover, knockdown of USP13
promoted the proliferation of HCT116 colon cancer cells but not
the isogenic PTEN-null HCT116 cells (Fig. 5e).
The effect of USP13 shRNA on cell proliferation is AKT-dependent,
as treatment with the AKT inhibitor MK-2206 abolished this effect
(Fig. 5f). Furthermore, because USP13 regulates AKT phosphorylation
through PTEN (Fig. 1c–g), and because AKT plays a critical role in
regulating the Warburg effect whereby cancer cells exhibit a high rate
of glucose uptake and glycolysis
25–27, we speculated that USP13 might
regulate the Warburg effect through PTEN. Indeed, knockdown of
USP13 increased glucose uptake and glycolysis, which could be fully
reversed by restoration of PTEN, as gauged by lactate production and
glucose incorporation assays (Fig. 5g,h).
To investigate the biological function of USP13 in breast cancer cells
in vivo, we subcutaneously implanted USP13-depleted SUM159 cells
into nude mice and monitored tumour growth for more than nine
[ T um ou r vo lu m e ( m m 3) A b so rb a n ce ( 59 0 n m ) A b so rb a n ce ( 59 0 n m ) P = 9 × 1 0 – 3 P = 8 × 1 0 – 3 P = 3 × 1 0 – 3 P = 0 .0 1 P = 6 × 1 0 –4 P = 0 .1 P = 3 × 1 0 –3 A b so rb a n ce ( 59 0 n m ) T um ou r w ei gh t ( m g ) P = 6 × 1 0 – 4 P = 0 .7 N um be r o f co lo n ie s S cr a m b le U S P 1 3 s h R N A 1 La ct at e s ec re tio n (m m ol l – 1) S cr a m b le U S P 1 3 s h R N A 1 A b so rb a n ce ( 59 0 n m ) S cr a m b le H 3-D G u p ta ke (c ou nt s ìg –1 to ta l p ro te in ) S cr a m b le U S P 1 3 s h R N A 1 P = 0 .5 P = 0 .0 1a MDA-MB-231 BT549 b
10 Mock 5 Mock Mock USP13 USP13C345A
8 USP13 6 USP13C345A 4 2 P = 0.4 P = 2 × 10⁻³ 4 USP13 3 USP13C345A 2 1 P = 0.9 P = 0.7 0 0 0 1 2 3 4 5 6 7 8 0 1 2 3 4 5 6 7 8 Days Days
c MDA-MB-231 BT549 d MDA-MB-231 BT549 e MDA-MB-231 BT549
P = 0.9 P = 0.7 P = 0.7 P = 0.4 P = 0.2 P = 0.8 120 100 80 60 40 20 0 P = 5 × 10⁻⁴ 120 P = 0.6 100 80 60 40 20 0 0.7 0.6 0.5 0.4 0.3 0.2 0.1 0 P = 4 × 10⁻⁴ 0.8 P = 0.4 0.6 0.4 0.2 0 700 600 500 400 300 200 100 0 P = 9 × 10⁻³ 800 600 400 200 0 P = 0.9 f 600 MDA-MB-231 Mock USP13 g MDA-MB-231 P = 4 × 10⁻⁴ P = 0.9 h i 10 8 MDA-MB-231 6 MDA-MB-231 Mock USP13 USP13 + sh-PTEN 500 400 USP13
C345A
300 200 100 0 0 30 35 40 45 50 Time (days) P = 0.9 P = 8 × 10⁻³ 1,500 1,000 500 0 Mock USP13 (2/5 no tumour) USP13C345A 4 2 0 0 1 2 3 4 5 6 7 8 Days m BT549 MDA-MB-231 j BT549 Mock 600 USP13 400 USP13C345A 200 0 0 30 35 40 45 50 Time (days) P = 0.8 P = 0.9 k 2,000 1,500 1,000 500 0 BT549 P = 0.2 P = 0.8 l Mock USP13 USP13C345A BT549 USP13 PTEN p-AKT (Ser 473) p-AKT (Thr 308) AKT â-actin Figure 6 USP13 suppresses tumorigenesis and glycolysis in PTEN-positivebut not PTEN-null breast cancer cells. (a) Growth curves of USP13- or USP13C345A -transduced MDA-MB-231 and BT549 cells. (b,c) Images
(b) and quantification (c) of anchorage-independent growth of USP13- or USP13C345A -transduced MDA-MB-231 and BT549 cells. (d,e) Lactate
secretion (d) and 2-deoxy-D-[3 H ]glucose (H3-DG) uptake (e) by
USP13-or USP13C345A -transduced MDA-MB-231 and BT549 cells. (f) Tumour
growth by 5×10⁶ subcutaneously injected MDA-MB-231 cells transduced
with USP13 or USP13C345A . (g,h) Tumour weight (g) and tumour images
(h) of mice with subcutaneous injection of 5 × 10⁶ MDA-MB-231 cells
transduced with USP13 or USP13C345A , at day 50 after implantation.
(i) Growth curves of USP13-overexpressing MDA-MB-231 cells with or
without knockdown of PTEN. (j) Tumour growth by 5 ×10⁶
subcutaneously injected BT549 cells transduced with USP13 or USP13C345A . (k,l) Tumour weight (k) and tumour images (l) of mice with
subcutaneous injection of
5 × 10⁶ BT549 cells transduced with USP13 or USP13C345A , at day 55
after implantation. Data in a,c–g and i–k are mean ± s.e.m. n = 5 mice per group in f,g,j and k. Statistical significance was determined by a two-tailed, unpaired Student’s t -test. (m) Immunoblotting of USP13, PTEN, p-AKT, AKT and â-actin in tumour lysates from h and l. Data in
a,c–e and i are the mean of 3 wells per group and error bars indicate
s.e.m. The experiments were repeated 3 times. The source data for a,c–e and i can be found in Supplementary Table 3. Uncropped images of blots are shown in Supplementary Fig. 6.
weeks. Mice bearing USP13 shRNA-expressing SUM159 cells showed
increased tumour growth throughout the experiment compared with
mice implanted with control shRNA-infected cells (Fig. 5i). At 65 days
after tumour cell implantation, we observed a 2.5-fold increase in
tumour volume (Fig. 5i) and a 3.5-fold increase in the weight of the
tumours formed by USP13-depleted SUM159 cells (Fig. 5j,k). Notably,
restoring PTEN expression fully reversed the tumour-promoting effect
of USP13 shRNA (Fig. 5i–k). Western blot analysis of tumour lysates
T um ou r vo lu m e (m m 3) T um ou r vo lu m e (m m 3) N um be r o f co lo n ie s A b so rb a n ce ( 59 0 n m ) M o c k U S P 1 3 U S P 1 3 C 3 4 5 A M o c k U S P 1 3 U S P 1 3 C 3 4 5 A T um ou r w ei gh t ( m g) T um ou r w ei gh t ( m g) La ct at e se cr e tio n (m m ol l – 1) M o ck U S P 1 3 U S P 1 3 C 3 4 5 A Mo ck U S P 1 3 U S P 1 3 C 3 4 5 A B T 54 9 M D A -M B -2 3 1 H 3-D G u p ta ke (c ou nt s ìg –1 to ta l p ro te in ) M o c k U S P 1 3 U S P 1 3 C 3 4 5 A A b so rb a n ce ( 59 0 n m ) M o c k U S P 1 3 U S P 1 3 C 3 4 5 A P = 0 .0 1 P = 1 × 1 0 – 3
a Normal Breast carcinoma b PTEN Normal breast Breast carcinoma Total P = 1 × 10⁻⁵, R = – 0.34 PTEN-low PTEN-high 14 30 152 54 166 84 Total 44 206 250 USP13 c Normal breast Breast carcinoma Total
USP13-low USP13-high Total
5 33 38
83 118 201
88 151 239
P = 8 × 10⁻⁴, R = – 0.21
d
PTEN-low PTEN-high Total
USP13-low 73 10 83
USP13-high 78 40 118
Total 151 50 201
P = 4 × 10⁻⁴, R = 0.25
Figure 7 USP13 protein is downregulated in human breast cancer
and correlates with PTEN protein levels. (a) Immunohistochemical staining of PTEN and USP13 in representative normal breast and breast carcinoma specimens on the NCI progression tissue
microarrays. Brown staining indicates positive immunoreactivity. Scale bars, 50 µm.
(b,c) PTEN (b) and USP13 (c) protein expression status in normal breast and breast carcinoma specimens. (d) Correlation between PTEN and USP13 protein levels in human breast tumours. Statistical significance in b–d was determined by a ÷ 2 test. R is the correlation
coefficient.
confirmed that the effect of USP13 shRNA on PTEN and phospho-AKT
was retained in these tumours (Fig. 5l). Therefore, loss of USP13
promotes tumorigenesis through downregulation of PTEN.
The anti-tumour function of USP13 depends on PTEN status
To further determine the dependence of the USP13 function on PTEN
status, we compared the PTEN-positive cell line MDA-MB-231 and
the PTEN-null cell line BT549 (Fig. 1c). Expression of USP13 (but not
the C345A mutant) in MDA-MB-231 cells, which led to
upregulation of PTEN and downregulation of phospho-AKT,
phospho-FOXO1 and phospho-FOXO3 (Fig. 1c), significantly
inhibited cell proliferation (Fig. 6a), colony formation on soft agar
(Fig. 6b,c), lactate production (Fig. 6d), glucose uptake (Fig. 6e)
and tumour growth (Fig. 6f–h), and knockdown of PTEN
(Supplementary Fig. 2b) rescued the proliferation of
USP13-overexpressing MDA-MB-231 cells (Fig. 6i). In stark contrast,
none of these effects was observed in USP13- overexpressing
BT549 cells (Fig. 6a–e,j–l), which showed no substantial difference in
AKT phosphorylation compared with mock-infected cells (Fig.
1c). Western blot analysis of tumour lysates confirmed that the
effect of USP13 on PTEN and phospho-AKT was retained in
tumours formed by USP13-overexpressing MDA-MB-231 or
BT549 cells (Fig. 6m). Taken together, USP13 has a PTEN-dependent
tumour-suppressing function.
USP13 is downregulated in human breast tumours and
correlates with PTEN protein levels
PTEN plays a pivotal role in human breast cancer suppression and is
dose-dependent. Female patients with Cowden syndrome have partial
loss of PTEN due to heterozygous germline PTEN mutations and are
estimated to have a 25–50% risk of developing breast cancer
28. Genetic
analysis of mouse models has revealed Pten haploinsufficiency and dose
dependence in breast tumour suppression
29. Moreover, whereas
ap-proximately 5% of sporadic breast tumours harbour PTEN mutations
9,
loss of PTEN immunoreactivity is found in nearly 40% (ref. 30), which
indicates that post-transcriptional and post-translational regulation
of PTEN may contribute substantially to the development of human
breast cancer. To determine the relevance of regulation of PTEN by
USP13 in patients, we performed immunohistochemical staining of
PTEN and USP13 (Fig. 7a) on the breast cancer progression tissue
microarrays from the National Cancer Institute
31, with antibodies
validated for immunohistochemistry (Supplementary Fig. 5). Notably,
downregulation of PTEN and USP13 was observed in 73.8% (152 of
206) and 41.3% (83 of 201) of breast tumours, whereas only 31.8% (14
of 44) and 13.2% (5 of 38) of normal mammary tissues exhibited low
expression of PTEN and USP13 (Fig. 7b,c), respectively, suggesting that
both PTEN and USP13 are downregulated in human breast tumours.
Moreover, a significant positive correlation (R = 0.25,P = 4 × 10
−4)
between PTEN and USP13 protein levels was observed in these breast
carcinomas, in which 88% (73 of 83) of the tumours with low USP13
expression also exhibited low PTEN expression (Fig. 7d). However, it
should be noted that 38.8% (78 of 201) of total tumour specimens had
low PTEN expression but high USP13 expression (Fig. 7d). Collectively,
these data suggest that loss of USP13 may contribute to loss of PTEN
in a substantial fraction of human tumours, whereas in other tumours
PTEN can be inactivated by different mechanisms, including genetic
alterations and upregulation of PTEN ubiquitin ligases (such as
NEDD4-1 (ref. 14) and WWP2 (ref. 15)).
DISCUSSION
The present study identified USP13 as a PTEN deubiquitylase and
a tumour-suppressing protein. Besides USP13, another two
PTEN-interacting DUBs, USP7 (HAUSP) and USP10, also exhibited a
growth-inhibitory effect (Supplementary Fig. 1b–d), which might be
explained by USP7-mediated delocalization of PTEN (ref. 18) and
USP10-mediated stabilization of p53 (ref. 32), respectively. However,
neither USP7 nor USP10 regulates PTEN protein levels (Supplementary
Fig. 1a and Supplementary Fig. 4a,b). In contrast, here we report USP13
as the first PTEN deubiquitylase that reverses the polyubiquitylation of
PTEN, leading to PTEN stabilization and tumour suppression.
Whereas most of the USP7 (HAUSP) protein is present in the
nucleus
18, which is consistent with its role in reversing the
mono-ubiquitylation of nuclear PTEN and promoting PTEN export from the
nucleus, USP13 is predominantly cytoplasmic or membrane-bound
(Figs 2a,b and 7a and Supplementary Fig. 5), which is consistent with
its role in reversing the polyubiquitylation of cytoplasmic or
membrane-bound PTEN protein.
In contrast to the fast turnover of another major tumour
suppressor protein, p53 (half-life: 5–20 min; ref. 33), PTEN has a
relatively long half-life (3–6 h; Fig. 4a–d). We propose that unlike
p53, PTEN is by default a relatively stable protein but its degradation
is accelerated on upregulation of PTEN ubiquitin ligases or
downregulation of PTEN deubiquitylases. As USP13 is downregulated
in human breast tumours and correlates with PTEN expression, and
because a large fraction of human cancers exhibit loss of only one
PTEN allele
34, we propose that loss of USP13 may drive breast
tumorigenesis in mammary tissues with heterozygous inactivation
of PTEN. Future studies are needed to determine the physiological
functions of USP13 and how USP13
expression is lost in human cancer.
口
METHODS
Methods and any associated references are available in the online
version
of
the
paper
.
Note: Supplementary Information is available in the online version of the paper ACKNOWLEDGEMENTS
We thank J. Yuan, Z. Gong, A. Sorokin, J. Wang, N. Li, L. Feng and L. Li for reagents and technical assistance. This work is supported by US National Institutes of Health grants R00CA138572 (to L.M.) and R01CA166051 (to L.M.) and a Cancer Prevention and Research Institute of Texas Scholar Award R1004 (to L.M.).
AUTHOR CONTRIBUTIONS
J.Z. and L.M. conceived and designed the study and wrote the manuscript. J.Z. performed most of the experiments. P.Z. contributed to DUB library construction and in vitro deubiquitylation assays. Y.W. and M-C.H. performed studies on tissue microarrays of human patient samples. H-l.P. performed xenograft implantation. W.W. and J.C. assisted with tandem affinity purification and mass spectrometric analysis. S.M. provided the PTEN mutant constructs. M.W. assisted with animal care. D.C. assisted with lactate secretion assays. Y.S. maintained shRNA and ORF clones and assisted with glucose uptake assays.
COMPETING FINANCIAL INTERESTS
The authors declare no competing financial interests. Published online at ww w .nature.com/doifinder/10.1038/ncb2874
Reprints and permissions information is available online at ww w .nature.com/reprints
1. Leevers, S. J., Vanhaesebroeck, B. & Waterfield, M. D. Signalling through phosphoinositide 3-kinases: the lipids take centre stage. Curr. Opin. Cell Biol. 11, 219–225 (1999).
2. Maehama, T. & Dixon, J. E. The tumour suppressor, PTEN/MMAC1, dephosphory- lates the lipid second messenger, phosphatidylinositol 3,4,5-trisphosphate. J. Biol. Chem. 273, 13375–13378 (1998).
3. Di Cristofano, A., Pesce, B., Cordon-Cardo, C. & Pandolfi, P. P. Pten is essential for embryonic development and tumour suppression. Nat. Genet. 19, 348–355 (1998). 4. Garcia-Cao, I. et al. Systemic elevation of PTEN induces a tumour-suppressive
metabolic state. Cell 149, 49–62 (2012).
5. Song, M. S., Salmena, L. & Pandolfi, P. P. The functions and regulation of the PTEN tumour suppressor. Nat. Rev. Mol. Cell Biol. 13, 283–296 (2012).
6. Liaw, D. et al. Germline mutations of the PTEN gene in Cowden disease, an inherited breast and thyroid cancer syndrome. Nat. Genet. 16, 64–67 (1997).
7. Li, J. et al. PTEN, a putative protein tyrosine phosphatase gene mutated in human brain, breast, and prostate cancer. Science 275, 1943–1947 (1997).
8. Steck, P. A. et al. Identification of a candidate tumour suppressor gene, MMAC1, at chromosome 10q23.3 that is mutated in multiple advanced cancers. Nat. Genet.
15, 356–362 (1997).
9. Hollander, M. C., Blumenthal, G. M. & Dennis, P. A. PTEN loss in the continuum of common cancers, rare syndromes and mouse models. Nat. Rev. Cancer 11, 289–301 (2011).
10. Shi, Y., Paluch, B. E., Wang, X. & Jiang, X. PTEN at a glance. J. Cell Sci. 125, 4687–4692 (2012).
11. Wang, X. & Jiang, X. Post-translational regulation of PTEN. Oncogene 27, 5454–5463 (2008).
12. Fata, J. E., Debnath, S., Jenkins, E. C. Jr. & Fournier, M. V. Nongenomic mechanisms of PTEN regulation. Int. J. Cell Biol. 2012, 379685 (2012). 13. Trotman, L. C. et al. Ubiquitination regulates PTEN nuclear import and tumour
suppression. Cell 128, 141–156 (2007).
14. Wang, X. et al. NEDD4-1 is a proto-oncogenic ubiquitin ligase for PTEN. Cell 128, 129–139 (2007).
15. Maddika, S. et al. WWP2 is an E3 ubiquitin ligase for PTEN. Nat. Cell Biol. 13, 728–733 (2011).
16. Van Themsche, C., Leblanc, V., Parent, S. & Asselin, E. X-linked inhibitor of apoptosis protein (XIAP) regulates PTEN ubiquitination, content, and compartmentalization. J. Biol. Chem. 284, 20462–20466 (2009).
17. Ahmed, S.F. et al. The chaperone-assisted E3 ligase C terminus of Hsc70-interacting protein (CHIP) targets PTEN for proteasomal degradation. J. Biol. Chem. 287, 15996–16006 (2012).
18. Song, M. S. et al. The deubiquitinylation and localization of PTEN are regulated by a HAUSP-PML network. Nature 455, 813–817 (2008).
19. Wilkinson, K. D. Regulation of ubiquitin-dependent processes by deubiquitinating enzymes. FASEB J. 11, 1245–1256 (1997).
20. Weigelt, B., Warne, P. H. & Downward, J. PIK3CA mutation, but not PTEN loss of function, determines the sensitivity of breast cancer cells to mTOR inhibitory drugs.
Oncogene 30, 3222–3233 (2011).
21. Hollestelle, A., Elstrodt, F., Nagel, J. H., Kallemeijn, W. W. & Schutte, M. Phosphatidylinositol-3-OH kinase or RAS pathway mutations in human breast cancer cell lines. Mol. Cancer Res. 5, 195–201 (2007).
22. Zhao, X., Fiske, B., Kawakami, A., Li, J. & Fisher, D. E. Regulation of MITF stability by the USP13 deubiquitinase. Nat. Commun. 2, 414 (2011).
23. Song, M. S. et al. Nuclear PTEN regulates the APC-CDH1 tumour-suppressive complex in a phosphatase-independent manner. Cell 144, 187–199 (2011). 24. Lee, J. O. et al. Crystal structure of the PTEN tumour suppressor: implications
for its phosphoinositide phosphatase activity and membrane association. Cell 99, 323–334 (1999).
25. Elstrom, R. L. et al. Akt stimulates aerobic glycolysis in cancer cells. Cancer Res.
64, 3892–3899 (2004).
26. Manning, B. D. & Cantley, L. C. AKT/PKB signalling: navigating downstream. Cell
129, 1261–1274 (2007).
27. Warburg, O. On the origin of cancer cells. Science 123, 309–314 (1956). 28. Gustafson, S., Zbuk, K. M., Scacheri, C. & Eng, C. Cowden syndrome. Semin. Oncol.
34, 428–434 (2007).
29. Alimonti, A. et al. Subtle variations in Pten dose determine cancer susceptibility.
Nat. Genet. 42, 454–458 (2010).
30. Perez-Tenorio, G. et al. PIK3CA mutations and PTEN loss correlate with similar prognostic factors and are not mutually exclusive in breast cancer. Clin. Cancer Res.
13, 3577–3584 (2007).
31. Chen, D. et al. LIFR is a breast cancer metastasis suppressor upstream of the Hippo-YAP pathway and a prognostic marker. Nat. Med. 18, 1511–1517 (2012).
32. Yuan, J., Luo, K., Zhang, L., Cheville, J. C. & Lou, Z. USP10 regulates p53 localization and stability by deubiquitinating p53. Cell 140, 384–396 (2010). 33. Giaccia, A. J. & Kastan, M. B. The complexity of p53 modulation: emerging patterns
from divergent signals. Genes. Dev. 12, 2973–2983 (1998).
34. Salmena, L., Carracedo, A. & Pandolfi, P. P. Tenets of PTEN tumour suppression.
METHODS
Cell culture. The HEK293T, HeLa, PC3, MCF10A, MCF7, MDA-MB-231
MDA-MB-436, MDA-MB-468, T47D and BT549 cell lines were from the American Type Culture Collection and were cultured under conditions specified by the manufacturer. The SUM159 cell line was from S. Ethier (Medical University of South Carolina, USA) and cultured as described at
http://www. asterand.com/Asterand/ human_tissues/159PT.htm. The HCT116PTEN+/
+ and HCT116PTEN−/− cell lines were described previously35 . For insulin
stimulation, cells were starved in serum-free medium overnight, followed by treatment with 10 ng ml−1 insulin (Roche) for
15 min. The AKT inhibitor MK-2206 was purchased from Selleckchem and was used at 1 µM.
Plasmids and shRNA. Thirty DUB ORFs were purchased from the Dana-Farber/
Harvard Cancer Center DNA Resource Core and individually subcloned into the pBabe-SFB vector using the Gateway system (Invitrogen). Five PTEN-interacting DUB ORFs were subcloned into a FLAG-tagged retroviral vector. GST-tagged USP13 was generated by subcloning into the pDEST vector (Invitrogen). Full-length PTEN ORF and various deletion mutant constructs were described previously15 . The following shRNA clones were from Open
Biosystems through MD Anderson’s shRNA and ORFeome Core, and the clone numbers are as follows: USP13 shRNA, V3LHS_356746 (5
-CCATGTGAACAATGATCCA-3 ) for #1 and V2LHS_47077 (5 -TTTCCAGTGAAGTACACAG--CCATGTGAACAATGATCCA-3 ) for #2; USP7 shRNA, V3LHS_344363 (5 -AGTATCTTGAATAAATCCT-3 ); USP8 shRNA, V2LHS_49252 (5 -TGTCCTTTAATCTTAAATG-3 ) for #1 and V2LHS_49253 (5 -TATCTCTTCCGATTATCAG-3 ) for #2; USP10 shRNA, V3LHS_361009 (5 -TACATTCTCCAGCAACTCT-3 ) for #1 and V3LHS_408713 (5 -AGACTAACATTTTAACTCC-3 ) for #2; USP39 shRNA, V3LHS_636371 (5 ATTCTTGTGTACTGCTTGT3 ). The PTEN shRNA (5 -CCACAGCTAGAACTTATCAAA-3 and 5 -CCACAAATGAAGGGATATAAA-3 ) was described previously36 . The USP13C345A mutant and the RNAi-resistant
USP13 mutant (USP13-RE) were generated using a QuikChange Site-Directed Mutagenesis Kit (Stratagene). The primers used for generating the USP13C345A
mutant are 5 -GAACCTGGGCAACAGCGCCTATCTCAGCTCTGTC-3 and 5 -GACAGAGCTGAGATAGGCGCTGTTGCCCAGGTTC-3 ; the primers used for generating the USP13-RE mutant are 5 -CCGAGGTGGCCTTCAACTGGATAATC-GTACATATGGAAGAGCCAGATTTTGC-3 and 5 -GCAAAATCTGGCTCTTCC-ATATGTACGATTATCCAGTTGAAGGCCACCTCGG-3 .
Immunoblotting. Western blot analyses were performed with precast gradient
gels (Bio-Rad) using standard methods. Briefly, cells were lysed in NETN buffer (100 mM NaCl, 1 mM EDTA, 20 mM Tris-Cl (pH 8.0) and 0.5% NP-40) containing protease inhibitors (Roche) and phosphatase inhibitors (Sigma). Proteins were separated by SDS–PAGE and blotted onto a nitrocellulose membrane (Bio-Rad). Membranes were probed with the specific primary antibodies and then with peroxidase- conjugated secondary antibodies. The bands were visualized by chemiluminescence (Denville Scientific). The following antibodies were used: antibodies against PTEN (1:1,000, Santa Cruz, SC-7974, clone A2B1), USP13 (1:1,000, Bethyl, A302-762A), USP8 (1:1,000, Bethyl, A302-929A), USP7 (1:1,000, Bethyl, A300-033A), USP10 (1:1,000, Bethyl, A300-900A), USP39 (1:1,000, Santa Cruz, SC-82392), MYC (1:5,000, Santa Cruz, SC-40, clone 9E10), HSP90 (1:5,000, BD Transduction Laboratories, 610419, clone 68/Hsp90), â-actin (1:5,000, Sigma, A5441, clone
AC-15), HA (1:2,500, Santa Cruz, SC-7392, Clone F-7), FLAG (1:5,000, Sigma, F3165, clone M2), p-AKT (Ser473, 1:1,000, Santa Cruz, SC-7985-R), p-AKT (Thr308, 1:1,000, Cell Signaling, 9275), AKT (1:1,000, Santa Cruz, SC-5298, clone B-1), p-FOXO1(Thr24)/FOXO3(Thr32) (1:1,000, Cell Signaling, 9464), FOXO1 (1:1,000, Cell Signaling, 2880, clone C29H4), cyclin A2 (1:1,000, Cell Signaling, 4656, clone BF683), PLK1 (1:1,000, Cell Signaling, 4513, clone 208G4) and GAPDH (1:5,000, Pierce, MA5-15738, clone GA1R). The ImageJ program (http://rsbweb.nih. gov/
ij/download.html) was used for densitometric analyses of western blots, and the
quantification results were normalized to the loading control.
In vitro binding assay. Bacterially expressed GST–GFP or GST–USP13 was retained on glutathione–Sepharose beads (Amersham) and incubated with extracts of FLAG-PTEN-transfected 293T cells for 1 h at 4 ◦ C. The complexes were
washed three times with NETN buffer, eluted by boiling in SDS sample buffer and separated by SDS-PAGE. Immunoblotting was done with the antibody to FLAG.
Immunoprecipitation and pulldown assays. Cells were collected and lysed in
NETN buffer containing protease inhibitors (Roche). For pulldown of SFB-tagged proteins, cell extracts were incubated with S-protein beads for 2 h at 4 ◦ C.
For immunoprecipitation of protein complexes, cell extracts were pre-cleared with protein-A/G beads (Santa Cruz, SC-2003) and incubated with the indicated antibody for 2 h at 4 ◦ C. The beads were washed three times with NETN
buffer, and the
bound proteins were eluted by boiling in 1× Laemmli buffer and subjected to immunoblotting with the indicated antibodies.
Tandem affinity purification. HeLa cells were transfected with SFB-tagged PTEN
or USP13. The expression of exogenous protein was confirmed by immunoblotting. For affinity purification, a total of twenty 10-cm dishes of HeLa cells expressing SFB-tagged PTEN or USP13 were lysed in NETN buffer containing protease inhibitors for 20 min at 4 ◦ C. Crude lysates were cleared by centrifugation, and the
supernatants were incubated with 300 µl streptavidin–Sepharose beads (Amersham) for 2 h at 4 ◦ C. The beads were washed three times with NETN buffer,
and the bound proteins were eluted with NETN buffer containing 2 mg ml−1 biotin
(Sigma) at 4 ◦ C. The eluates were incubated with 100 µl S-protein agarose beads
(Novagen) for 2 h at
4 ◦ C and the beads were washed three times with NETN buffer. The proteins bound
to the beads were eluted by boiling with SDS sample buffer, resolved by SDS–PAGE, visualized by Coomassie blue staining and subjected to mass spectrometric analysis (Taplin Biological Mass Spectrometry Facility at Harvard; see details below).
Mass spectrometry. After Coomassie blue staining, excised gel pieces were
subjected to in-gel trypsin digestion37 and dried. Samples were reconstituted in 5 µl
of HPLC solvent A (2.5% acetonitrile and 0.1% formic acid). A nanoscale reverse-phase HPLC capillary column was created by packing 5 µm C18 spherical silica beads
into a fused silica capillary (100 µm inner diameter; ∼20 cm length) with a
flame-drawn tip. After the column was equilibrated, each sample was loaded onto the column by a Famos autosampler (LC Packings). A gradient was formed and peptides were eluted with increasing concentrations of solvent B (97.5% acetonitrile and 0.1% formic acid). Eluted peptides were subjected to electrospray ionization and then entered an LTQ Velos ion-trap mass spectrometer (ThermoFisher). Peptides were detected, isolated and fragmented to produce a tandem mass spectrum of specific fragment ions for each peptide. Peptide sequences (and hence protein identity) were determined by matching protein databases with the acquired fragmentation pattern by using the software program SEQUEST (version 28, ThermoFisher). Mass tolerance was set to 2.0 for precursor ions and 1.0 for fragment ions. The database searched was the Human IPI database (version 3.6). The number of entries in the database was 160,900, which included both the target (forward) and the decoy (reverse) human sequences. Spectral matches were filtered to contain a less than 1% false discovery rate at the peptide level based on the target–decoy method38 . When peptides matched to multiple proteins, the
peptide was assigned so that only the most logical protein was included. The same principle was used for isoforms when present in the database. The longest isoform was reported as the match.
Immunofluorescence. Cells were cultured in chamber slides overnight and fixed
with 3.7% formaldehyde in PBS for 10 min at 4 ◦ C, followed by permeabilization
with 0.5% Triton X-100 in PBS for 10 minutes. Cells were then blocked for nonspecific binding with 10% goat serum in PBS and 0.1% Tween-20 (PBST) overnight, and incubated with the antibody against PTEN (1:300, Santa Cruz, SC-7974, Clone A2B1) or USP13 (1:300, Bethyl, A302-762A) for 1 h at room temperature, followed by incubation with Alexa Fluor 488 goat anti-mouse IgG (1:1,000, Invitrogen, A11001) or Alexa Fluor 594 goat anti-rabbit IgG (1:1,000, Invitrogen, A11012) for 30 min at room temperature. Coverslips were mounted on slides using anti-fade mounting medium with DAPI. Immunofluorescence images were acquired on a Zeiss Axio Observer Z1 fluorescence microscope. For each channel, all images were acquired with the same settings.
Virus production and infection. Virus-containing supernatant was collected
48 h and 72 h after co-transfection of pCMV-VSV-G, pCMV '"8.2 (for lentivirus production; pUMVC was used for retrovirus production) and the shRNA- or ORF-containing vector into HEK293T cells, and then added to the target cells. Twenty-four hours later, the infected cells were selected with 10 µg ml−1 blasticidin
(Gibco, A11139-03, for pLOC vector) or 2 µg ml−1 puromycin (Gibco, A11138-03,
for pGIPZ vector and the FLAG-tagged retroviral vector).
Cell proliferation assay. Equal numbers of cells were plated in 12-well plates in
triplicate. From the next day, cells were fixed with 10% methanol and stained with 0.1% crystal violet (dissolved in 10% methanol) every day. After staining, wells were washed three times with PBS and destained with acetic acid. The absorbance of the crystal violet solution was measured at 590 nm.
RNA isolation and quantitative PCR. Total RNA was isolated with TRIzol
reagent (Life Technologies) and then reverse transcribed with an iScript cDNA Synthesis Kit (Bio-Rad). Quantitative PCR was performed on a CFX96 instrument (Bio-Rad) by using TaqMan probes (Life Technologies): PTEN, Hs02621230_s1; USP13, Hs00187594_m1; GAPDH, Hs02758991_g1. Data were normalized to
Anchorage-independent growth assay. Cells were resuspended in 1 ml of 0.35% low-melting agarose (Invitrogen) in DMEM supplemented with 10% FBS and plated in triplicate in six-well plates on 1 ml of pre-solidified 0.65% agarose in the same medium, with 1 ml of medium covering the cells. After incubation at 37 ◦ C in 5% CO
2 for 3–4 weeks, plates were stained with crystal violet and
scanned on a GelCount system (Oxford Optronix). Colonies were counted by using the ImageJ program (http://rsbweb.nih.gov/ij/download.html).
Deubiquitylation of PTEN in vivo and in vitro. For the in vivo
deubiquitylation assay, HEK293T cells were transfected with MYC–PTEN, HA– ubiquitin and USP13
ORF or shRNA, and then treated with 10 µM MG132 (Fisher Scientific) for
6 h. MYC–PTEN was immunoprecipitated with MYC beads and subjected to immunoblotting with antibodies against HA and MYC. For preparation of PTEN as the substrate for the in vitro deubiquitylation assay, HEK293T cells were transfected with SFB–PTEN with or without HA–ubiquitin co-transfection and were treated with 10 µM MG132 for 6 h. Unubiquitylated or ubiquitylated SFB–PTEN was purified from the cell extracts with streptavidin–Sepharose beads. After extensive washing with NETN buffer, the bound proteins were eluted with NETN buffer containing 2 mg ml−1 biotin. GST-tagged USP13 or the USP13C345A mutant was
expressed in the Escherichia coli strain BL21. After induction with 0.4 mM IPTG, cells were lysed, and GST–USP13 was purified with glutathione–Sepharose-4B beads (Amersham Biosciences) and eluted with PBS containing 10 mM L-glutathione (Sigma). Alternatively, SFB-tagged USP13 or the USP13C345A mutant was transfected
into HEK293T cells, purified with streptavidin–Sepharose beads and eluted with biotin. An in vitro deubiquitylation reaction was performed as described previously32 with minor modifications: briefly, eluted SFB–PTEN was incubated
with purified USP13 in deubiquitylation buffer (50 mM Tris-HCl (pH 8.0), 50 mM NaCl, 1 mM EDTA, 10 mM dithiothreitol and 5% glycerol) for 2 h at 37 ◦ C.
After reaction, PTEN was immunoprecipitated with the antibody against PTEN or FLAG. The beads were washed with deubiquitylation buffer, and the bound proteins were eluted by boiling
in 1× Laemmli buffer and subjected to immunoblotting with the antibodies against HA, FLAG and PTEN.
Fractionation. Fractionation of nuclear and cytoplasmic proteins was done by
using the NE-PER Nuclear and Cytoplasmic Extraction Kit (Thermo) according to the manufacturer’s protocol. After fractionation, 30 µg of protein was used for western blot analysis of PTEN in the cytoplasm and nucleus. HSP90 and lamin B were used as markers of cytoplasm and the nucleus, respectively.
Lactate production assay. Cells were plated in 24-well plates and cultured
overnight. The culture medium was removed from the cells and the lactate concentration was determined using lactate test strips on a Lactate Plus meter (Nova Biomedical). Next, cells were collected, stained with trypan blue, and viable cell numbers were counted on a TC10 Automated Cell Counter (Bio-Rad). Lactate production was expressed as lactate concentration per 104 viable cells.
Glucose uptake assay. Cells (2 × 10⁵ ) were seeded in 12-well plates. The next
day, cells were washed twice with PBS and then incubated in 1 ml PBS containing 0.1 mM
2-deoxyglucose (Sigma) and 1 µCi ml−1 2-deoxy-D-[3 H]glucose (Amersham). After
incubation for 30 minutes, cells were washed three times with PBS and lysed. [3 H]glucose uptake was detected in 10 ml of scintillant on a Liquid Scintillation
Analyser TRI-CARB 3100TR (Packard). Nonspecific deoxyglucose uptake was measured in the presence of 20 µM cytochalasin B (Sigma) and was subtracted from the total uptake to obtain specific glucose uptake.
In vivo tumorigenesis study. All animal experiments were performed in accordance with a protocol approved by the Institutional Animal Care and Use
Committee of MD Anderson Cancer Center. When used in a power calculation, our sample size predetermination experiments indicated that 5 mice per group can identify the expected effect of USP13 or PTEN on tumour size and weight (P < 0.05) with 100% power. Animals were randomly assigned to different groups. Tumour
cells (5 × 10⁶ ) in 30 µl growth medium (mixed with Matrigel at a 1:1 ratio)
were
injected subcutaneously into the flank of six- to eight-week-old female nude mice using a 100-µl Hamilton microlitre syringe. Tumour size was measured every five days using a caliper, and tumour volume was calculated using the standard formula: 0.5 × L × W 2 , where L is the longest diameter and W is the shortest diameter.
Mice
were euthanized when they met the institutional euthanasia criteria for tumour size and overall health condition. The tumours were removed, photographed and weighed. A laboratory technician (M Wang) who provided animal care and measured tumour growth was blinded to the group allocation during all animal experiments and outcome assessment.
Patient study. The breast cancer progression tissue microarrays were purchased
from the National Cancer Institute Cancer Diagnosis Program. These tissue microarrays consist of three different case sets, including 201–206 analysable cases of breast carcinoma and 38-44 analysable cases of normal breast tissue. Samples were deparaffinized and rehydrated. Antigen retrieval was done by using 0.01 M sodium-citrate buffer (pH 6.0) in a microwave oven. To block endogenous peroxidase activity, the sections were treated with 1% hydrogen peroxide in methanol for 30 min. After 1 h pre-incubation in 10% normal serum to prevent nonspecific staining, the samples were incubated with the antibodies against PTEN (1:50, Dako, M3627, Clone 6H2.1) and USP13 (1:1,500, Bethyl, A302-762A) at 4 ◦
C overnight. The sections were then incubated with a biotinylated secondary antibody, followed by incubation with avidin–biotin peroxidase complex solution (1:100) for 1 h at room temperature. Colour was developed with the 3-amino-9-ethylcarbazole (AEC) solution. Counterstaining was carried out using Mayer’s haematoxylin. All immunostained slides were scanned on the Automated Cellular Image System III (ACIS III) for quantification by digital image analysis. A total score of protein expression was calculated from both the percentage of immunopositive cells and immunostaining intensity. High and low protein expression was defined using the mean score of all samples as a cutoff point. The ÷
2 test was used for statistical analysis of the correlation between PTEN and USP13,
and the correlation of PTEN or USP13 with tissue type (normal versus cancer).
Statistical analysis. Each experiment was repeated three times or more. Unless
otherwise noted, data are presented as mean ±s.e.m., and Student’s t -test (unpaired, two-tailed) was used to compare two groups for independent samples. The data
analysed by t -test meet normal distribution; we used an F -test to compare variances, and the variances are not significantly different. Therefore, when using an unpaired t -test, we assumed equal variance, and no samples were excluded from the analysis. P < 0.05 was considered statistically significant.
35. Lee, C., Kim, J.S. & Waldman, T. PTEN gene targeting reveals a radiation-induced size checkpoint in human cancer cells. Cancer Res. 64, 6906–6914 (2004). 36. Kim, J. S., Lee, C., Bonifant, C. L., Ressom, H. & Waldman, T. Activation of
p53-dependent growth suppression in human cells by mutations in PTEN or PIK3CA.
Mol. Cell Biol. 27, 662–677 (2007).
37. Shevchenko, A., Wilm, M., Vorm, O. & Mann, M. Mass spectrometric sequencing of proteins silver-stained polyacrylamide gels. Anal. Chem. 68, 850–858 (1996).
38. Elias, J. E. & Gygi, S. P. Target-decoy search strategy for increased confidence in large-scale protein identifications by mass spectrometry. Nat. Methods 4, 207–214 (2007).
1
Supplementary Figure 1 Effects of five PTEN-interacting
deubiquitinases on cell proliferation and colony formation. (a) Five FLAG-tagged DUBs were expressed in MCF7 cells, immunoprecipitated with FLAG beads and immunoblotted with antibodies to PTEN and FLAG. (b) Growth curves of MCF7 cells transduced with USP7, USP8, USP10, USP13 or USP39. (c, d) Images (c) and quantification (d) of
anchorage-independent growth of MCF7 cells transduced with USP7, USP8, USP10, USP13 or USP39. Data in (b) and (d) are the mean of 3 wells per group and error bars indicate s.e.m. The experiments were repeated 3 times. Statistical significance was determined by two-tailed, unpaired Student’s t test. Uncropped images of blots are shown in Supplementary Fig. S6.
Supplementary Figure 2 Regulation of PTEN and AKT signaling by USP13. (a) Immunoblotting of USP13, PTEN and b-actin in a series of human breast cancer cell lines. (b) Immunoblotting of USP13, PTEN, p-AKT, AKT, p-FOXO1/3, FOXO1 and HSP90 in MDA-MB-231 cells transduced with USP13 alone or in combination with PTEN shRNA. (c) Immunoblotting of FLAG-USP13, HA-GFP and b-actin in 293T cells transfected with USP13 shRNA in combination with FLAG-tagged wild-type USP13 or an RNAi- resistant mutant of USP13 (USP13-RE). Co-transfected HA-GFP serves
as the control for transfection. (d) Immunoblotting of USP13, PTEN, p-AKT, AKT, p-FOXO1/3, FOXO1 and HSP90 in USP13 shRNA-transduced SUM159 cells with or without ectopic expression of an RNAi-resistant mutant of USP13 (USP13-RE). (e) Immunoblotting of USP13, PTEN,
p-AKT, AKT and b-actin in USP13 shRNA-transduced SUM159 cells with or without ectopic expression of PTEN. Cells were serum-starved and treated with 10 ng/ml insulin for 15 minutes. Uncropped images of blots are shown in Supplementary Fig. S6.
Supplementary Figure 3 USP13 does not alter PTEN mRNA levels. (a) qPCR of PTEN and USP13 in USP13 shRNA-transduced SUM159 cells. (b) qPCR of PTEN in MDA-MB-231 cells transduced with wild-type USP13
or the USP13C345A mutant. Data in (a) and (b) are the mean of 3 triplicates per group and error bars indicate s.e.m. The experiments were repeated 3 times.
Supplementary Figure 4 USP7, USP10, USP8 and USP39 do not regulate PTEN protein levels. Immunoblotting of the USP, PTEN and HSP90 in SUM159 cells with knockdown of USP7 (a), USP10 (b), USP8 (c) or USP39 (d). Uncropped images of blots are shown in Supplementary Fig. S6.