行政院國家科學委員會專題研究計畫 成果報告
科技大學及技術學院工程科技系績效指標建構之研究
計畫類別: 個別型計畫 計畫編號: NSC93-2413-H-003-030- 執行期間: 93 年 08 月 01 日至 94 年 07 月 31 日 執行單位: 國立臺灣師範大學工業科技教育學系(所) 計畫主持人: 李隆盛 共同主持人: 賴春金,張良德 計畫參與人員: 林坤誼 報告類型: 精簡報告 報告附件: 出席國際會議研究心得報告及發表論文 處理方式: 本計畫可公開查詢中 華 民 國 94 年 10 月 7 日
Developing Performance Indicators for Engineering Technology Programs
in the Universities/Colleges of Technology in Taiwan
Lung-Sheng Lee
Department of Business Management
National United University
Chun-Chin Lai
Department of Infant and Child Care
National Taipei College of Nursing
Liang-Te Chang
Department of Electronic Engineering
De Lin Institute of Technology
Kuen-Yi Lin
Department of Industrial Technology Education
National Taiwan Normal University
Abstract
Highly expected to prepare quality engineering technology (ET) personnel, the ET
programs in the universities/colleges of technology (UTs/CTs) in Taiwan have been
anticipated to assure their performance. Performance indicators (PIs) are quantifiable
measures that reflect whether you are successfully meeting or falling short of your goals.
As for ensuring the performance of ET programs, performance indicators (PIs) are popular measures to monitor performance. The purpose of this study was to develop PIs for ET
programs in the UTs/CTs in Taiwan. Literature review, panel discussion, and questionnaire
174 department heads in ET programs, the following conclusions are made: (1) The ET
program heads in public and private institutions have the same point of views in the
importance of PIs developed in this study; (2) There are 12 key performance indicators (KPIs)
strongly recommended to be utilized in monitoring the performance of ET programs; (3) The
12 KPIs can be divided into three categories as satisfaction, enrolment, and revenues.
Keywords: performance indicators, key performance indicators, engineering technology
programs.
I. INTRODUCTION
During the past decades, Taiwan has created an economic miracle and its entire society has
been going through rapid transformation. With the great impact from the transformation,
Taiwan becomes a Green Silicon Island, where needs not only engineering (E) but also
engineering technology (ET) workforce. At present, ET in Taiwan at least has the following
concerns:
A. Engineering technology education (ETE) is highly expected to perform well
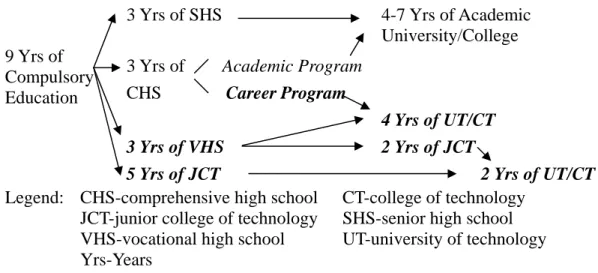
Beyond nine years of compulsory education, formal education in Taiwan is streamed into
the following two tracks, which are like “two legs walking” to prepare the workforce: (1)
General academic education (GAE)—mainly including three years of college-bound
coursework in senior high schools (SHSs) as well as comprehensive high schools (CHSs),
and four to seven years of coursework at the academic university/college level; (2)
Technological and vocational education (TVE)—mainly including the institutions/programs
highlighted in Figure 1. All universities/colleges and JCTs in both GAE and TVE systems,
shown in Figure 1, are categorized as higher education institutions. In the past decade (school
159) (see Figure 2).
3 Yrs of SHS 4-7 Yrs of Academic
University/College Academic Program 3 Yrs of CHS Career Program 4 Yrs of UT/CT 3 Yrs of VHS 2 Yrs of JCT 9 Yrs of Compulsory Education
5 Yrs of JCT 2 Yrs of UT/CT Legend: CHS-comprehensive high school CT-college of technology
JCT-junior college of technology SHS-senior high school VHS-vocational high school UT-university of technology Yrs-Years
Figure 1. Formal education structure in Taiwan
0 50 100 150 200 1995 1997 1999 2001 2003 School Year N um be r of H ig he r E du ca tio n In st itu tio n University/College Junior College of Technology Total
Figure 2. The number changes of higher education institutions [1]
B. Performance indicators (PIs) are measures to monitor performance
With the transformation to high-tech age, people can handle more and more things in their
daily life. Accordingly, the need of high performance in organization of business is
increasing. In order to measure the performance in organization of business, many business
companies developed PIs in order to monitor their performance. Due to the trend of
public sector have supported to include performance measurement on the improvement
agenda of higher education institutions.
In the literature on the measurement of school performance in higher education, Cullen,
Joyce, Hassal, and Broadbent [2] used a balanced scorecard (BSC) in order to ensure the
quality in higher education and attempted to transfer from monitoring to management. In
addition to the development of BSC, the development and application of performance
indicators (PIs) have become an integral part of many western governments’ approach to the
management of the higher education system. In their push for PIs in higher education, the
governments have made numerous claims about the benefits can be obtained from the
applications of PIs, such as improved accountability and feedback on work performance [3,
p.379]. Besides, Barnetson and Cutright argued that PIs in higher education are conceptual
technologies that shape what issues we think about and how we think about those issues by
embedding normative assumptions into the selection and structure of those indicators [4,
p.277].
At the level of higher education, ET is one of the most important fields. Due to the needs
of human resources in the field of ET, the performance of ET programs should be highly
emphasized. In order to ensure the quality of ET programs, Accreditation Board for
Engineering and Technology (ABET) is recognized by the Council on Higher Educational
Accreditation and one of its major purposes is to develop standards for ensuring the quality of
ET programs [5]. The spirit of accreditation standards developed by ABET is the same with
PIs, both of them focus on monitoring the quality of ET programs. Therefore, it is
important to develop PIs for ET programs in UTs/CTs in Taiwan, and this is also the major
II. LITERATURE RIVEW
A. Methodological Approaches in Constructing PIs
In the literature on methodological approach in constructing PIs, Coombes, Raybould
and Wong [6] advocate the use of a combined “top-down” and “bottom-up” approach
characterized by the identification of indicators to assess the potential for urban regeneration.
The major reason is that the ‘top–down’ approach requires a preliminary analysis of the
concept, before breaking it down into a typology of factors. In contrast, the ‘bottom–up’
approach lists the factors that can be argued to be individually important, usually from
grassroots level [7]. Besides, Hemphill, Berry and McGreal [8] use four phases
methodological approach in constructing local area-specific indicators (Figure 3).
Figure 3. Methodological Approach [8, p.729] Literature review of urban regeneration and sustainable development principles and testing of main issues at structured interviews Phase 1: Informing Phase 2: Model development and weighting
Development of hierarchical model based on information gathered in phase 1 and structuring of Delphi-style questionnaire survey instrument
Analysis of two Delphi rounds for the purposes of consensus attainment and initiation of multi-criteria analysis to establish relative weightings
Phase 3:
Indicator selection and points scoring
Establish indicators sets, points scoring framework and data source instruments ahead of testing by expert opinion
Phase 4: Case study application and sensitivity
Testing of weighted indicators at case-study level in three cities
Comparison of case-study results and application of sensitivity analysis to indicator scoring totals
According to the methodological approach mentioned by Hemphill, Berry, and McGreal
[8], the methodological approach can be revised with better research approach. On the hand
of top-down, PIs in ET programs can be developed by the following five steps: literature
review, PIs selection, criteria for selecting PIs, constructing a draft set of PIs, and panel
discussion. These steps are explained as follows:
1) Literature review: In order to develop the draft of PIs in any research topics, literature
review of research topics and sustainable development principles should be conducted firstly.
2) PIs selection: After the review of literature, the PIs selection should follow Coombes
and Wong’s [9] four-step procedure in determining the selection of indicators as follows: (a)
Conceptual consolidation: clarifying the basic concept to be presented in the analysis; (b)
Analytical structuring: providing a structure within which the indicators can be collated; (c)
Indicator identification: translation of the structure developed in Step 2 into specific
measurable indicators; (d) Index creation: process of synthesizing the proposed indicators
into a single/composite measure.
3) Criteria for selecting PIs: The development and selection of indicators is a long and
complex process, where the selection of some may be obvious, but in other situations either it
is not clear which indicators are the most appropriate, or the data to evaluate the preferred
indicator are not available [8, p.729]. Therefore, there is no doubt that when we want to
select PIs in UTs/CTs, the setting of criteria is necessary.
Hatry, Blair, and Fisk [10] suggested that the following criteria to frame the selection of
performance measures: (a) appropriateness and validity; (b) uniqueness, accuracy and
reliability; (c) completeness and comprehensibility; (d) controllability; (e) cost and feedback
time. And Kaufman [11] pointed that useful performance indicators best related to valid
ends: results, consequences, performance, and payoffs. However, Shavelson, McDonnell,
information pertinent to current or potential problems; (c) measure factors that policy can
influence; (d) measure observed behavior rather than perceptions; (e) be reliable and valid; (f)
provide analytical links; (g) be feasible to implement; and (h) address a broad range of
audiences.
On the other hand, the Association of Universities and College of Canada [13] mentioned
that the key features of performance indicators were as follows: (a) are goal or result
oriented- related to missions or outcomes; (b) have a reference point- a target, performance
over time or comparison across institutions; (c) provide strategic information about the
condition, health or functioning of the institution/system; (d) are evaluative- the purpose is to
assess, judge; (e) are strategic, specific, policy-oriented and issue-driven; (f) connect
outcomes to structure and process, taking inputs into account; (g) are used for improvement,
enhancement, positive reform.
Furthermore, Department of the Environment, Transport and the Regions [14] also
mentioned that indicators must be capable of satisfying various criteria in terms of being
scientifically sound, technically robust, easily understood, sensitive to change, measurable
and capable of being regularly updated. In addition, Lee and Lai [15] identified KPIs for ET
programs according to the following criteria: (a) alignment with UTs/CTs missions; (b)
linkage to overall ET program objectives; (c) access to specific information regarding
program problems; (d) measurement of observed behavior rather than perceptions; (e)
reliability and validity; (f) access to analytical links; (g) feasibility of implementation; and (h)
addresses a broad range of audiences.
In order to generate the most appropriate criteria for selecting PIs, a two dimension table
was utilized to check if each possible PI meets the following adapted criteria: (a) alignment
with UTs/CTs missions; (b) linkage to overall objective; (c) connecting outcomes to structure
issue-driven; (e) reliability and validity; (f) accessing to analytical links; (g) feasibility of
implementation; and (h) addressing a broad range of audiences.
4) Constructing a draft set of PIs in ET programs: Kaufman [11] suggested an optional
template for including internal and external usefulness in deriving PIs as figure 4. Therefore,
through the process of selecting PIs in ET programs, Kaufman’s template can be used to
construct a set of PIs.
Inputs Processes Products Outputs Outcomes
Example goals, objectives teaching, learning competency job placement, certified licenses safety of outputs
Scope (Organizational) Internal (Societal) External
Cluster Organizational Efforts Organizational Results Societal Results/Impact Figure 4. An optional template for including internal and external usefulness in deriving PIs
[11, p.81]
5) Panel discussion: In order to confirm the appropriate of the draft of PIs in ET programs,
panel discussion should be conducted in order to develop a serious draft from the viewpoints
of top-down approach.
In order to make the PIs practicable, the following steps of bottom-up approach should also
be adopted in this study:
1) Field interview: For the purpose of understanding the viewpoints of ET department
heads, field interview should be conducted in order to revise the draft of PIs for ET programs.
2) Questionnaire survey: After revise the set of PIs for ET programs by field interview, the
last and most important work is conducting the questionnaire survey. Through the
questionnaire survey, the opinions of ET department heads can be collected and utilized in
B. PIs for Departments of ET
The purpose of this study was to develop PIs for ET programs, so fore, literature review
of PIs in higher education, Accreditation Board for Engineering and Technology (ABET) are
necessary. Meanwhile, the criteria of selecting PIs were also reviewed.
1) PIs in Higher Education
PIs have grown in popularity in higher education institutions around the world. For
example, the Oregon University System (OUS) in the United States implemented PIs in the
late 1990’s. The OUS’s 12 KPIs are as follows: (a) total credit enrolment, (b) new
undergraduate enrolment, (c) freshman persistence, (d) six-year graduation rates, (e) total
degree production, (f) degrees in shortages areas, (g) philanthropy, (h) recent graduates, (i)
graduate success, (j) faculty compensation, (k) research and development (R&D), as well as
(l) internships [16]. Johnes and Taylor [17, p.174] also mentioned five PIs in higher
education as follows: (a) the non-completion rate, (b) the percentage of graduates, obtaining a
first or upper second class honours degree, (c) the percentage of graduates obtaining
permanent employment, (d) the percentage of graduates proceeding to further education or
training, and (e) the average research rating obtained by each university in the UFC’s 1989
Research Selectivity Exercise.
Besides, High Education Funding Council for England [18] also suggested five PIs in
higher education as follows: (a) access to higher education, (b) non-completion rates for
students, (c) outcomes and efficiencies for learning and teaching in universities and colleges,
(d) employment of graduates, and (e) research output. Furthermore, there were also three
different categories of PIs proposed in Jarratt Report including of “internal performance
indicators,” “external performance indicators,” “operational performance indicators [19].”
On the other hand, Burke [20, p.24] suggested 13 core indicators in higher education: (a)
a percent of state median family income; (c) Pass rates on teacher certification exams; (d)
Percent of baccalaureate freshmen with college preparatory curriculum in high school; (e)
College going rate; (f) Percent of 25-44 year olds enrolled part-time in post-secondary
education; (g) Transfer rates of two- and four-year institutions; (h) Graduation rates of two-
year (3yrs) and four-year campuses (6yrs); (i) Degrees attainment; (j) Degrees attainment
critical fields, i.e., science, engineering, technology and teacher education; (k) Job placement
rates for graduates; (l) Dollar volume of externally sponsored research; (m) Alumni survey on
the knowledge and skills developed in college.
Lee and Lai [15] completed a questionnaire survey to identify 22 KPIs for ET programs
in taiwan, which are outcome-based and compatible with ABET’s accreditation criteria as
follows: (a) Number of admitted freshman; (b) Percentage of freshmen to all admission
applicants; (c) Percentage of enrolled freshman to admitted freshman; (d) Percentage of
freshman who advance to become sophomores; (e) Percentage of graduates from the previous
school year to the quantity of the initial enrolment; (f) Percentage of graduates of the
previous school year who participated in work-based practicum; (g) Cooperative institutions’
satisfaction with students participating in work-based practicum; (h) Average graduation
credits earned by graduates of the previous school year; (i) Percentage of selective credits to
average graduation credits earned by graduates of the previous school year; (j) Average
academic grading of graduates of the previous school year; (k) Average behavioral conduct
grading of graduates of the previous school year; (l) Percentage of graduates of the previous
school year employed within three months after graduation; (m) Employed graduates’
satisfaction with their ETE learning at six months after graduation; (n) Employed graduates’
satisfaction with their compensation at six months after graduation; (o) Employers
satisfaction with ETE graduates; (p) Percentage of graduates of the previous school year
with their ETE learning at six months after graduation; (r) Continuing study institutions’
satisfaction with ETE graduates; (s) Ratio of students to full-time faculty; (t) Current
revenues per ETE student in the previous fiscal year; (u) Capital revenues per ETE student
in the previous fiscal year; and (v) Rating from the recent evaluation administered by the
Ministry of Education (MOE).
2) PIs for ET Programs
In order to select the PIs for ET programs, in this study a two dimension table was used
to select the PCorrespond with eight criteria. After the selection of PIs, 25 PIs were selected
and adapted to 21 PIs finally.
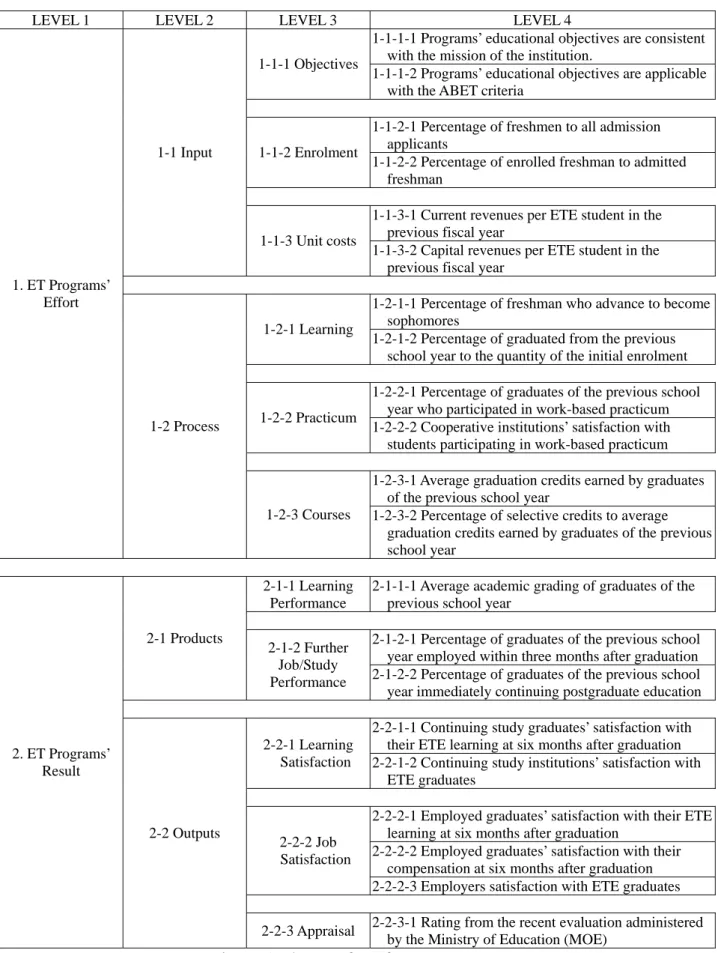
3) The Set of PIs for ET Programs
After the selection of PIs for ET programs, Kaufman’s [11] template was used to
develop the set of PIs for ET programs. However, this study focused on developing the
internal ET programs’ PIs, and external ET programs’ PIs was neglected. The set of PIs in ET
LEVEL 1 LEVEL 2 LEVEL 3 LEVEL 4
1-1-1-1 Programs’ educational objectives are consistent with the mission of the institution.
1-1-1 Objectives
1-1-1-2 Programs’ educational objectives are applicable with the ABET criteria
1-1-2-1 Percentage of freshmen to all admission applicants
1-1-2 Enrolment
1-1-2-2 Percentage of enrolled freshman to admitted freshman
1-1-3-1 Current revenues per ETE student in the previous fiscal year
1-1 Input
1-1-3 Unit costs
1-1-3-2 Capital revenues per ETE student in the previous fiscal year
1-2-1-1 Percentage of freshman who advance to become sophomores
1-2-1 Learning
1-2-1-2 Percentage of graduated from the previous school year to the quantity of the initial enrolment 1-2-2-1 Percentage of graduates of the previous school
year who participated in work-based practicum 1-2-2 Practicum
1-2-2-2 Cooperative institutions’ satisfaction with students participating in work-based practicum 1-2-3-1 Average graduation credits earned by graduates
of the previous school year 1. ET Programs’
Effort
1-2 Process
1-2-3 Courses 1-2-3-2 Percentage of selective credits to average graduation credits earned by graduates of the previous school year
2-1-1 Learning Performance
2-1-1-1 Average academic grading of graduates of the previous school year
2-1-2-1 Percentage of graduates of the previous school year employed within three months after graduation 2-1 Products
2-1-2 Further Job/Study
Performance 2-1-2-2 Percentage of graduates of the previous school year immediately continuing postgraduate education 2-2-1-1 Continuing study graduates’ satisfaction with
their ETE learning at six months after graduation 2-2-1 Learning
Satisfaction 2-2-1-2 Continuing study institutions’ satisfaction with ETE graduates
2-2-2-1 Employed graduates’ satisfaction with their ETE learning at six months after graduation
2-2-2-2 Employed graduates’ satisfaction with their compensation at six months after graduation 2-2-2 Job
Satisfaction
2-2-2-3 Employers satisfaction with ETE graduates 2. ET Programs’
Result
2-2 Outputs
2-2-3 Appraisal 2-2-3-1 Rating from the recent evaluation administered by the Ministry of Education (MOE)
III. METHODOLOGY
In order to develop the PIs in ET programs, this study uses both “top-down” and
“bottom-up” approaches as follows:
A. Literature review
In order to develop a draft of PIs, literature review and sustainable development
principles were conducted firstly.
B. Panel discussion
In order to confirm the appropriateness of the draft PIs for ET programs, a panel
discussion was conducted in order to develop draft PIs from the viewpoints of top-down
approach.
C. Questionnaire survey
For the purpose of understanding the viewpoints from ET department heads,
questionnaire survey was conducted in order to refine the draft from the viewpoints of
bottom-up. Besides, the ET department heads also ranked the importance of PIs by using
the five-point scale from “very unimportant—1” to “very important—5”. Results of the
study were based on responses received from 174 ET department heads, with a return rate of
67%.
IV. RESULTS AND DISCUSSION
A. The correlation of ranking PIs between earlier reply and later reply
Due to the non-response is likely to bias survey results, it is necessary to understand the
relationship between response and non-response [21]. Broadly speaking, the reply of
questionnaire survey can be divided into two periods. The first peak of reply can be called
earlier reply, and the second peak of reply can be called later reply, which could be
the Spearman correlation of ranking between earlier-reply and later-reply is .803 with
significance level .05 (table 2). That is to say, statistically there is no difference between
response and non-response in this study, so all responses in this study could be generalized to
population.
Table 1. The rank of PIs in earlier and later reply
Earlier Reply Later Reply
PIs M SD RANK M SD RANK 1-1-1-1 4.28 0.69 21.0 4.40 0.66 21.0 1-1-1-2 3.49 0.97 5.5 3.41 0.89 3.0 1-1-2-1 4.02 1.03 14.0 4.14 0.90 18.5 1-1-2-2 3.99 1.02 12.5 4.14 0.98 18.5 1-1-3-1 3.98 0.85 11.0 3.72 0.87 9.0 1-1-3-2 4.04 0.89 15.5 3.83 0.89 11.0 1-2-1-1 3.67 1.01 10.0 4.12 0.89 17.0 1-2-1-2 3.57 0.91 7.0 3.81 0.85 10.0 1-2-2-1 3.66 0.94 9.0 3.49 0.96 6.0 1-2-2-2 4.05 0.84 17.0 4.04 0.63 14.0 1-2-3-1 3.43 0.81 3.0 3.71 0.78 8.0 1-2-3-2 3.47 0.84 4.0 3.52 0.82 7.0 2-1-1-1 3.32 0.90 2.0 3.44 0.69 4.0 2-1-2-1 3.61 1.11 8.0 3.47 1.04 5.0 2-1-2-2 3.49 0.87 5.5 3.32 1.07 1.5 2-2-1-1 4.13 0.78 20.0 3.91 0.85 12.0 2-2-1-2 3.31 0.81 1.0 3.32 0.70 1.5 2-2-2-1 4.09 0.91 19.0 4.09 0.71 16.0 2-2-2-2 4.04 0.81 15.5 4.05 0.72 15.0 2-2-2-3 3.99 0.80 12.5 3.93 0.75 13.0 2-2-3-1 4.07 1.06 18.0 4.19 0.94 20.0 Note: The PI’s codes correspond with those in Figure 5.
Table 2. The Spearman test of ranking between previous and later reply
Rank of Earlier Reply Rank of Later Reply
Rank of Period 1 - 0.80*
Rank of Period 2 0.80* -
*
p < .05.
B. The correlation of ranking PIs between public and private institutions
institutions, a Spearman test of ranking between public and private institutions was done in
this study. Consequently, the rank of PIs in public and private institutions is shown in table 3,
and the Spearman correlation of ranking between public and private institutions is .815 with
significance level (table 4.). That is to say, statistically there is no difference between public
and private institution’s responses.
Table 3. The rank of PIs in public and private institutions
Public Institutions Private Institutions PIs M SD RANK M SD RANK 1-1-1-1 4.33 0.59 19.5 4.34 0.70 21.0 1-1-1-2 3.49 1.07 2.5 3.45 0.89 4.0 1-1-2-1 3.97 0.99 12.0 4.10 0.97 19.0 1-1-2-2 4.13 1.06 15.0 4.04 0.99 18.0 1-1-3-1 3.92 0.82 11.0 3.85 0.89 10.0 1-1-3-2 4.03 0.82 13.0 3.93 0.91 13.0 1-2-1-1 3.82 0.94 9.5 3.88 0.99 11.5 1-2-1-2 3.68 0.84 7.5 3.67 0.90 9.0 1-2-2-1 3.38 1.02 1.0 3.64 0.92 8.0 1-2-2-2 4.16 0.75 16.0 4.02 0.75 16.5 1-2-3-1 3.68 0.70 7.5 3.51 0.83 7.0 1-2-3-2 3.58 0.64 4.5 3.47 0.87 5.5 2-1-1-1 3.58 0.68 4.5 3.31 0.84 2.0 2-1-2-1 3.82 0.98 9.5 3.47 1.10 5.5 2-1-2-2 3.66 0.91 6.0 3.34 0.97 3.0 2-2-1-1 4.28 0.65 18.0 3.95 0.85 14.5 2-2-1-2 3.49 0.72 2.5 3.26 0.77 1.0 2-2-2-1 4.33 0.74 19.5 4.02 0.84 16.5 2-2-2-2 4.37 0.71 21.0 3.95 0.76 14.5 2-2-2-3 4.26 0.60 17.0 3.88 0.80 11.5 2-2-3-1 4.11 0.96 14.0 4.13 1.03 20.0 Note: The PI’s codes correspond with those in Figure 5.
Table 4. The Spearman test of ranking between public and private institutions
Rank of Public Institutions Rank of Private Institutions Rank of Period 1 - 0.82* Rank of Period 2 0.82* - * p < .05.
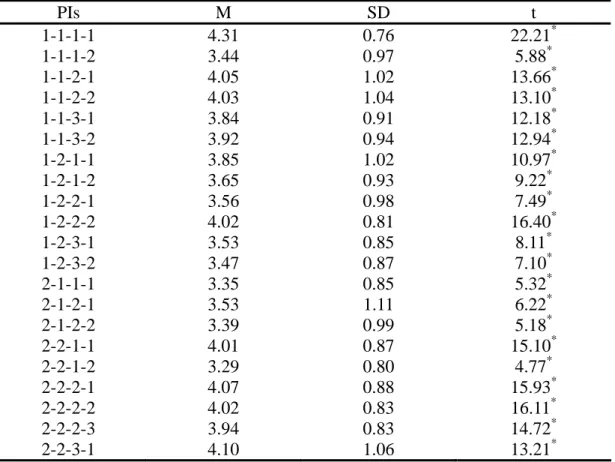
For the purpose of understanding the ranking of importance in PIs, the t-test between the
means of PIs and 3 (theoretical mean) is shown in table 5. As the results of table 5, the t-test
between the means of PIs and 3 shows all with the significance level. Therefore, the
members in ET programs are agreeing with the importance of 21 PIs developed by this study.
Table 5. The t-test between the means of PIs and 3
PIs M SD t 1-1-1-1 4.31 0.76 22.21* 1-1-1-2 3.44 0.97 5.88* 1-1-2-1 4.05 1.02 13.66* 1-1-2-2 4.03 1.04 13.10* 1-1-3-1 3.84 0.91 12.18* 1-1-3-2 3.92 0.94 12.94* 1-2-1-1 3.85 1.02 10.97* 1-2-1-2 3.65 0.93 9.22* 1-2-2-1 3.56 0.98 7.49* 1-2-2-2 4.02 0.81 16.40* 1-2-3-1 3.53 0.85 8.11* 1-2-3-2 3.47 0.87 7.10* 2-1-1-1 3.35 0.85 5.32* 2-1-2-1 3.53 1.11 6.22* 2-1-2-2 3.39 0.99 5.18* 2-2-1-1 4.01 0.87 15.10* 2-2-1-2 3.29 0.80 4.77* 2-2-2-1 4.07 0.88 15.93* 2-2-2-2 4.02 0.83 16.11* 2-2-2-3 3.94 0.83 14.72* 2-2-3-1 4.10 1.06 13.21*
Note:1. The PI’s codes correspond with those in Figure 5.
2.*p < .05.
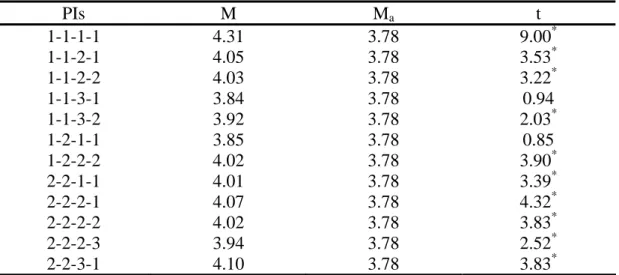
D. The selection of KPIs
The purpose of KPIs is to be utilized in monitoring the performance of organization of
business rapidly. The KPIs are those PIs having means higher than the average of all means
(Ma). The t-test between the means of PIs and the average of all means was done and shown
performance of ET programs. The 12 KPIs are: (1) Programs’ educational objectives are
consistent with the mission of the institution, (2) Percentage of freshmen to all admission
applicants, (3) Percentage of enrolled freshman to admitted freshman, (4) Current revenues
per ET student in the previous fiscal year, (5) Capital revenues per ET student in the previous
fiscal year, (6) Percentage of freshman who advance to become sophomores, (7) Cooperative
institutions’ satisfaction with students participating in work-based practicum, (8) Continuing
study graduates’ satisfaction with their ET learning at six months after graduation, (9)
Employed graduates’ satisfaction with their ET learning at six months after graduation, (10)
Employed graduates’ satisfaction with their compensation at six months after graduation, (11)
Employers satisfaction with ET graduates, (12) Rating from the recent evaluation
administered by the Ministry of Education (MOE).
Table 6. The selection of KPIs
PIs M Ma t 1-1-1-1 4.31 3.78 9.00* 1-1-2-1 4.05 3.78 3.53* 1-1-2-2 4.03 3.78 3.22* 1-1-3-1 3.84 3.78 0.94 1-1-3-2 3.92 3.78 2.03* 1-2-1-1 3.85 3.78 0.85 1-2-2-2 4.02 3.78 3.90* 2-2-1-1 4.01 3.78 3.39* 2-2-2-1 4.07 3.78 4.32* 2-2-2-2 4.02 3.78 3.83* 2-2-2-3 3.94 3.78 2.52* 2-2-3-1 4.10 3.78 3.83*
Note:1. The PI’s codes correspond with those in Figure 5.
2.*p < .05.
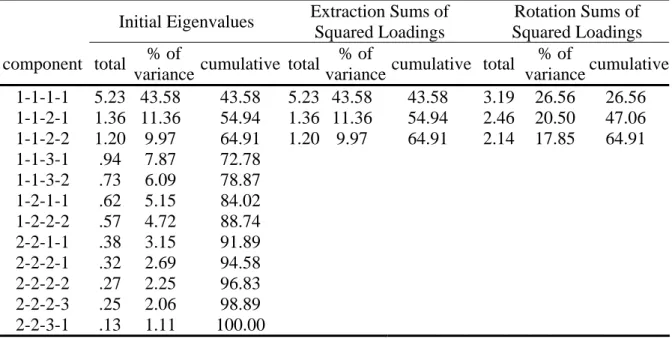
E. The factor analysis of KPIs
According to the KPIs which are selected in table 6, the factor analysis of KPIs was
of the 12 KPIs (table 7).
Table 7. Total variance explained
Initial Eigenvalues Extraction Sums of
Squared Loadings
Rotation Sums of Squared Loadings component total % of
variance cumulative total
% of
variancecumulative total
% of variance cumulative 1-1-1-1 5.23 43.58 43.58 5.23 43.58 43.58 3.19 26.56 26.56 1-1-2-1 1.36 11.36 54.94 1.36 11.36 54.94 2.46 20.50 47.06 1-1-2-2 1.20 9.97 64.91 1.20 9.97 64.91 2.14 17.85 64.91 1-1-3-1 .94 7.87 72.78 1-1-3-2 .73 6.09 78.87 1-2-1-1 .62 5.15 84.02 1-2-2-2 .57 4.72 88.74 2-2-1-1 .38 3.15 91.89 2-2-2-1 .32 2.69 94.58 2-2-2-2 .27 2.25 96.83 2-2-2-3 .25 2.06 98.89 2-2-3-1 .13 1.11 100.00
Note: The PI’s codes correspond with those in Figure 5.
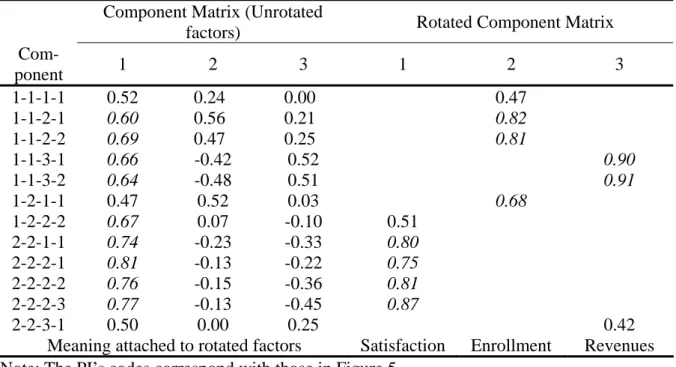
In table 8, all variables with loadings of .60 or larger with a factor are in Italic font.
Besides, all loading lower than .30 were deleted in order to clarify the structure. Finally,
three clusters of variables were generated from 12 PIs, which are named as “Satisfaction,”
Table 8. The component matrix and rotated component matrix
Component Matrix (Unrotated
factors) Rotated Component Matrix
Com- ponent 1 2 3 1 2 3 1-1-1-1 0.52 0.24 0.00 0.47 1-1-2-1 0.60 0.56 0.21 0.82 1-1-2-2 0.69 0.47 0.25 0.81 1-1-3-1 0.66 -0.42 0.52 0.90 1-1-3-2 0.64 -0.48 0.51 0.91 1-2-1-1 0.47 0.52 0.03 0.68 1-2-2-2 0.67 0.07 -0.10 0.51 2-2-1-1 0.74 -0.23 -0.33 0.80 2-2-2-1 0.81 -0.13 -0.22 0.75 2-2-2-2 0.76 -0.15 -0.36 0.81 2-2-2-3 0.77 -0.13 -0.45 0.87 2-2-3-1 0.50 0.00 0.25 0.42
Meaning attached to rotated factors Satisfaction Enrollment Revenues
Note: The PI’s codes correspond with those in Figure 5.
V. CONCLUSIONS AND SUGGESTIONS
According to the results and discussion above, the conclusions and suggestions are made as
follows:
A. The ET program heads in public and private institutions have the same viewpoints in the
importance of PIs developed in this study
The ET program heads in public and private institutions have the same point of views in
the importance of PIs developed in this study. Therefore, the 21 PIs developed in this study
can be utilized in monitoring the performance of ET programs in public and private UTs/CTs.
B. There are 12 key performance indicators (KPIs) strongly recommended to be utilized in
monitoring the performance of ET programs
In order to monitor the performance of ET programs quickly, 12 KPIs are selected in this
study. These 12 KPIs are: (1) Programs’ educational objectives are consistent with the
in the previous fiscal year, (5) Capital revenues per ET student in the previous fiscal year, (6)
Percentage of freshman who advance to become sophomores, (7) Cooperative institutions’
satisfaction with students participating in work-based practicum, (8) Continuing study
graduates’ satisfaction with their ET learning at six months after graduation, (9) Employed
graduates’ satisfaction with their ET learning at six months after graduation, (10) Employed
graduates’ satisfaction with their compensation at six months after graduation, (11)
Employers satisfaction with ET graduates, (12) Rating from the recent evaluation
administered by the Ministry of Education (MOE).
C. The 12 KPIs can be divided into three categories as satisfaction, enrolment, and revenues
According to the result of factor analysis, the 12 KPIs can be divided into three categories
as satisfaction, enrolment, and revenues. That is, if educational authorities or ET programs
wants to monitor the performance of ET programs, the fastest approach will be the utilization
of 12 KPIs.
ACKNOWLEDGMENTS
The research project supporting this paper was granted by the National Science Council,
Taiwan (Project Code: NSC 93-2413-H003-030).
REFERENCES
[1] “Important information about education statistics,” <www.edu.tw/EDU_WEB/Web/
STATISTICS/index.htm>, accessed June 6, 2005.
[2] Cullen, J., Joyce, J., Hassal, T., & Broadbent, M., “Quality in higher education: from
monitoring to management,” Quality Assurance in Education, Vol. 11, No. 1, 2003, pp.5-14.
[3] Taylor, J., “Improving performance indicators in higher education: the academics’
[4] Barnetson, B., & Cutright, M., “Performance indicators as conceptual technologies,”
Higher Education, Vol.40, 2000, pp. 277-292.
[5] “Criteria for accrediting,” < www.abet.org/images/Criteria/T001%2005-
06%20TAC%20Criteria%2011-29-04.pdf/>, accessed April 9, 2005.
[6] Coombes, M. G., Raybould, S., & Wong, C., Developing indicators to assess the
potential for urban regeneration, London: HMSO, 1992.
[7] Wong, C., “Developing quantitative indicators for urban and regional policy analysis,”
In R. Hambleton and H. Thomas (Eds). Urban policy evaluation: challenge and change
(pp.111–122). London: Paul Chapman Publishing, 1995.
[8] Hemphill, L., Berry, J.,& McGreal, S., “An indicator-based approach to measuring
sustainable urban regeneration performance: part 1, conceptual foundations and
methodological framework,” Urban Studies, Vol. 41, No. 4, 2004, pp.725-755.
[9] Coombes, M. G., & Wong, C., “Methodological steps in the development of
multivariate indexes for urban and regional policy analysis,” Environment and Planning A,
Vol. 26, 1994, pp. 1297–1316.
[10] Hatry, H. P., Blair, H. L., & Fisk, D. M., How effective are your community services?
Procedures for monitoring the effectiveness of municipal services, Washington, DC: The
Urban Institute, 1977.
[11] Kaufman, R., Preparing useful performance indicators. Training & Development
Journal, Vol. 42, No.9, 1988, pp.80-83.
[12] Shavelson, R. J., Mcdonnell, L. & Oakes, J., “Steps in designing an indicator system,”
Practical Assessment, Research & Evaluation, Vol. 2, No.12, 1991,
<pareonline.net/getvn.asp?v=2&n=12/>, accessed April 9, 2005.
[13] Association of Universities and Colleges of Canada, “A primer on performance
researchfile/1995-96/vol1n2_e.pdf/>, accessed May 21, 2005.
[14] Department of the Environment, Transport and the Regions, Sustainability counts,
London: HMSO, 1998.
[15] Lee, L. S., & Lai, C. C., “Development of key performance indicators for the
engineering technology education programs in Taiwan,” (CD) Proceedings, 2004
International Conference on Engineering Education and Research.
[16] “History of OUS Performance Indicators,” <www.ous.edu/monitoring_perf/
History_of_PI_in_Oregon.pdf>, accessed April 4, 2005.
[17] Johnes, J., & Taylor, J., Performance indicators in higher education, Buckingham:
Society for Research into Higher Education and Open University Press, 1990.
[18] “Guide to Performance Indicators in Higher Education,” <www.hefce.ac.uk/Learning
/PerfInd/2003/guide/default.asp>, accessed December 21, 2003.
[19] Jarratt Report, Report of the steering committee for efficiency studies in universities,
London: Committee of Vice-Chancellors and Principals, 1985.
[20] Burke, J. C, “Trends in higher education performance”, The Journal of State
Government, Vol. 76, No. 1, 2003, pp.23-24.
[21] Tourangeau, R., “Cognitive aspects of survey measurement and mismeasurement,”
International Journal of Public Opinion Research, Vol. 15, No.1, 2003, pp.3-7.
AUTHORS’ BIOGRAPHIES
Lung-Sheng Lee earned his Ph.D. at the Ohio State University. Dr. Lee is professor in the
Department of Business Management and the president at the National United University,
Taiwan. His current interests focus on technology education, engineering education,
curriculum and instruction, and human resource development.
Miaoli 360, Taiwan; e-mail: [email protected]
Chun-Chin Lai earned her Ph.D. at the Ohio State University. Dr. Lai is currently professor
and the department head in the Department of Infant and Child Care at National Taipei
College of Nursing. Her current interests focus on early child care and education,
management and leadership, and curriculum and instruction. .
Address: Department of Infant and Child Care, National Taipei College of Nursing, 365
Mingte Rd, Taipei 112, Taiwan; e-mail: [email protected]
Liang-Te Chang earned his Ph. D. at the Department of Industrial Education at the
National Taiwan Normal University. Dr. Chang is currently associate professor in the
Department of Electronic Engineering at De Lin Institute of Technology. His current
interests focus on electronic technology, competency-based education, and curriculum and
instruction.
Address: Department of Electronic Engineering, De Lin Institute of Technology, 1, Lane
380, Qingyun Rd., Tucheng City, Taipei County 236, Taiwan; e-mail: [email protected]
Kuen-Yi Lin is a Ph.D. candidate in the Department of Industrial Technology Education at
the National Taiwan Normal University. His current interests focus on technology education,
curriculum and instruction, and e-learning.
Address: NTNU-Dept of Industrial Technology Ed, 162 Hoping E Rd, Sec 1, Taipei 106,
![Figure 3. Methodological Approach [8, p.729] Literature review of urban regeneration and sustainable development principles and testing of main issues at structured interviews Phase 1: Informing Phase 2: Model development and weighting](https://thumb-ap.123doks.com/thumbv2/9libinfo/7068215.18689/6.892.111.718.530.995/methodological-literature-regeneration-sustainable-development-structured-informing-development.webp)