Hyperinsulinemia and Related Atherosclerotic Risk
Factors in the Population at Cardiovascular Risk:
A Community-based Study
Kuo-Liong Chien,
1Yuan-Teh Lee,
1*Fung-Chang Sung,
2Hsiu-Ching Hsu,
1Ta-Chen Su,
1and Ruey S. Lin
3Background: A population-based study was conducted in Taiwan to investigate the prevalence of insulin resis-tance and high serum insulin concentrations and their relationships with potential atherosclerotic risk factors. Methods: We studied 2165 subjects, ages >35, from a community cohort.
Results: The distributions of fasting insulin were skewed to the right, with higher concentrations in women than in men. As age increased, insulin increased in women, but decreased in men. As fasting insulin concentrations increased, postloading insulin, glucose, blood pressure, body mass index, waist-to-hip ratio, total cholesterol, triglycerides, LDL-cholesterol, apopro-tein B, plasminogen activator inhibitor 1, tissue plas-minogen activator, and fibrinogen increased, but li-poprotein(a), HDL-cholesterol, and apoprotein A1 decreased. Multiple logistic regression showed that obe-sity, high LDL-cholesterol, and low HDL-cholesterol were significant predictors of hyperinsulinemic status. Conclusion: The study subjects with insulin resistance syndrome and related risk factors may be at risk for atherosclerosis, thrombosis, and other coronary heart diseases.
© 1999 American Association for Clinical Chemistry
Hyperinsulinemia has been identified as a risk factor for hypertension and obesity as well as lipid abnormalities in adults (1–3 ). Prospective studies have also demonstrated that high plasma concentrations of insulin predict the
development of coronary heart disease (CHD),4 indepen-dent of other risk factors (1–3 ). Hyperinsulinemia, which leads to a cluster of cardiovascular risks, is well known as “insulin resistance syndrome” (4, 5 ) and is strongly re-lated to abnormalities of carbohydrate metabolism (6, 7 ). Some studies have addressed racial differences in the clustering of insulin resistance syndrome, including hy-pertension, obesity, dyslipidemia, and hyperinsulinemia
(8 ). Environmental studies showed marked differences in
CHD mortality rates among countries and relative im-pacts on atherosclerosis among populations. Racial dis-crepancies have also been reported for diabetes mellitus and insulin concentrations (9 ). Pima Americans, aborigi-nal Australians, and South Asians have relatively higher prevalences of diabetes than Caucasians (10 –12 ). Com-mon to most of these groups are a recent trend toward urbanization, a decrease in physical activity, and the development of obesity.
Populations with high incidence rates for CHD are also at high risk for diabetes (11 ), which may be related to insulin resistance. One population-based study has dem-onstrated that fasting insulin concentrations were lower in the Japanese than in Caucasians (9 ). The distribution patterns of atherosclerotic risk factors between these two ethnic groups were also different.
For the Chinese population, the distribution of fasting insulin in the general population has not yet been ad-dressed. Moreover, the relationships between insulin con-centration, blood pressure, lipid concentrations, and co-agulation factors in Chinese remain to be explored. A recent study in Mauritius found that both fasting and 2-h 1Department of Internal Medicine, National Taiwan University Hospital, 7
Chung Shan South Rd., Taipei, Taiwan 10016.
Institutes of2Environmental Health and3Epidemiology, National Taiwan
University College of Public Health, Taipei, Taiwan 100.
*Author for correspondence. Fax 886-2-2395-9911; e-mail ytlee@ ha.mc.ntu.edu.tw.
Received September 16, 1998; accepted March 18, 1999.
4Nonstandard abbreviations: CHD, coronary heart disease; CCCC, the
Chin-Shan Community Cardiovascular Cohort; BMI, body mass index; WHR, waist-to-hip ratio; LDL-C, LDL-cholesterol; HDL-C, HDL-cholesterol; apo A1, apoprotein A1; apo B, apoprotein B; Lp(a), lipoprotein(a); tPA, tissue plasmin-ogen activator; PAI-1, plasminplasmin-ogen activator inhibitor; and HOMA, homeosta-sis model assessment.
postload insulin concentrations in Chinese subjects were lower than that in Hindu and Muslim Indian subjects (13). Community-based studies use many indicators of in-sulin resistance syndrome. Observations based on quar-tiles or terquar-tiles of fasting insulin concentrations (2, 3, 14 –
25 ), insulin resistance indexed by calculation of fasting
and postloading glucose and insulin concentrations
(18, 26 ), or insulin sensitivity index profiles (18, 26 ) have
revealed underlying pathophysiological mechanisms and have wide applications in population studies. Associa-tions between these indicators of insulin resistance and atherosclerotic risk factors can be viewed as different aspects of insulin resistance syndrome. The Chin-Shan Community Cardiovascular Cohort (CCCC) study is a prospective community-based investigation of cardiovas-cular disease risk factors in Chinese adults in Taiwan. Here, we focus on the distribution of fasting insulin concentrations and the linkage between insulin concen-tration and various atherosclerotic risk factors.
Materials and Methods study design and population
The CCCC cohort consisted of 3602 inhabitants at least 35 years of age when recruited in 1990 –1991 from Chin-Shan, a suburban community 36 kilometers from metro-politan Taipei. With the approval of the institutional committee, documents at the community household reg-istration office were reviewed to validate the basic demo-graphic data, including the genders, birth dates, and addresses of residents in the community. The baseline response rate was 82.8% of all 4350 identified eligible individuals. A follow-up program was conducted every other year. This report used data on the coagulation profiles collected in 1992–1993 and data on atherosclerotic risk factors and insulin profiles collected in 1994 –1995. The leading causes of deaths, mainly from cardiovascular disease and cancer in this community, reflect the national mortality patterns in Taiwan between 1990 and 1994 (27 ).
data collection and clinic exams
A clinic was set up at the Chin-Shan Community Health Center by the study team, which consisted of 20 senior medical students, 2 assistant nurses, and 10 cardiologists and local practitioners. Trained medical students can-vassed door-to-door with the assistance of community leaders to extend invitations for the baseline survey. Information collected included sociodemographic charac-teristics, lifestyle, personal and family histories of dis-eases, and the history of hospitalization. With the consent of participants, a team of physicians and medical students conducted physical examinations and laboratory tests on those participants invited to the clinic. Blood pressures were measured with subjects in the sitting position after resting for 10 min. Body weight was measured using a calibrated balance. Body mass index (BMI) was calculated as weight (kilograms) divided by height (meters) squared. The circumferences of the smallest part of waist and the
thickest part of the hip in the standing position were measured, and the waist-to-hip ratio (WHR) was calcu-lated. Electrocardiograms (12-lead) were recorded concur-rently. Specimens for blood analysis were also collected in the morning, before 1200.
blood sampling and analytic methods
All subjects with a minimum fasting period of 12 h underwent an oral glucose tolerance test with 75 g of glucose loading in accordance with the World Health Organization standard. Tests were performed in the morning, before 1000. Immediately before the glucose loading, serum samples for determinations of blood lip-ids, plasma glucose, and serum insulin were obtained. A second serum sample was taken 2 h later. The serum samples were refrigerated immediately and transported to the National Taiwan University Hospital within 6 h. Serum samples were then stored at 270 °C for batch assays of total cholesterol, triglycerides, LDL-cholesterol (LDL-C), HDL-cholesterol (HDL-C), apoprotein A1 (apo A1), apoprotein B (apo B), and lipoprotein(a) [Lp(a)], as described previously (28 ). Standard enzymatic methods were used to determine serum cholesterol and triglycer-ides (methods 14354 and 14366, respectively; Merck). HDL-C was measured in the supernatant after precipita-tion with magnesium chloride-phosphotungstate reagents (method 14993; Merck). The LDL-C content was measured as “total cholesterol minus cholesterol in the supernatant” by the precipitation method (29 ) because the HDL-C was precipitated by the use of heparin/citrate reagent (meth-od 14992; Merck). apo A1 and apo B concentrations were measured by turbidimetric immunoassay using commer-cial kits (Sigma). Lp(a) was determined by enzyme-linked immunosorbent assay (Organon) regardless of isoform.
Blood samples for glucose analysis were drawn into glass test tubes, each containing 80 mol/L fluoride/ oxalate reagent. After centrifugation at 1500g for 10 min at 4 °C, glucose concentrations were measured on superna-tants by enzymatic assay (commercial kit 3389; Merck) in a Eppendorf 5060 automated analyzer. The plasma insulin concentration was determined using the ELISA method in which a reagent kit supplied by the Dako was used. The plate antibody bindsa chains somewhere near the intra-chain disulfide. The conjugate antibody binds very close to the cleavage site in proinsulin, and its epitope is partially composed of a lysine residue at position 30 on the b chain. Thus, the assay will not measure intact proinsulin and provides specificity for insulin (30 ). The lower limit of detection for insulin was 0.158 pmol/L, with a CV of 5.0%.
The measurements of coagulation profiles were made in the following manner: Tissue plasminogen activator (tPA) was analyzed using an enzyme immunoassay (As-serachrom tPA; Diagnostica Stago), and plasminogen activator inhibitor (PAI-1) and fibrinogen were measured using commercial kits. PAI-1 was measured using an enzyme immunoassay (Asserachrom PAI-1; Diagnostica
Stago), whereas fibrinogen was measured using a clotting assay (STA-Fibrinogen; Diagnostica Stago).
diagnostic criteria
Subjects were defined as hypertensive according to the Fifth Joint National Committee criteria (31 ): a systolic blood pressure of 140 mmHg and higher and/or diastolic blood pressure of 90 mmHg and higher, or receiving regular antihypertensive therapy. The presence of CHD was defined on the basis of a finding of abnormal Q or QS patterns on an electrocardiogram or a clinical history of myocardial infarction or angina pectoris with admission documents. A history of stroke was defined on the basis of a history of hemiparesis or hemiplegia, and was con-firmed by one neurologist. Subjects were defined as having diabetes mellitus if their fasting plasma glucose concentrations were.7.77 mmol/L or they were receiv-ing oral hypoglycemic agents or insulin injections. A BMI .27 kg/m2and a WHR.0.94 were considered abnormal because these were 90th percentile values for the study
population. The quartiles for fasting insulin, specified by sex in the study population, were established with the following cutoffs: #16.50 pmol/L, 16.50–29.99 pmol/L, 29.99 –52.45 pmol/L, and $52.45 pmol/L for men; and #27.27 pmol/L, 27.27–42.33 pmol/L, 42.33–67.84 pmol/L, and$ 67.84 pmol/L for women. The top quartile concentration was defined as hyperinsulinemia. Ho-meostasis model assessment (HOMA) was used to iden-tify insulin resistance syndrome, using the formula: [fast-ing insulin (mIU/L) 3 fasting glucose (mg/dL) 3 0.05551]/22.5 (26 ).
statistical analysis
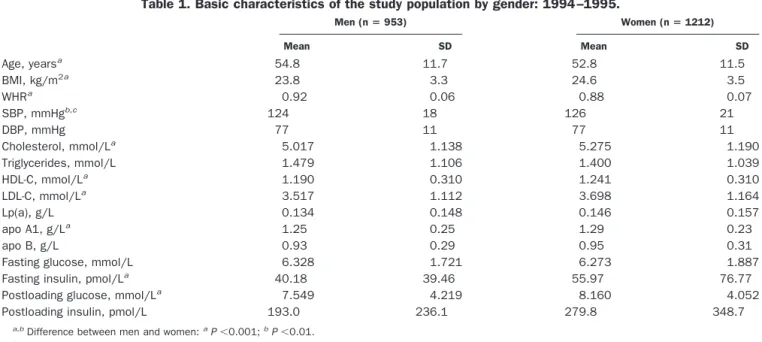
We first compared the distribution of fasting serum insulin by age and sex. The distribution of the insulin concentration appeared highly skewed to the right and justified the use of geometric means. Sex- and age-specific quartiles for fasting insulin were defined. The interaction between fasting insulin and the atherosclerotic risk factor was examined for each hyperinsulinemia quartile. All Table 1. Basic characteristics of the study population by gender: 1994 –1995.
Men (n5 953) Women (n5 1212) Mean SD Mean SD Age, yearsa 54.8 11.7 52.8 11.5 BMI, kg/m2a 23.8 3.3 24.6 3.5 WHRa 0.92 0.06 0.88 0.07 SBP, mmHgb,c 124 18 126 21 DBP, mmHg 77 11 77 11 Cholesterol, mmol/La 5.017 1.138 5.275 1.190 Triglycerides, mmol/L 1.479 1.106 1.400 1.039 HDL-C, mmol/La 1.190 0.310 1.241 0.310 LDL-C, mmol/La 3.517 1.112 3.698 1.164 Lp(a), g/L 0.134 0.148 0.146 0.157 apo A1, g/La 1.25 0.25 1.29 0.23 apo B, g/L 0.93 0.29 0.95 0.31
Fasting glucose, mmol/L 6.328 1.721 6.273 1.887
Fasting insulin, pmol/La 40.18 39.46 55.97 76.77
Postloading glucose, mmol/La 7.549 4.219 8.160 4.052
Postloading insulin, pmol/L 193.0 236.1 279.8 348.7
a,bDifference between men and women:aP,0.001;bP,0.01. cSBP, systolic blood pressure; DBP, diastolic blood pressure.
Table 2. Geometric means and 95% confidence intervals for variables with right-skewed distributions for the study population: 1994 –1995. Men (n5 953) Women (n5 1212) Triglycerides, mmol/L 1.219 (0.384–3.827) 1.174 (0.384–3.624) Lp(a), g/L 0.071 (0.005–0.942) 0.079 (0.006–0.973) PAI-1,mg/La 16.0 (2.5–103.5) 17.9 (2.6–121.8) tPA,mg/L 8.0 (2.6–24.3) 7.7 (2.8–21.7) Fibrinogen,mmol/L 8.588 (5.558–13.235) 8.735 (6.117–12.440)
Fasting insulin, pmol/Lb 27.27 (3.59–190.86) 40.90 (8.61–196.60)
Postloading insulin, pmol/Lb 109.1 (10.8–1126.5) 182.2 (28.0–1171.7)
Insulin resistance by HOMAb 7.319 (0.933–59.481) 11.121 (2.009–62.207)
subjects were divided according to the sex-specific quar-tiles for insulin. Because of the skewed distribution of the insulin index indicators in each gender, a Spearman rank correlation analysis was performed to measure the linear relationship between covariates and three indicators of insulin resistance syndrome. A multiple logistic regres-sion model was constructed to estimate the odds ratios and 95% confidence intervals of covariates to predict the occurrence of hyperinsulinemia. When the glucose and insulin concentrations for fasting subjects were plotted, the localized regression method of Cleveland and Delvin
(32 ) was adapted using S-plus 3.3 (33 ). Data analysis was
performed using the SAS release 6.11 software (34 ).
Results
Excluding 186 deaths and 63 cases of follow-up attrition, there were 2165 individuals (64.6%; 953 men and 1212 women) who had less missing data from both 1992–1993 and 1994 –1995 follow-up visits. Table 1 shows the basic characteristics of population by gender. As a group, the men were older and had higher triglyceride concentra-tions and WHR values, but lower BMI values, than women. Compared with men, women exhibited higher mean systolic blood pressure, serum cholesterol, HDL-C, LDL-C, Lp(a), and apo A1 and B. Under fasting condi-tions, mean glucose concentrations were similar for both sexes. After glucose loading, the mean glucose concentra-tion was higher in women than in men. Women also had higher mean insulin concentrations during fasting and 2-h postloading conditions.
The geometric means and 95% confidence intervals for variables with right-skewed distributions, displayed by sex, are listed in Table 2. In coagulation profiles, women had higher fibrinogen and PAI-1 concentrations, whereas men had higher tPA concentrations. In the comparisons of indicators of insulin resistance syndrome, women had higher fasting and postloading insulin concentrations, and higher insulin resistance by HOMA.
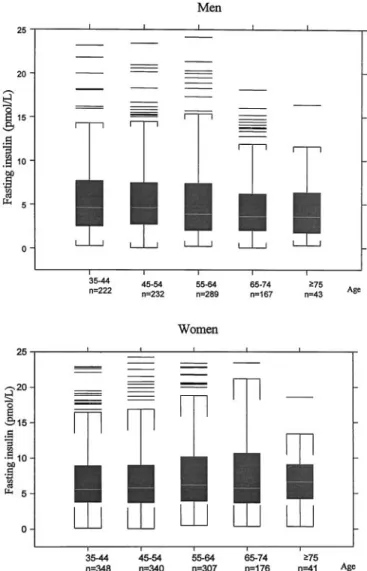
The distribution of fasting serum insulin was highly skewed to the right and was 0.14 –279.83 pmol/L in men and 0.36 – 866.24 pmol/L in women; women had higher concentrations than men (Fig. 1). In men, serum fasting
insulin decreased as age increased, whereas for women, serum fasting insulin increased as age increased (Fig. 2). The the relationship between serum insulin and fasting glucose is presented using scatter plots in Fig. 3. In the fasting state, insulin concentrations increased progres-sively as glucose concentrations increased in both gen-ders, and then plateaued for women, but increased slightly for men.
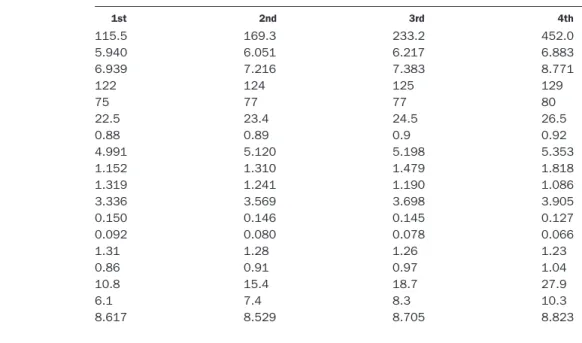
The mean values of clinical and metabolic variables, according to quartile concentrations of fasting insulin for the study population, are shown in Table 3. As fasting insulin concentrations increased, fasting glucose, post-loading glucose, insulin, systolic and diastolic blood pres-sure, BMI, WHR, cholesterol, triglycerides, LDL-C, and apo B increased significantly (P,0.001). The coagulation factors, including fibrinogen, PAI-1, and tPA, also in-creased significantly (P,0.001) as fasting insulin concen-trations increased. Serum Lp(a), HDL-C, and apo A1 decreased significantly as fasting insulin increased.
Fig. 1. Histograms of the fasting insulin concentrations in Chinese men and women, the CCCC Study, 1994 –1995.
Fig. 2. Box plots of fasting serum insulin in the studied population by gender and age: 1994 –1995.
Fasting insulin concentrations were significantly posi-tively correlated with insulin resistance by HOMA method (g 5 0.97; P ,0.0001). The relationships between these two indicators of insulin resistance syndrome and various atherosclerotic profiles, according to Spearman correlation coefficients, are shown in Table 4. The corre-lation coefficients were consistent within the two groups for fasting insulin concentrations and insulin resistance
index by HOMA. When fasting insulin concentrations were considered, significant positive correlations were found for BMI, WHR, blood pressures, cholesterol, tri-glycerides, LDL-C, apo B, PAI-1, and tPA in both sexes, and significant negative correlations were found for HDL-C and apo A1 in both sexes. Fasting insulin concen-trations also exhibited a significant negative association with age and Lp(a) concentration for men, but not for
Fig. 3. Scatter plot relationship between fasting serum insulin and fasting plasma glucose in the CCCC Study, 1994 –1995.
women. Fibrinogen concentration was not associated with fasting insulin concentrations for both sexes.
The abilities of the odds ratios and 95% confidence intervals of various covariates to predict the occurrence of
hyperinsulinemia are shown in Table 5. We found that obesity, high LDL-C, and low HDL-C were independent factors. Sex and hypertension were not significant covari-ates for hyperinsulinemia. As age increased, the odds Table 3. Mean values of clinical and metabolic variables, according to quartile of fasting insulin concentration in the study
population: 1994 –1995.
Quartile of fasting insulin concentration
1st 2nd 3rd 4th
Postloading insulin, pmol/La 115.5 169.3 233.2 452.0
Fasting glucose, mmol/La 5.940 6.051 6.217 6.883
Postloading glucose, mmol/La 6.939 7.216 7.383 8.771
SBP, mmHga,b 122 124 125 129 DBP, mmHga 75 77 77 80 BMI, kg/m2a 22.5 23.4 24.5 26.5 WHR 0.88 0.89 0.9 0.92 Cholesterol, mmol/La 4.991 5.120 5.198 5.353 Triglycerides, mmol/La 1.152 1.310 1.479 1.818 HDL-C, mmol/La 1.319 1.241 1.190 1.086 LDL-C, mmol/La 3.336 3.569 3.698 3.905 Lp(a), g/L 0.150 0.146 0.145 0.127 Lp(a), g/La,c 0.092 0.080 0.078 0.066 apo A1, g/La 1.31 1.28 1.26 1.23 apo B, g/La 0.86 0.91 0.97 1.04 PAI-1,mg/La,c 10.8 15.4 18.7 27.9 tPA,mg/La,c 6.1 7.4 8.3 10.3 Fibrinogen,mmol/Lc,d 8.617 8.529 8.705 8.823 aP,0.001, ANOVA F-test.
bSBP, systolic blood pressure; DBP, diastolic blood pressure. cGeometric mean.
dP,0.05, ANOVA F-test.
Table 4. Spearman correlation between atherosclerotic risk factors and fasting insulin concentration and insulin resistance by HOMA in the studied population by gender: 1994 –1995.
Correlation coefficient
Men (n5 953) Women (n5 1212)
Fasting insulin IR (HOMA)a Fasting insulin IR (HOMA)
Age 20.11b 20.12b 0.04 0.07c BMI 0.49b 0.49b 0.42b 0.41b WHR 0.26b 0.27b 0.21b 0.23b SBP 0.09d 0.11b 0.19b 0.22b DBP 0.17b 0.18b 0.19b 0.21b Cholesterol 0.08c 0.08c 0.13b 0.14b Triglycerides 0.25b 0.27b 0.30b 0.35b HDL-C 20.33b 20.33b 20.27b 20.32b LDL-C 0.17b 0.17b 0.20b 0.21b Lp(a) 20.14b 20.15b 20.04 20.04 apo A1 20.18b 20.16b 20.08d 20.09d apo B 0.23b 0.24b 0.27b 0.30b PAI-1 0.34b 0.37b 0.42b 0.45b tPA 0.35b 0.37b 0.39b 0.42b Fibrinogen 0.04 0.05 0.06 0.07c
aIR, insulin resistance. bP,0.001.
cP,0.05. dP,0.01.
ratios for the occurrence of hyperinsulinemia decreased, although not significantly.
Discussion
Insulin resistance can be measured quantitatively using the glucose clamp technique, which is laborious and not applicable to clinical practice and population studies (35 ). Numerous studies have used the top quartiles or tertiles of fasting or postloading insulin concentrations as indica-tors of insulin resistance syndrome (9, 14, 35–37 ). Other studies have adjusted from the physiological viewpoint to using several indicators based on fasting and postloading glucose concentrations, such as HOMA, to monitor insu-lin resistance syndrome (18, 26 ). In this study, fasting insulin was used as an indicator of insulin resistance syndrome, and hyperinsulinemic was defined as the gender-specific top quartile of insulin concentrations. We found that the fasting insulin concentration was signifi-cantly associated with HOMA and postloading insulin concentrations and was an appropriate indicator for insu-lin resistance syndrome. HOMA and postloading insuinsu-lin concentrations were higher in women than in men and were also related to various atherosclerotic risk factors in the study population.
The fasting and postloading insulin measurements for the 2165 native Taiwanese men and women from the community-based CCCC study provided a unique oppor-tunity to observe how atherosclerotic risk factors are associated with insulin resistance syndrome in the Chi-nese population. The fasting insulin concentrations in this population had a right-skewed distribution, a pattern similar to that found for other ethnic groups (3, 9 ). The median concentrations and intervals for fasting insulin for this study population seemed similar to those for
Cauca-sians, higher on average than those for the Japanese (9 ), but lower than those values for African Americans
(9, 13, 18, 26 ). Although fasting insulin concentrations
were likely lower in females than in males for Caucasians, the concentrations were higher in females than in males for both the Japanese and the Chinese. However, triglyc-erides were fairly high for women in our study, compared with Caucasian women. The relationship was similar for the men in our study compared with Caucasian men. This study also demonstrated the different patterns in the age distribution of fasting insulin between genders: the con-centration decreased as age increased in men, but in-creased gradually in women, peaking for the ages 65–74 years. This was a sex- and age-interactive phenomenon not reported previously.
The patterns of the relationships between fasting insu-lin and fasting glucose were similar for both genders. In men, there was a persistent positive relationship between glucose and insulin, whereas in women, a small hump was noted for insulin when the fasting glucose was;8.22 mmol/L, and then the concentration for insulin became flat. The hump of the curve in women may indicate when pancreaticb-cell decompensation occurs (13, 38).
Hypertension shares an important role in insulin resis-tance syndrome (1, 2, 23 ). In this study, hyperinsulinemia was associated with higher systolic and diastolic blood pressure in both genders, similar to patterns for Chinese, Japanese, and Caucasians in other studies (9, 8, 39 ). In the study by Saad et al. (8 ), insulin concentrations and resistance were related to blood pressure in Caucasians, but not in Pima Indians or African Americans.
Obesity is strongly related to insulin resistance. In particular, individuals with a preponderance of abdomi-nal fat deposition tend to be more insulin-resistant and Table 5. Multiple logistic regression model to predict the occurrence hyperinsulinemia with various covariates in the study
population: 1994 –1995.a
Variable Odds ratio 95% Confidence interval P
Sex 0.89 0.70–1.12 0.305 Hypertension, yes/no 1.12 0.84–1.50 0.433 Diabetes, yes/no 1.98 1.43–2.76 0.0001 Age, years 45–54/35–44 0.95 0.69–1.29 0.723 55–64/35–44 0.99 0.73–1.35 0.942 65–74/35–44 0.91 0.63–1.31 0.601 $75/35–44 0.63 0.32–1.25 0.186 Obesity 5.51 4.28–7.09 0.0001 BMI$27/BMI ,27 Hypertriglyceridemia 1.29 0.93–1.77 0.127 TG$2.258/TG ,2.258 mmol/Lb High LDL-C 1.36 1.06–1.74 0.014 LDL-C$4.138/LDL-C ,4.138 mmol/L Low HDL-C 2.19 1.67–2.87 0.0001 HDL-C#0.905/HDL-C $0.905 mmol/L
aThe goodness-of-fit test of the final model by Hosmer and Lemeshow method(34 ) was 8.21 with df5 8, P 5 0.4129. bTG, triglyceride.
have several metabolic abnormalities that place them at risk for an abnormal blood lipid profile (40 ). Compared with adipocytes located in the gluteo-femoral regions, abdominal adipocytes are more sensitive to lipolytic hor-mones (41 ). In this study, BMI and WHR increased as the insulin quartile increased, which is consistent with previ-ous reports (19, 37, 42, 43 ).
The relationship between hyperinsulinemia and dys-lipidemia, especially in subjects with low HDL-C concen-trations and hypertriglyceridemia, is well-recognized in clinical practice and population studies (3, 17, 44, 45 ). In the present study, the concentrations of cholesterol, tri-glycerides, LDL-C, and apo B increased significantly as insulin concentrations increased for both genders. The concentrations of HDL-C and apo A1 decreased signifi-cantly as insulin concentrations increased. Different pat-terns between genders may exist in different countries. In a Western study, cholesterol concentrations were posi-tively correlated with insulin concentrations only in men
(46 ). It is noteworthy that in our study, Lp(a)
concentra-tions decreased as insulin increased, similar to findings in a Japanese study (9 ). However, the correlation was sig-nificant only for men, not for women (g 5 20.14 vs 20.04 in men and women, respectively). This suggests that different mechanisms of hyperinsulinemia and dyslipide-mia may exist between genders.
The association of coagulation factors and insulin re-sistance syndrome varied. Several studies have demon-strated increased plasma PAI-1 concentrations for pa-tients with hyperinsulinemia (26, 47, 48 ), suggesting that insulin resistance syndrome is susceptible to athero-thrombosis events. The fibrinogen concentration was also associated with hyperinsulinemia, but with a weaker correlation. The positive correlation between tPA and insulin in this study was different from that reported in the Northern Sweden MONICA study (36 ), which showed low tPA activity in hyperinsulinemic status. The diversity in population structure may be explained by racial differences. Other factors, such as dietary habits and physical activity, may be taken into consideration to explain the differences in the association.
Lifestyle influences of insulin resistance, including dietary intake and physical activity, are important to the pathogenesis of insulin resistance syndrome (22, 40 ). In this community-based study, inquiries concerning dietary habit and physical activity will be undertaken later. Controlling obesity and increased exercise are effective means of preventing diabetes and CHD. Further interven-tion treatments on the populainterven-tions at risk for CHD are advised.
In conclusion, the present study demonstrated that vari-ous atherosclerotic and coagulation risk factors were strongly associated with fasting insulin concentrations. Insulin resistance syndrome may put these participants at risk for CHD.
This project was supported by the Department of Health (Grant DOH-83-TD-95) and the National Science Council (Grant NSC86-2314-B002-184-M40), Executive Yuan, Tai-wan. We thank Yu-Jenn Huang and Ching-Chu Chien for technical assistance, and also thank our colleagues and the students and community volunteers who assisted with this study.
References
1. Ferrannini E, Buzzigoli G, Bonadonna R. Insulin resistance in essential hypertension. N Engl J Med 1987;317:350 –7. 2. Modan M, Halkin M, Almog S, Lusky A, Eshkol A, Shefi M, et al.
Hyperinsulinemia: a link between hypertension, obesity and glu-cose intolerance. J Clin Investig 1985;75:809 –17.
3. Manolio TA, Savage PJ, Burke GL. Association of fasting insulin and blood pressure and lipids in young adults: the CARDIA study. Arteriosclerosis 1990;10:430 – 6.
4. Reaven GM. Role of insulin resistance in human disease: Banting Lecture 1988. Diabetes 1988;37:1595– 607.
5. Kaplan NM. The deadly quartet: upper-body adiposity, glucose intolerance, hypertriglyceridemia and hypertension. Arch Intern Med 1989;149:1514 –20.
6. Garica MJ, McNamara PM, Gordon T. Morbidity and mortality in diabetics in the Framingham population sixteen year follow-up study. Diabetes 1974;23:105–11.
7. Palumbo PJ, Elveback KR, Chu C. Diabetes mellitus: incidence, prevalence, survivorship and causes of death in Rochester, Min-nesota, 1954 –1970. Diabetes 1976;25:566 –73.
8. Saad MF, Lillioja S, Nyomba BL, Castillo C, Ferraro R, DeGregorio C, et al. Racial differences in the relation between blood pressure and insulin resistance. N Engl J Med 1991;324:733–9. 9. Kario K, Nago N, Kayaba K, Saegus T, Matuso H, Goto T, et al.
Jichi Medical School Cohort Study Group. Characteristics of the insulin resistance syndrome in a Japanese population. The Jichi Medical School Cohort study. Arterioscler Thromb Vasc Biol 1996; 16:269 –74.
10. Knowler WC, Bennett PH, Hamman RF, Miller M. Diabetes inci-dence and prevalence in Pima Indians: a 10-fold greater inciinci-dence than in Rochester, Minnesota. Am J Epidemiol 1978;108:497– 505.
11. McKeigue PM, Miller GJ, Marmot MG. Coronary heart disease in south Asia overseas: a review. J Clin Epidemiol 1989;42:597– 609.
12. Wise PH, Edwards FM, Craig RJ, Evans B, Marchland JB, Suther-land B, et al. Diabetes and associated variables in the South Australian aboriginal. Aust NZ J Med 1976;6:191– 6.
13. Dowse GK, Zimmet PZ, Alberti KG, Brigham L, Carlin JB, Tuom-ilehto J, et al. Serum insulin distributions and reproducibility of the relationship between 2-hour insulin and plasma glucose levels in Asian Indian, Creole, and Chinese Mauritius. Mauritius NCD Study Group. Metabolism 1993;42:1232– 41.
14. Pyorala K, Savolaine E, Kaukola S, Haapakoski J. Plasma insulin as coronary heart disease risk factor: relationship to other risk factors and predictive values during 91⁄2-year follow-up of the
Helsinki Policemen Study population. Acta Med Scand 1985;701: 38 –52.
15. Welborn TA, Wearne K. Coronary heart disease incidence and cardiovascular mortality in Busselton with reference to glucose and insulin concentrations. Diabetes Care 1979;2:154 – 60. 16. Fontonne A, Charles MA, Thibult N. Hyperinsulinemia as a
predic-tor of coronary heart disease mortality in a healthy population: the Paris Prospective Study, 15-year follow-up. Diabetologia 1991;34: 356 – 61.
Association of fasting insulin level with serum lipid and lipoprotein levels in children, adolescents, and young adults: the Bogalusa Heart study. Arch Intern Med 1995;155:190 – 6.
18. Lindahl B, Asplund K, Hallmas G. High serum insulin, insulin resistance and their associations with cardiovascular risk factors: the Northern Sweden MONICA population study. J Intern Med 1993;234:263–70.
19. Soler JT, Folsom AR, Kaye SA, Prineas RJ. Associations of abdominal adiposity, fasting insulin, sex hormones binding glob-ulin, and estrogen with lipids and lipoproteins in postmenopausal women. Atherosclerosis 1989;79:21–7.
20. Pyorala K. Relationship of glucose tolerance and plasma insulin to the incidence of coronary heart disease: results from two popula-tion studies in Finland. Diabetes Care 1979;2:131– 41. 21. Sowers JR, Standley PR, Ram JL, Jacober S, Simpson L, Rose K.
Hyperinsulinemia, insulin resistance, and hyperglycemia: contrib-uting factors in the pathogenesis of hypertension and atheroscle-rosis. Am J Hypertens 1993;6:260S–70S.
22. Standl E. Hyperinsulinemia and atherosclerosis. Clin Investig Med 1995;18:261– 6.
23. Bonner G. Hyperinsulinemia, insulin resistance, and hyperten-sion. J Cardiovasc Pharmacol 1994;24:S39 – 49.
24. Sowers JR, Sowers PS, Peuler JD. Role of insulin resistance and hyperinsulinemia in development of hypertension and atheroscle-rosis. J Lab Clin Med 1994;123:647–52.
25. Arrants J. Hyperinsulinemia and cardiovascular risk. Heart Lung 1994;23:118 –22.
26. Matthws DR, Hosker JP, Rudenski AS, Naylor BA, Treacher DF, Turner RC. Homeostasis model assessment: insulin resistance and b-cell function from fasting plasma glucose and insulin concentrations in man. Diabetologia 1985;28:412–9.
27. Taiwan. Reports of Department of Health. DOHEY, ROC, Taipei, Taiwan: Department of Health, 1995:134 –7.
28. Chung MY, Jeng JS, Yip PK. Study on blood lipids, lipoproteins, and apolipoproteins in different types of ischemic stroke. Acta Neurol Sin 1994;3:194 –9.
29. Wieland H, Seidel D. A simple specific method for precipitation of low density lipoproteins. J Lipid Res 1983;24:904 –9.
30. Walford S. Insulin measurement. Pract Diabet 1989;6:56 – 8. 31. Joint National Committee. The fifth report of the Joint National
Committee on detection, evaluation and treatment of high blood pressure (JNC V). Arch Intern Med 1993;153:154 – 83.
32. Cleveland WS, Delvin SJ. Locally-weighted regression: an ap-proach to regression analysis by local fitting. J Am Stat Assoc 1988;83:596 – 610.
33. S-PLUS guide to statistical and mathematical analysis, Ver. 3.3. Seattle, WA: StatSci, a division of MathSoft, 1995:812 pp. 34. SAS/STAT. Software: changes and enhancements through
re-lease 6.11. Cary, NC: SAS Institute, 1996:1104 pp.
35. Laakso M. How good a marker is insulin level for insulin resis-tance? Am J Epidemiol 1993;137:959 – 65.
36. Elisson M, Asplund K, Evrin PR, Lindahl B, Lundblad D. Hyperin-sulinemia predicts low tissue plasminogen activator activity in a healthy population: the Northern Sweden MONICA study. Metab-olism 1994;43:1579 – 86.
37. Nabulsi AA, Folsom AR, Heiss G, Weir BS, Chambless LE, Watson RL, et al. Fasting hyperinsulinemia and cardiovascular disease risk factors in nondiabetic adults: stronger associations in lean versus obese subjects. Metabolism 1995;44:914 –22.
38. Welborn TA, Stenhouse NS, Johnstone CG. Factors determining serum insulin response in a population sample. Diabetologia 1969;5:263– 6.
39. Woo J, Cockram CS, Lau E, Chan A. Association between insulin and blood pressure in a community population with normal glucose tolerance. J Hum Hypertens 1992;6:343–7.
40. Flack JM, Sowers JR. Epidemiological and clinical aspects of insulin resistance and hyperinsulinemia. Am J Med 1991;91: 11S–20S.
41. Jensen M, Haymond M, Rizza R, Miles J. Influence of body fat distribution on free fatty acid metabolism in obesity. J Clin Investig 1989;83:1168 –73.
42. Ostlund RE, Staten M, Hohrt WM, Schultz J, Malley M. The ratio of waist-to-hip circumference, plasma insulin level, and glucose intolerance as independent predictors of the HDL2 cholesterol level in older adults. N Engl J Med 1990;322:229 –34.
43. O’Dea K, Hopper J, Patel M, Traianedes K, Kubisch D. Obesity, diabetes, and hyperlipidemia in a central Australian aboriginal community with a long history of acculturation. Diabetes Care 1993;16:1004 –10.
44. Laws A, King AC, Haskell WL, Reaven GM. Relation of fasting plasma insulin concentration to high density lipoprotein choles-terol and triglyceride concentrations in men. Arterioscler Thromb 1991;11:1636 – 42.
45. Mykkanen L, Kuusisto J, Haffner SM, Pyorala K, Laakso M. Hyperinsulinemia predicts multiple atherogenic changes in li-poproteins in elderly subjects. Arterioscler Thromb 1994;14:518 – 26.
46. Winocour PH, Kaluvya S, Ramaiya K, Brown L, Millar JP, Farrer M, et al. Relation between insulinemia, body mass index, and lipoprotein composition in healthy, nondiabetic men and women. Arterioscler Thromb 1992;12:393– 402.
47. Juhan-Vague I, Alessi MC, Vague P. Increased plasma plasmino-gen activator inhibitor 1 levels. A possible link between insulin resistance and atherothrombosis. Diabetologia 1991;34:457– 62.
48. Potter van Loon BJ, Kluft C, Radder JK, Blankenstein MA, Meinders AE. The cardiovascular risk factor plasminogen activator inhibitor type 1 is related to insulin resistance. Metabolism 1993;42:945–9.