Factor Construct of Health-related Quality of Life in Taiwanese Workers by WHOQOL-BREF Questionnaire
10
0
0
全文
(2) 114. Factor Constructs on Health-related Quality of Life. questionnaire to measure health-related quality of life (HRQL) based on this definition. The brief version of the World Health Organization's Quality of Life questionnaire (WHOQOL-BREF), a generic HRQL measure, contains two items from the overall HRQL and general health facet and one item from each of the remaining 24 facets. These facets are categorized into four major domains: Physical Capacity (7 items), Psychological Well-being (6 items), Social Relationships (3 items), and Environment (8 items) [3-5]. Employers have been showing an increasing concern about the effect of workers' quality of life on productivity [8]. However, most studies have focused on quality of work life (QWL), not HRQL. Igbaria and Siegel [9] defined quality of work life as a perception of status for a person's experiences during his job's environment when he is in his unit of workplace. Many companies have found that QWL correlated significantly with work performance [10]. Different factor constructs have been proposed for the QWL questionnaires [11,12]. Quality of work life usually includes three domains: personal, job and organization. The personal domain includes self-development, self-esteem, conflict between job and family, and sense of security in life. The job domain includes job autonomy, salary, job variety, job environment. The organization domain includes personal relationships, promotion, parity at work, and participation in decision making. Researchers have proposed numerous models which comprise various combinations of the above factor constructs [1315]. For example, Efraty and Sirgy [13] proposed a multi-factor model, including self-development, self-esteem, sense of security in life, job autonomy, salary and interpersonal relationships. There is an increasing need to emphasize health-related quality of life in the workplace. Organizations have long shown that both QWL and workers' health considerably influence work performance and, in tern, productivity [11-15]. As such, there has been a lot of attention paid in recent years to occupational health programs, including ergonomic design of the workplace,. health promotion and safety [16]. With the increasing awareness of health and HRQL in the workplace there is a growing need for a generic measure of HRQL among workers. Hence, the application of a generic measure of HRQL in healthy workers needs to be used with care and to be properly validated. The objective of this study was to assess the factor constructs of HRQL in Taiwanese workers and to compare the factor constructs with the theoretical constructs of WHOQOL. The factory constructs were analyzed by exploratory factor analysis (EFA) and confirmatory factor analysis (CFA). SUBJECTS AND METHODS. Subjects. Our study population comprised workers registered in the databank of Taiwan's Labor Insurance Bureau in 1999. The study population totaled 7,597,386 persons. The study period was from April to July in 1999. We randomly selected 1884 workers based on proportional probability. Of the 1884 workers, 1726 (91.6%) were interviewed. A total of 1461 (age range, 16 to 69 yr; mean age, 38.5) were included in this study. We compared our sample with the general worker population to determine the distribution by sex. The ratio of males to females in the selected sample was 54% males to 46% females, whereas the ratio in the general worker population is 51% males to 49% females. The differences in ratio between the two populations were within 3% bias. Overall, subjects' demographic proportions such as sex and age were very similar to those in the general worker population. Instrument. A structured questionnaire was used to assess the workers' demographic data and the WHOQOL-BREF questionnaire was used to measure the HRQL. The WHOQOL is a multidimensional, multi-lingual profile that has been designed for cross-cultural subjective assessment [5]. The main outcome measures were HRQL scores from the WHOQOL-BREF questionnaire which includes 24 facets and 2 global WHOQOL items from the WHOQOL.
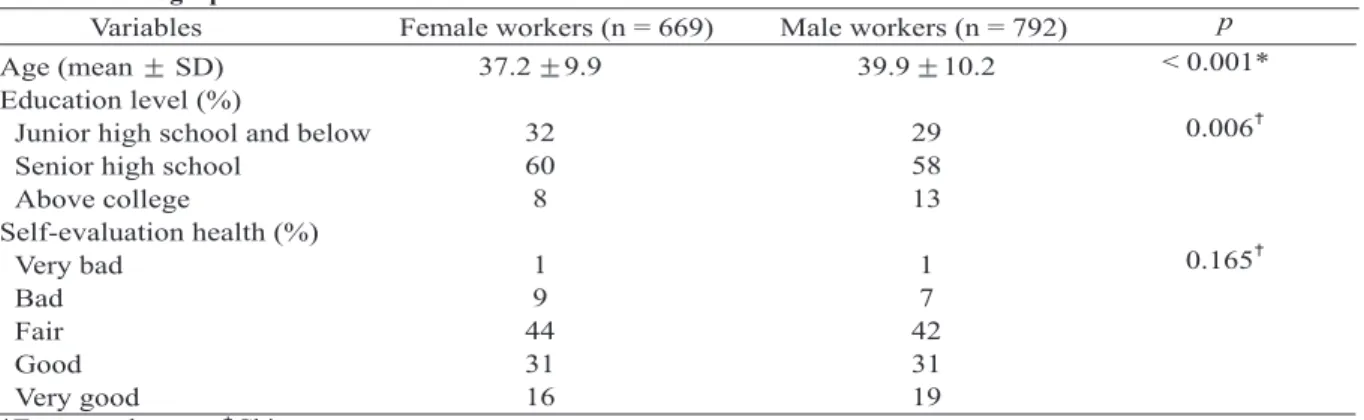
(3) Wen-Miin Liang, et al.. 115. Table 1. Demographic characteristics of Taiwanese workers Variables Female workers (n = 669). Age (mean SD) Education level (%) Junior high school and below Senior high school Above college Self-evaluation health (%) Very bad Bad Fair Good Very good *Two-sample t test. Chi-square test.. 37.2. 9.9. Male workers (n = 792) 39.9 10.2. p < 0.001*. 32 60 8. 29 58 13. 0.006. 1 9 44 31 16. 1 7 42 31 19. 0.165. conceptual constructs [5]. The 24 facets on the HRQL questionnaire were assigned conceptually to four domains: physical, psychological, social relationships and environment. The scores for some facets were reversed to allow for comparisons with other facets with a scale of 1 to 5 representing very bad (1), bad (2), neither bad nor good (3), good (4), very good (5). A higher score meant a higher HRQL in that facet. Procedure. Interviewers completed each interview within 30 to 40 minutes. Companies and factories were contacted to arrange time for the workers to be interviewed privately. Before the study, the questionnaire was pre-tested to check the wording, sequencing and ease of comprehension and was modified if needed. Five experts from the various fields (public health, statistics, environmental health, epidemiology and occupational hygiene) conducted a content validity test. Twenty subjects were interviewed with the WHOQOL-BREF questionnaire to test its reliability. The Cronbach's α coefficient ranged from 0.83 to 0.87 in the pre-test study. Statistical analysis. Mean scores for each facet were calculated for the male and female workers and tested by two-sample t test. An exploratory factor analysis with varimax rotation was performed. Eigenvalues greater than 1.0 criterion were used to estimate the proper number of factors to extract [17]. A four-domain solution for the original WHOQOL-BREF has been suggested [4], and. items relating to each domain load on that particular domain (Figure). Confirmatory factor analysis was applied to validate whether the four-domain structures could be fit to Taiwan's workers. The goodness of fit model was based on the following: the Non-Normal Fit Index (NNFI) and the Comparative Fit Index (CFI) with values above 0.90, as well as the Root Mean Square of Approximation (RMSEA) with values lower than 0.08 [18]. Model modifications were performed based on the following two indices: 1) the modification index which may suggest adding a path from domain to item and 2) the modification index which may suggest adding an error covariance between two items. The suggestion with the greatest decrease in chi-square value based on the above two indices was selected to modify the model until the criteria (RMSEA < 0.07, NNFI > 0.9 and CFI > 0.9) were satisfied [19]. Data were analyzed by SAS 8.12 software and LISREL 8 (Scientific Software International, Inc.) [20]. The CFA model was estimated using the maximum likelihood methods. RESULTS. Table 1 shows the demographic characteristics of female workers and male workers. The mean age was 37.2 years for female workers and 39.6 years for male workers (p < 0.001). Male workers had a higher level of education than female workers (p = 0.006). For the self-evaluation of health, 47% of female workers reported good or very good compared.
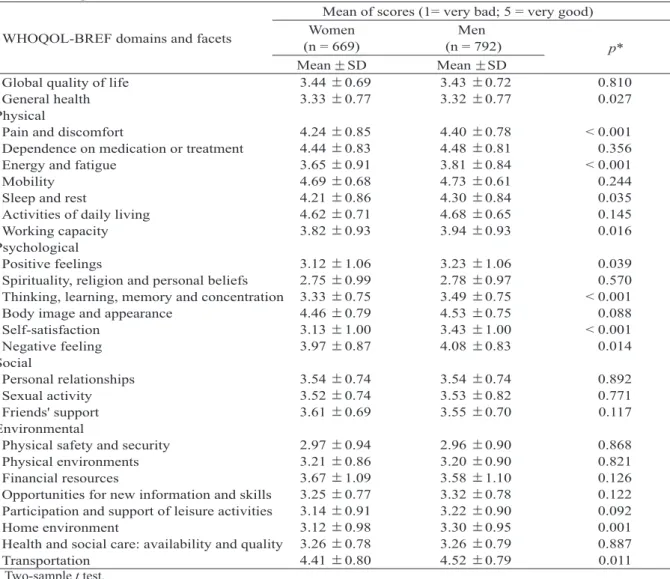
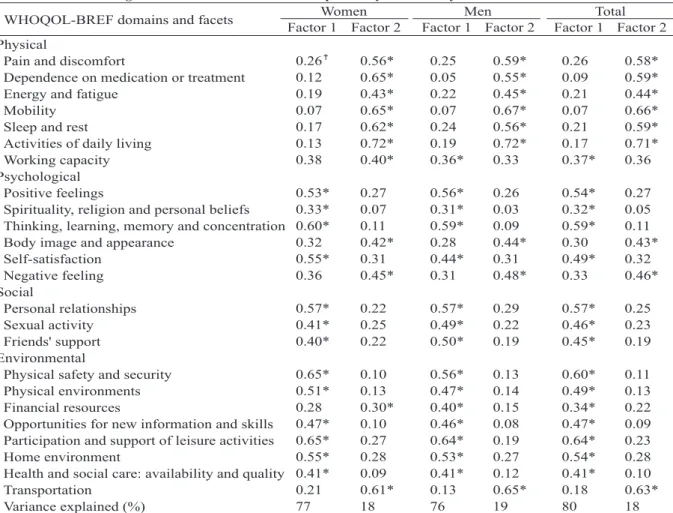
(4) 116. Factor Constructs on Health-related Quality of Life. Table 2. Average scores for each of the 26 items on the WHOQOL-BREF Mean of scores (1= very bad; 5 = very good) Women Men WHOQOL-BREF domains and facets (n = 669) (n = 792) p* Mean SD Mean SD 0.810 3.43 0.72 3.44 0.69 Global quality of life 0.027 3.32 0.77 3.33 0.77 General health Physical < 0.001 4.40 0.78 4.24 0.85 Pain and discomfort 0.356 4.48 0.81 4.44 0.83 Dependence on medication or treatment < 0.001 3.81 0.84 3.65 0.91 Energy and fatigue 0.244 4.73 0.61 4.69 0.68 Mobility 0.035 4.30 0.84 4.21 0.86 Sleep and rest 0.145 4.68 0.65 4.62 0.71 Activities of daily living 0.016 3.94 0.93 3.82 0.93 Working capacity Psychological 0.039 3.23 1.06 3.12 1.06 Positive feelings 0.570 2.78 0.97 2.75 0.99 Spirituality, religion and personal beliefs < 0.001 3.49 0.75 Thinking, learning, memory and concentration 3.33 0.75 0.088 4.53 0.75 4.46 0.79 Body image and appearance < 0.001 3.43 1.00 3.13 1.00 Self-satisfaction 0.014 4.08 0.83 3.97 0.87 Negative feeling Social 0.892 3.54 0.74 3.54 0.74 Personal relationships 0.771 3.53 0.82 3.52 0.74 Sexual activity 0.117 3.55 0.70 3.61 0.69 Friends' support Environmental 0.868 2.96 0.90 2.97 0.94 Physical safety and security 0.821 3.20 0.90 3.21 0.86 Physical environments 0.126 3.58 1.10 3.67 1.09 Financial resources 0.122 3.32 0.78 3.25 0.77 Opportunities for new information and skills 0.092 3.22 0.90 3.14 0.91 Participation and support of leisure activities 0.001 3.30 0.95 3.12 0.98 Home environment 0.887 3.26 0.79 Health and social care: availability and quality 3.26 0.78 0.011 4.52 0.79 4.41 0.80 Transportation * Two-sample t test.. with 50% of the male workers. Male workers had slightly better self-reported health status than female workers. Table 2 shows the average scores for each of the 26 items on the WHOQOL-BREF questionnaire for male workers and female workers. Overall, scores were higher for men than for women. Men had significantly higher scores than women for the following items: "general health", "pain and discomfort", "energy and fatigue", "sleep and rest", "working capacity", "positive feeling", "thinking and concentration", "self-satisfaction", "negative feeling", "home environment" and "transportation". Table 3 shows the results from the exploratory factor analysis. Where the row for the. facet "pain and discomfort" intersects with the column for Factor 1 for women, a structure loading of 0.26 appears which means that the correlation between facet "pain and discomfort" and Factor 1 for women is 0.26. It can be seen that only two factors were extracted for women, men and total participants. Factor 1 was composed mostly of items from the psychological, social and environmental domains, especially for the total group. Factor 1 explained 77% of the variance for women, 76% for men and 80% for the total, respectively. Factor 2 explained mostly items from the physical domain. Factor 2 explained 18%, 19%, and 18% of the variance for women, men and total. For the total workers, two factors (components) with eigenvalues greater.
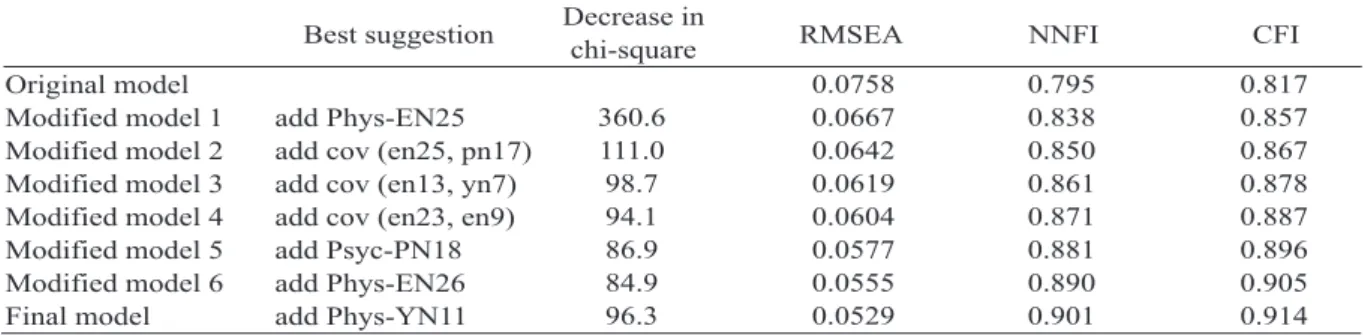
(5) Wen-Miin Liang, et al.. 117. Table 3. Factor loadings of the extracted factors from explanatory factor analysis Women Men Total WHOQOL-BREF domains and facets Factor 1 Factor 2 Factor 1 Factor 2 Factor 1 Factor 2 Physical 0.26 0.56* 0.25 0.59* 0.26 0.58* Pain and discomfort 0.12 0.65* 0.05 0.55* 0.09 0.59* Dependence on medication or treatment 0.19 0.43* 0.22 0.45* 0.21 0.44* Energy and fatigue 0.07 0.65* 0.07 0.67* 0.07 0.66* Mobility 0.17 0.62* 0.24 0.56* 0.21 0.59* Sleep and rest 0.13 0.72* 0.19 0.72* 0.17 0.71* Activities of daily living 0.38 0.40* 0.36* 0.33 0.37* 0.36 Working capacity Psychological 0.53* 0.27 0.56* 0.26 0.54* 0.27 Positive feelings 0.33* 0.07 0.31* 0.03 0.32* 0.05 Spirituality, religion and personal beliefs 0.11 0.59* 0.09 0.59* 0.11 Thinking, learning, memory and concentration 0.60* 0.32 0.42* 0.28 0.44* 0.30 0.43* Body image and appearance 0.55* 0.31 0.44* 0.31 0.49* 0.32 Self-satisfaction 0.36 0.45* 0.31 0.48* 0.33 0.46* Negative feeling Social 0.57* 0.22 0.57* 0.29 0.57* 0.25 Personal relationships 0.41* 0.25 0.49* 0.22 0.46* 0.23 Sexual activity 0.40* 0.22 0.50* 0.19 0.45* 0.19 Friends' support Environmental 0.65* 0.10 0.56* 0.13 0.60* 0.11 Physical safety and security 0.51* 0.13 0.47* 0.14 0.49* 0.13 Physical environments 0.28 0.30* 0.40* 0.15 0.34* 0.22 Financial resources 0.47* 0.10 0.46* 0.08 0.47* 0.09 Opportunities for new information and skills 0.65* 0.27 0.64* 0.19 0.64* 0.23 Participation and support of leisure activities 0.55* 0.28 0.53* 0.27 0.54* 0.28 Home environment 0.09 0.41* 0.12 0.41* 0.10 Health and social care: availability and quality 0.41* 0.21 0.61* 0.13 0.65* 0.18 0.63* Transportation 77 18 76 19 80 18 Variance explained (%) Factor loadings correspond to the extracted factor. Values (Factor loadings) were from the matrix of factor structure (correlation). *For each item, the high one of the two loadings was considered to be the "high factor loading".. than 1.0 accounted for 98% of the variance in HRQL. For each item, the high one of the two loadings was considered to be the "high factor loading" denoted by an asterisk (*). For the total workers, the range of high loadings was from 0.32 to 0.71. For women, high loadings ranged from 0.30 to 0.72 and for men high loadings ranged from 0.31 to 0.72. Clearly, for the total workers, most psychological, social and environment items (14 out of 17) had high loading on factor 1 and most physical items (6 out of 7) had high loading on factor 2. For the total workers, EFA showed that factor 1 corresponds to the psychological, social and environmental domains, except for three items ("body image and appearance", "negative feeling", and "transportation"). Factor 2 corresponded to the physical domain, except for the "working. capacity". Similar results were shown when applied to men and women separately. A summary of selected fit indexes for confirmatory factor analysis is presented in Table 4. Testing of the four domain structures of the WHOQOL theoretical constructs by CFA showed that there was not a good fit: NNFI = 0.795, CFI = 0.817, RMSEA = 0.0758. It indicated that the four domains with particular items did not adequately fit Taiwan's workers. The model reached a good fit when three pairs of error variances were allowed to covary (i.e., "activities of daily living" and "transportation"; "thinking, learning, memory and concentration" and "opportunities for new information and skills"; "physical environments" and "home environment") and when four items were allowed to cross-load on other domains (i.e.,.
(6) 118. Factor Constructs on Health-related Quality of Life. Table 4. Summary of selected fit indices from confirmatory factor analysis Decrease in Best suggestion RMSEA NNFI CFI chi-square 0.0758 0.795 0.817 Original model 360.6 0.0667 0.838 0.857 Modified model 1 add Phys-EN25 111.0 0.0642 0.850 0.867 Modified model 2 add cov (en25, pn17) 98.7 0.0619 0.861 0.878 Modified model 3 add cov (en13, yn7) 94.1 0.0604 0.871 0.887 Modified model 4 add cov (en23, en9) 86.9 0.0577 0.881 0.896 Modified model 5 add Psyc-PN18 84.9 0.0555 0.890 0.905 Modified model 6 add Phys-EN26 96.3 0.0529 0.901 0.914 Final model add Phys-YN11 RMSEA = root mean square of approximation; NNFI = non-normal fit index; CFI = comparative fit index. The same final model for male workers: RMSEA = 0.0559, NNFI = 0.889, CFI = 0.903. The same final model for female workers: RMSEA = 0.0531, NNFI = 0.900, CFI = 0.913.. Figure. The final structural model using a second-order CFA. Relationship between the 4 latent variables (constructs) and each of their measures. The curved 2headed arrows indicate an association between 2 variables. The variables in the ellipses are latent constructs. The items in the rectangular boxes are the observed items.. "transportation" on physical domain; "working capacity" on psychological domain; "negative feeling" on physical domain; "body image and appearance" on physical domain). The final proposed model constructs was also a good fit when applied to male workers (NNFI = 0.889, CFI = 0.903, RMSEA = 0.0559) and female workers (NNFI = 0.900, CFI = 0.913, RMSEA = 0.0531) separately. The final proposed model is a completely standardized solution (Figure). The doubleheaded curved lines show the correlation coefficient between two domains and the singleheaded straight lines show the standardized regression coefficients. The coefficients indicate that the domains on the left of the lines have direct effects on the domain (or item) on the right of the lines. Moreover, we tested a second-order CFA model (Figure) to see whether the four domains (constructs) can be explained by one-higher latent constructs of overall quality of life. This secondorder CFA had a good fit: NNFI = 0.901, CFI = 0.914, RMSEA = 0.0528. The four first-order factors were found to load highly and significantly on their second-order factors (standardized loadings: 0.60 for physical, 0.91 for psychological, 0.95 for social and 0.96 for environmental domains, p < 0.05). The standardized coefficients (0.12 to 0.71) showed that the conceptual model was valid overall for Taiwanese workers. However, the transportation item only had a standardized coefficient of 0.06, which suggests that, unlike the elderly and/or.
(7) Wen-Miin Liang, et al.. sick, workers' satisfaction with transportation may be greatly affected by Taiwan's chronic traffic problems, especially during business hours. As such, this item is not internally consistent with the other items in the environmental domain. DISCUSSION. The questionnaire we used in this study measured health-related quality of life (HRQL) which is different from the quality of work life (QWL). QWL is more related to job satisfaction than HRQL, while HRQL is more related to personal perceptions of well-being and health than QWL [21-27]. Perception of well-being or health is subjective. Therefore, there is often a high intercorrelation between factors. In this study, WHOQOL revealed that most psychological, social and environmental items (14 out of 17) had high loading on factor 1 and most physical items (6 out of 7) had high loading on factor 2. The results were consistent with the findings in the SF-36, which is another well established HRQL instrument with eight conceptual scales. The SF36 has been shown to yield reliable scale scores measuring eight dimensions of health status, which have two underlying measures of physical and mental health [28,29]. Fuh et al used the SF36 to measure HRQL among middle-aged women in a rural community and found that the scales "physical functioning", "role physical" and "body pain" represented an underlying physical factor, and that the scales "mental health" and "role emotional" clearly cluster in the mental factor [30]. Exploratory factor analysis (EFA) and confirmatory factor analysis (CFA) may suggest different model structures for various reasons such as demographic characteristics or study subjects. In the Seattle Longitudinal Study (SLS), EFA revealed a two-factor structure and CFA revealed a three-factor solution for the 13-item Quality of Life in Alzheimer's Disease (QOLAD) scale among a sample of 499 non-demented, community-dwelling older adults, ages 57 to 95 years (Mean age, 73.07; SD = 8.30) [31]. The WHOQOL-BREF uses a four-dimensional. 119. model, but EFA of our results only revealed two dimensions. The first dimension included most of the items from the Social, Psychological and Environmental domains. The second dimension was mostly made up of items from the Physical domain. Although the theoretical construct of the WHOQOL did not fit precisely according to CFA, there was a good fit overall after a few adjustments. The differences between the models suggested by EFA and CFA may have been due to inter-correlations among some domains as well as cultural factors. EFA and CFA were performed not only to explore and confirm the factor constructs of the WHOQOL model but also to help us better understand the factor constructs of our data [3135]. For example, body image (psychological domain), negative feelings (psychological domain) and transportation (environmental domain) were influenced by the physical domain. Working capacity was influenced by the psychological domain. There were 3 intercorrelations suggested by CFA: "activities of daily living" with "transportation", "thinking, learning, memory and concentration" with "opportunities for new information and skills", and "physical environments" with "home environment". All of the adjustments and intercorrelations were reasonable given the effect of psychological factors on multiple items across the different domains. In addition, selected workers were interviewed to subjectively confirm these data. The inconsistent items such as "activities of daily living" and "transportation", some potential factors other than the factor constructs of the WHOQOL-BREF may be explained by Taiwanese workers' attitude toward daily activities and transportation. Taiwanese workers' daily activities and satisfaction with transportation may be affected by the chronic traffic problems in Taiwan, especially during the workday. This may explain the additional potential factor implied in the modification curve between the error covariance of the transportation item and the activity item. The theoretical model in the WHOQOL did.
(8) 120. Factor Constructs on Health-related Quality of Life. not fit precisely. However, there was a good fit after a few adjustments using modification indices from CFA. More information about workers' HRQL can be obtained from closely examining the adjustments of the factor construct of the model that were analyzed by EFA and CFA. Similar EFA and CFA results were obtained when applied to male workers and female workers, respectively. Our findings provide a deeper understanding of factor constructs for Taiwanese workers' HRQL.. 9. Igbaria M, Siegel SR. An examination of the antecedents of turnover propensity of engineers: an integrated model. J Eng Technol Manag 1992;9:10126. 10. Greener MJ, Guest JF. Do antidepressants reduce the burden imposed by depression on employers? [Review] CNS Drugs 2005;19:253-64. 11. Locke EA, Frederick E, Lee C, et al. Effect of selfefficacy, goals, and task strategies on task performance. J Appl Psychol 1996;69:241-51. 12. Spreitzer GM. An empirical test of a comprehensive model of intrapersonal empowerment in the workplace. Am J Community Psychol 1995;23:601-29. 13. Efraty D, Sirgy MJ. The effects of Quality of Working Life (QWL) on employee behavioral responses. Soc Indic Res 1990;22:31-48. 14. Efraty D, Sirgy MJ, Claiborne CB. The effects of personal alienation on organizational identification: a quality-of-work life model. J Bus Psychol 1991;6:5778. 15. Sirgy MJ, Efraty D, Siegel P, et al. A new measure of quality of work life (QWL) based on need satisfaction and spillover theories. Soc Indic Res 2001;55;241-302. 16. Fragala G, Bailey LP. Addressing occupational strains and sprains: musculoskeletal injuries in hospitals. AAOHN J 2003;51:252-9. 17. Hatcher L. A step-by-step approach to using the SAS system for factor analysis and structural equation modeling. SAS Institute Inc., Cary, NC, USA, 1994. 18. Bentler PM. EQS structural equations program manual. Rncino, CA: Multivariate Software, 1995. 19. Browne N, Cudeck R. Single sample cross-validation indices for covariance structures. Multivariate Behav Res 1989;24:445-55. 20. Joreskog KG, Sorbom D. LISREL 8: Structural Equation Modeling with the SIMPLIS Command Language (fourth printing). Scientific Software International, Inc., 2001. 21. Frank-Stromberg M. Instruments for Clinical Healthcare Research. Norwalk, CT: Appleton & Lange, 1997. 22. Campbell A. Subjective measures of well-being. Am Psychol 1976;31:117-24. 23. Pearlman RA, Uhlmann RF. Quality of life in chronic diseases: perceptions of elderly patients. J Gerontol 1988;43:25-30. 24. Zhan L. Quality of life: conceptual and measurement issues. [Review] J Adv Nurs 1992;17:795-800. 25. Cohen SG, Chang L, Ledford GE. A hierarchical construct of self-management leadership and its. ACKNOWLEDGMENTS. The authors would like to thank the Institute of Occupational Health and Safety, the Council of Labor for their administrative and financial support, and all interviewers who participated in the program. This study was also supported by a grant (NHRI-EX93-9204PP) from the National Health Research Institute, Taiwan. REFERENCES. 1. Szabo S. The World Health Organization quality of life (WHOQOL) assessment instrument. In: Spilker B, ed. Quality of Life and Pharmacoeconomics in Clinical Trials. Philadelphia: Lippincott-Raven, 1996:355-62. 2. T h e W HO Q O L G ro u p . D e v elo p me n t of the WHOQOL: rationale and current status. Int J Ment Health 1994;23:24-56. 3. The WHOQOL Group. The World Health Organization Quality of Life assessment (WHOQOL): position paper from the World Health Organization. Soc Sci Med 1995;41:1403-9. 4. The WHOQOL Group. The World Health Organization Quality of Life assessment (WHOQOL): development and general psychometric properties. Soc Sci Med 1998;46:1569-85. 5. The WHOQOL Group. Development of the World Health Organization WHOQOL-BREF quality of life assessment. Psychol Med 1998;28:551-8. 6. World Health Organization. WHOQOL study protocol. Geneva: WHO, 1993 (MNH/PSF/93.9). 7. World Health Organization. Resources for new WHOQOL centers. Geneva: WHO, 1995 (MNH/PSF/ 95.3). 8. Burton WN, Morrison A, Wertheimer AI. Pharmaceuticals and worker productivity loss: a critical review of the literature. [Review] J Occup Environ Med 2003;45:610-21..
(9) Wen-Miin Liang, et al.. relationship to quality of work life and perceived work group effectiveness. Pers Psychol 1997;50:275-308. 26. Wahlqvist P, Carlsson J, Stalhammar NO, et al. Measuring lost productivity in patients with GORD using a productivity questionnaire (WPAI-GORD). Qual Life Res 1999;8:576. 27. Spinks WA. A survey of home-based workers in Japan: emerging health issues. J Occup Health 2002;44:248-53. 28. McHorney CA, Ware JE Jr, Raczek AE. The MOS 36Item Short-Form Health Survey (SF-36): II. Psychometric and clinical tests of validity in measuring physical and mental health constructs. Med Care 1993;31:247-63. 29. Keller SD, Ware JE Jr, Bentler PM, et al. Use of structural equation modeling to test the construct validity of the SF-36 health survey in ten countries: results from the IQOLA Project. International Quality of Life Assessment. J Clin Epidemiol 1998;51:117988. 30. Fuh JL, Wang SJ, Lu SR, et al. Psychometric evaluation of a Chinese (Taiwanese) version of the SF-. 121. 36 health survey amongst middle-aged women from a rural community. Qual Life Res 2000;9:675-83. 31. Schofield MJ, Mishra GD. Validity of self-report screening scale for elder abuse: Women's Health Australia Study. Gerontologist 2003;43:110-20. 32. Revell A, Caskie G, Willis S, et al. Quality of Life in Alzheimer's Disease (QOL-AD) scale: exploration of factor solutions in non-demented elders. Gerontologist 2002;42:147-7. 33. Tseng HM, Lu JF, Gandek B. Cultural issues in using the SF-36 health survey in Asia: results from Taiwan. Health Qual Life Outcomes 2003;1:72. 34. Hwang HF, Liang WM, Chiu YN, et al. Suitability of the WHOQOL-BREF for community-dwelling older people in Taiwan. Age Ageing 2003;32:593-600. 35. Chen JJ, Chang YY, Liang WM, et al. Factor construct and health profile which define the quality of life in patients with chronic obstructive pulmonary disease. Mid Taiwan J Med 2004;9:103-12..
(10) 122. 1. 2. 1. 2. 1999 7,597,386. ). 1461. ( (669. 69. 792. ). 16. (WHOQOL-BREF) 98% (. 80% (17. 6. 18%) 14. ). (7. ). 2005;10: 113-22. 500. 1. 2005. 1. 20. 2005. 7. 20. 2005. 4. 8.
(11)
數據
相關文件
In addition, we successfully used unit resistors to construct the ratio of consecutive items of Fibonacci sequence, Pell sequence, and Catalan number.4. Minimum number
6 《中論·觀因緣品》,《佛藏要籍選刊》第 9 冊,上海古籍出版社 1994 年版,第 1
One could deal with specifi c topics for researching on Buddhist Literature while one has to clarify the categories and analyze the problems of methodology to construct “History
Reading Task 6: Genre Structure and Language Features. • Now let’s look at how language features (e.g. sentence patterns) are connected to the structure
When Wasan mathematicians propose mathematics problems, two aspects of knowledge activities related to mathematics research and practice are considered: They construct Jutsu using
By University students of the Chung Hua University for objects, to make use of the descriptive statistics, the reliability analysis, and the factor analysis, considers the
In view of this, this paper attempt to explore the impact of service quality, product involvement, perceive risk on purchase intention.. For affected consumer’s major factor in
(1989), “A Theoretical Assessment of the User Satisfaction Construct in Information Systems Research,”.. Management
