Diversity and Distributions, (Diversity Distrib.) (2006) 12, 546–554
B I O D I V E R S I T Y
R E S E A R C H
ABSTRACT
Energy, climate, habitat heterogeneity, and human activity are important correlates of spatial variation in species richness. We examined the correlation between species richness and these variables using the birds that breed in northern Taiwan. We con-ducted general linear models (GLMs) and spatial correlation models to examine the relationship between bird species richness (BSR) and environmental variables. We found that normalized difference vegetation index (NDVI) was the most important predictor of BSR. We suggest productivity is the primary process of BSR. Addition-ally, we hypothesized that scale dependency might exist in the relationship between BSR and NDVI in Taiwan. Human population density, the second most important factor, was inversely correlated with BSR. The factor and BSR did not have similar response to NDVI, which contradicted observations in most of the previous studies on human population vs. species richness. We proposed that the human population density had an effect on NDVI, which in turn had an effect on BSR. Moreover, we hypothesized that the contradiction between our study and the previous studies might arise from a higher level of human disturbance in Taiwan than in other areas. The necessity of conserving native species in intensively developed lowlands of Taiwan cannot be overemphasized. Number of land cover type was another significant pre-dictor of BSR. Habitat heterogeneity may have an effect on BSR in Taiwan.
Keywords
Bird species richness, NDVI, productivity hypothesis, climate hypothesis, habitat heterogeneity, human activity, spatial autocorrelation.
INTRODUCTION
Species richness varies enormously over broad spatial scales. Many hypotheses have been proposed to explain gradients in species richness (Pianka, 1966; Rohde, 1992; Rosenzweig, 1995). However, mechanisms underlying species richness gradients are still subject to debate. Four of the hypotheses frequently discussed are energy, climate, habitat heterogeneity, and human activities (Kerr & Packer, 1997; Rahbek & Graves, 2001; Chown
et al., 2003; Francies & Currie, 2003; H-Acevedo & Currie, 2003;
Hawkins et al., 2003).
The ‘energy hypothesis’ has received a great deal of attention in
the past 20 years (Hawkins et al., 2003; Currie et al., 2004; Evans
et al., 2005). There are at least two versions of the energy
hypo-thesis. The ‘productivity’ version states that species richness increases with productivity. Thus, for animals, species richness would be limited by the production of food items (e.g. plant biomass for herbivores, herbivore biomass for predators). Many studies have shown positive monotonic relationship between
primary productivity and species richness of various plant and animal groups (Brown & Lomolino, 1998; Gaston, 2000). Recently, Evans and Gaston (2005) proposed nine principle mechanisms that may generate positive species richness–energy relationship. However, a hump-shaped relationship between primary productivity and species richness has been found
more commonly (Rosenzweig, 1995; Mittelbach et al., 2001). The
‘ambient energy’ version is based on the physiological require-ments of organisms. For example, Currie (1991) hypothesized that thermoregulatory needs explain why the species richness of terrestrial North American vertebrates is more strongly corre-lated with annual potential evapotranspiration (PET, a measure of ambient or atmospheric energy) than with annual actual evapo-transpiration (AET, a measure of water–energy balance closely associated with plant productivity).
Regional patterns of species richness correlate with climate. Putative causal mechanisms include climatic stability, variability, favourability, and harshness (Pianka, 1966; Currie, 1991; Rohde, 1992). The climatic stability hypothesis (Klopfer, 1959) states
1
Institute of Ecology and Evolutionary Biology, National Taiwan University, Taipei 106, Taiwan;
2
Taiwan Forestry Research Institute, Council of Agriculture, Taipei 100, Taiwan; and 3
Endemic Species Research Institute, Nantou 552, Taiwan
*Corresponding author. Chao-Nien Koh, Institute of Ecology and Evolutionary Biology, National Taiwan University, Taipei 106, Taiwan. Tel.: 886-2-23039978; Fax: 886-2-23078755; E-mail: nien@tfri.gov.tw
Blackwell Publishing Ltd
Bird species richness patterns of northern
Taiwan: primary productivity, human
population density, and habitat
heterogeneity
Spatial distribution of bird species richness in northern Taiwan that climatically stable environment will permit the coexistence
of more niches with predictable resources on which rare species can specialize and therefore will favour an increase in species richness (Brown & Lomolino, 1998). The favourableness–stress hypothesis (Richerson & Lum, 1980) states that species richness is favoured when the mean values of the environmental variables lie within the optimal range for the physiological needs of the species. H-Acevedo and Currie (2003) found a consistent rela-tionship between breeding bird richness and climate from the arctic to the tropics when they accounted for water and heat, and the interaction between the two. Francies and Currie (2003) car-ried out a study of the global distribution of angiosperm family richness and they also found a globally consistent relationship between richness and climate, characterized by water and heat, and the interaction between the two.
The habitat heterogeneity hypothesis states that greater spatial variation in physical or environmental conditions allows for greater niche differentiation and, hence, more species (MacArthur & MacArthur, 1961). Rosenzweig (1995) provided several examples of this relationship. Rahbek and Graves (2001) argued that habitat heterogeneity (measured as range in elevation) pre-dicted bird diversity in northern South America. Kerr and Packer
(1997) found that in high-energy (i.e. PET ≥ 1000 mm/year)
regions of North America, the mammal species richness is best predicted by topographical heterogeneity (i.e. elevation variability) and local variation in energy availability. No study has examined an effect of habitat heterogeneity on bird species richness (BSR) in Taiwan except a macroscale study of East Asia
by Ding et al. (in press). They used elevation range as a surrogate
of topographical heterogeneity to evaluate its role of predicting BSR. However, they did not find it important to explaining patterns of BSR in islands of East Asia.
Every continental extinction in recorded history has been attributed to human activity, primarily habitat alteration, hunt-ing, and pollution (Kerr & Currie, 1995). Human alteration of habitat is the single greatest threat to biodiversity throughout the
biosphere (Campbell et al., 1999). However, positive
relation-ships between species richness and human population density
are often observed at large spatial scales (Balmford et al., 2001;
Chown et al., 2003; Gaston & Evans, 2004; Evans & Gaston,
2005). They argued that such pattern might arise because both species richness and human density increase with energy avail-ability. They predicted that future conflict between conservation and development cannot be avoided because increasing human resource demands will pose greater threats to biodiversity. Considerably larger efforts will have to be made to set aside and protect conservation areas in species-rich regions, and to integrate more carefully conservation requirements into land use plan-ning, than is currently the case. On the other hand, if the rela-tionship between species richness and human activity is inversely related, areas rich in species might not be severely compromised by the ongoing development. Such relationship between species richness and human activity has not been studied in a highly populated but rather small country, such as Taiwan. The result of the people vs. species richness research may reveal conservation needs in densely populated areas.
Few studies have investigated the relationship between BSR and environmental variables in Taiwan with a large spatial
extent. Recently, Lee et al. (2004) analysed the interrelationships
among elevation, primary productivity, urbanization, and BSR by selecting 288 bird census reports for Taiwan and organizing
them into 2 × 2 km quadrat system. Elevation and road density
(a surrogate for urbanization) were important determinants of BSR in Taiwan. In contrast, normalized difference vegetation index (NDVI) (a surrogate of primary productivity) played an insignificant role in determining the BSR, which contrasts with the positive or unimodal species–energy relationship, which has been widely reported (Rosenzweig, 1995; Brown & Lomolino,
1998; Gaston, 2000; Mittelbach et al., 2001).
Using fine-grained (1 × 1 km) and systematic bird census data,
we evaluated the power of the energy, climate, habitat hetero-geneity, and human activity hypotheses to explain patterns of BSR in northern Taiwan. We especially paid more attention to relationships among energy, human activity, and BSR. We also discussed a conservation problem implied by theses relationships.
METHODS Study area
Taiwan is a continental island south-east of the Asian mainland. It is separated from the mainland by the Taiwan Strait, which is about 150 km wide. The lofty mountains of Taiwan include more than 200 peaks higher than 3000 m (Wang, 1980). The climate of Taiwan is generally subtropical. Temperature decreases as
elevation increases at a lapse rate of −5.43 °C km−1 (Su, 1984).
Precipitation is heaviest during the summer, but rain falls year-round in northern Taiwan. Due to the high precipitation, forests are the primary type of natural vegetation in Taiwan. Broadleaf forests are dominant at lower elevations (generally under 2500 m) and conifer forests are dominant at higher elevations.
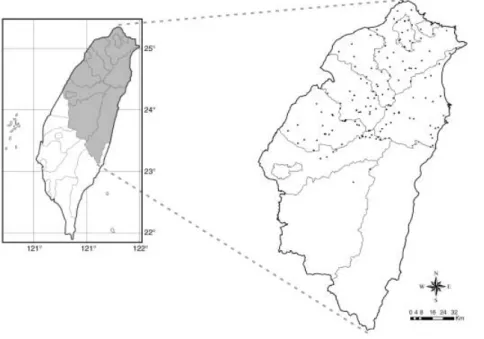
This study was conducted in northern Taiwan (Fig. 1) over an
area 11,388.6 km2. It lies between 24°00′ N−25°18′ N, and
120°27′ E−122°00′ E. The greatest N–S distance is 144.9 km, and
the greatest E–W distance is 150.85 km. In general, the elevation gradient increases from north to south, with mountains higher than 3000 m located primarily in the southern portion of northern Taiwan. In northern Taiwan, the temperature averages
21.5 °C at sea level (range: 16.7–23.0 °C) (Taiwan Central
Weather Bureau, http://www.cwb.gov.tw). Precipitation in the study area averages 2976.4 mm annually at sea level (range: 1283.0 – 4892.4 mm) (Taiwan Central Weather Bureau). Vegeta-tion types occurring along the elevaVegeta-tional gradient are
Ficus–Machilus, Machilus–Castanopsis, Quercus, Tsuga–Picea,
Abies, and alpine (Su, 1992).
Bird data
Breeding bird species richness data were obtained from 141 sample sites from early March to the end of June in 2001–03. Each site was sampled one time. Sites were chosen based on four GIS layers, including ecoregion, elevation, vegetation, and road
C.-N. Koh et al.
distribution layers. The proportion of the total number of sites in the study that were located in each ecoregion was determined by the proportion of the total area represented by an ecoregion. The same criterion was used to determine the number of sites placed at each elevation, low (0 –1000 m), mid (1000 –2000 m), and high (above 2000 m), within an ecoregion, and in each vegetation type within an elevation range. All sites were placed in areas with road systems to make sure that the sites were attainable by vehicles and feet.
At each site, we established a 1500-m transect with 10 sam-pling point counts located 150 m apart. At each site, we sampled 10 point counts as 10 replicates for that site. We sampled point counts in a homogeneous habitat. Four sites had point counts less than 10 for lack of enough area of homogeneous habitats. At each point count, we recorded the number, distance, and sex (by appearance or song if possible) of all birds that were seen or heard during a 6-min sample period. We used the variable
circu-lar plot method (Reynolds et al., 1980). Exotic species, migrants,
and individuals of breeding species that were passing through the
area were excluded from analyses. Sampling was conducted dur-ing sunny, windless days from sunrise to no more than 3 h later. Geographical coordinates and elevations for each point count were taken with a handheld Global Positioning System receiver (Garmin Ltd, Taipei, Taiwan). We averaged coordinates of all point counts in a site and designated the average as a coordinate of the site. An elevation of a site was computed in the same way. BSR for each site was calculated as the cumulative species rich-ness across all the point counts at that site. We used capture– recapture models, which were suggested in recent publications
(e.g. Boulinier et al., 1998; Cam et al., 2000), and
soft-ware (Rextad & Burnham, 1991) to derive probabilistic nonpara-metric estimate of species richness.
Environmental variables
To test each hypothesis, we employed variables of primary pro-ductivity, climate, habitat heterogeneity, and human activity (Table 1). Primary productivity was estimated by the advanced
Figure 1 Map of the sampling locations in northern Taiwan. Each dot represents a sampling site.
Table 1 Variables used in regression analyses and the associated hypothesis
Variable Code Associated hypothesis
Normalized Difference Vegetation Index NDVI Productivity
Mean annual temperature (°C) T_MEAN Climate
Range of maximum and minimum monthly temperature (°C) T_RANGE Climate
Annual total precipitation (mm year−1) P_TOTAL Climate
Range of maximum and minimum monthly precipitation (mm year−1) P_RANGE Climate
Range of maximum and minimum elevation within 1 × 1 km (m) ELEV_RANGE Habitat heterogeneity
Number of land cover types COVERTYPE Habitat heterogeneity
Urbanization index URBAN Human activity
Nearest distance to a national or provincial road (m) D2_RD Human activity
Naturalness index NATURE Human activity
Spatial distribution of bird species richness in northern Taiwan very high-resolution radiometer-normalized difference
vegeta-tion index (NDVI) by SPOT images taken in 2002. NDVI is highly correlated with green-leaf area and absorbed photo-synthetically active radiation (Tucker, 1979; Curran, 1980; Goward
et al., 1985). It has been used as a surrogate for primary
produc-tivity and vegetative growth in terrestrial ecosystems (Box et al.,
1989; Ustin et al., 1991). Climatic data were extracted from an
ecological and environmental GIS database for Taiwan (Lee et al.,
1997) for the period 1959–85, and compiled at a resolution of
1 × 1 km.
The range in elevation within each 1 × 1 km quadrat, which
was determined from a DTM (Digital Terrain Model) with
40 × 40 m resolution, was used as a measure of habitat
hetero-geneity. Another common measure of habitat heterogeneity, or habitat complexity, is the number of vegetation types (van
Rens-burg et al., 2002). Instead of vegetation types, we used a number
of land cover types as a surrogate of the habitat heterogeneity. The land cover types were classified into cities, fish farms, farm-lands, orchards, plantations, secondary forests, and primary
for-ests (Lee et al., 1997). The number of land cover types around
each site was recorded during the bird survey. Human activity was assessed with four variables: an urbanization index, distance to a road, a naturalness index, and human population density,
which were extracted from Lee et al. (1997), except the human
population density. The urbanization index was calculated as a sum of a second (mining, water, electricity, and building indus-try, etc.) and a third classes (business, transportation, commun-ication, and service, etc.) of industrial population divided by a sum of a first (agriculture), a second, and a third classes of indus-trial population. Distance to a road was the nearest distance to a national or provincial road. The naturalness index was calculated
based on data on a vegetation map of Taiwan (Lee et al., 1997).
There were 10 levels of naturalness, ranging from land covered with natural vegetation (level 10) to highly developed land (level
1). Human population density (people/km2) was calculated from
estimates of the area of each town and of its human population size, which were obtained from 2001 (Ministry of the Interior, 2002).
Statistical analysis
The power of different hypotheses to explain patterns of species richness can be tested using multiple regression. However, pat-terns of spatial autocorrelation in the data can violate the basic assumption of spatial independence for general linear models (GLM), resulting in biased conclusions in the analyses (Cliff & Ord, 1973). Autocorrelation is the lack of independence between pairs of observations at given distances in time or space and it is common in ecological data (Legendre, 1993). Several recent studies have demonstrated the importance of using statistical techniques that account for spatial autocorrelation on some level
when assessing species distributions (Lichstein et al., 2002; Dark,
2004; Tognelli & Kelt, 2004). Lennon et al. (2000) argued that, in
addition to the difficulty of testing hypotheses due to inflated type I errors, there is a systematic bias toward particular kinds of mechanisms associated with variables that have greater spatial
autocorrelation. To control for spatial autocorrelation, we incor-porated spatial analysis into standard statistical methods. We used SAS procedure ‘PROC GLM’ and a stepwise approach to fit a multiple stepwise regression model between BSR and all envi-ronmental variables. Significance values to enter and to leave the
model were set at α = 0.05. Residuals were normally distributed
and their variances were homogeneous (Sokal & Rohlf, 1981). We used the SAS procedure ‘PROC MIXED’ to implement spatial correlation models that fit a spatial covariance matrix to the data and use this to adjust test statistics accordingly. Technical details
of the spatial model are given in Littell et al. (1996). We used the
likelihood ratio test to check if a spatial covariance model fitted data on BSR significantly better than an independent error model. A Gaussion spatial covariance structure was chosen as it gave a significantly better fit than five alternative covariance structures (spherical, exponential, linear, linear log, and power).
Our goal was to evaluate the power of each hypothesis to explain the pattern of breeding BSR in northern Taiwan. To com-pare the predictive power of these hypotheses, we began by fitting GLM that ignored spatial autocorrelation. We calculated Pearson product–moment correlation coefficients between every pair of explanatory variables. When the correlation coefficient for any pair of variables was > 0.5, we incorporated the variable most closely correlated to BSR into the regression analysis to reduce collinearity between explanatory variables in regression model. Variables that were significant in these models were then evalu-ated with regression models that contain spatial autocorrelation. Square term of T_RANGE (range of maximum and minimum monthly temperature) and P_RANGE (range of maximum and minimum monthly precipitation) were included as predictors so that simple linear relationships could be detected. BSR, human population density (POPN), the nearest distance to a national or provincial road (D2_RD), range of maximum and minimum monthly temperature (T_RANGE), and range of maximum and minimum monthly precipitation (P_RANGE) with its quadratic term were logarithmically transformed to stabilize variances and improve normality of the residuals. To compare with the study
conducted by Lee et al. (2004), we regressed elevation including
its quadratic and cubic terms, primary productivity (i.e. NDVI), and human activity (i.e. population density) on BSR, applying forward stepwise multiple regression. Significance values to enter
and to leave the model were set at α = 0.05.
RESULTS
Pearson correlation coefficients for each pairing of the variables NDVI, T_MEAN (mean annual temperature), ELEV_RANGE
(range of maximum and minimum elevation within 1 × 1 km),
NATURE (naturalness index), D2_RD (nearest distance to a national or provincial road), and URBAN (urbanization index) were greater than 0.5. We incorporated NDVI, which most strongly correlated with BSR, into the regression analysis. BSR was then regressed against eight variables including square terms of T_RANGE and P_RANGE. Three of the eight environmental variables were significant and entered into the model in GLM regression analysis. The GLM explained 39.9% of the variance
C.-N. Koh et al.
(P < 0.0001) in logarithmically transformed BSR (Table 2). A
spatial null model that assumed an Gaussian spatial covariance structure fitted data on BSR significantly better than an
inde-pendent error null model (likelihood ratio test χ2 = 16.5,
P < 0.001).
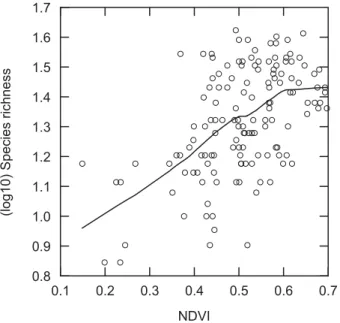
NDVI was the most important predictor of the BSR in the independent error and the spatial models (Table 2). It was
posi-tively related to BSR (r= 0.537, P < 0.001 Fig. 2). The likelihood
ratio test comparing the null spatial model to the independent error model showed that NDVI was significantly spatially
auto-correlated (likelihood ratio test χ2= 21.1, P < 0.001). NDVI had
a hump-shaped distribution on elevational gradients (Fig. 3). POPN, as a surrogate of human activity also had an important role in predicting the BSR (Table 2). Its reverse relationship with
the BSR (r= –0.526, P < 0.001 Fig. 4) contradicts previous
stud-ies which state a positive relationship between human
popula-tion size and species richness (Balmford et al., 2001; Chown
et al., 2003; Gaston & Evans, 2004). Moreover, apparently
nega-tive relationship between BSR and human population density
appeared in plots of population density > 10 people/km2
(r= –0.547, P < 0.001), which contradicted to no relationship in
Table 2 General linear model (GLM) and spatial model applied to bird species richness in northern Taiwan
Model Variables Parameter estimate Partial r2 Model r2 F P
GLM NDVI 0.629 0.278 0.278 53.10 < 0.0001 log10 (POPN) −0.052 0.081 0.359 17.30 < 0.0001 COVERTYPE 0.046 0.041 0.399 9.18 0.003 Spatial NDVI 0.677 25.42 < 0.0001 log10 (POPN) −0.045 8.28 0.005 COVERTYPE 0.039 7.54 0.007
Figure 2 Breeding bird species richness positively correlated with normalized difference vegetation index (NDVI) in northern Taiwan. The line was fitted by LOWESS smoothing.
Figure 3 Normalized difference vegetation index (NDVI) showed hump-shaped relationship with elevation in northern Taiwan. The line was fitted by LOWESS smoothing.
Figure 4 Breeding bird species richness inversely correlated with human population density in northern Taiwan. The line was fitted by LOWESS smoothing.
Spatial distribution of bird species richness in northern Taiwan
plots of population density < 10 people/km2 (r= 0.014,
P = 0.936). The spatial autocorrelation in POPN is also
signifi-cant (likelihood ratio test χ2 = 13.4, 0.001 < P < 0.005). POPN
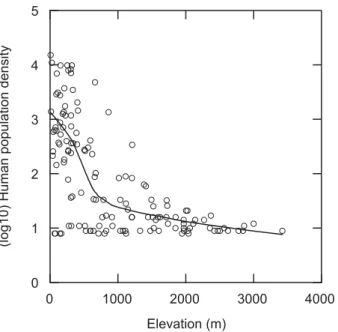
declined sharply from 0 to about 800 m in elevations, followed by a gradual decrease from 800 m to about 3500 m (Fig. 5). It was inversely related with NDVI (r = –0.423, P < 0.001 Fig. 6), however, significantly negative and no relationship appeared in
plots of population density > 10 people/km2 (r = –0.629, P < 0.001)
and plots of population density < 10 people/km2, respectively
(r = 0.0025, P = 0.989). A last core environmental predictor was COVERTYPE (Table 2). It has positive relationship with the BSR (r = 0.331, P < 0.001) and was significantly spatially
autocorre-lated (likelihood ratio test χ2 = 10.5, 0.005 < P < 0.01).
In regression of BSR against elevation (including its quadratic and cubic terms), NDVI, and human population density, the latter two variables were significant in the model (F(NDVI) = 53.1,
P < 0.0001, F(human population density) = 17.3, P < 0.0001).
In contrast, elevation and its quadratic and cubic terms were removed from the model.
DISCUSSION
In the independent error model and the spatial model, NDVI was the most important variable. Therefore, the ‘productivity’ hypothesis best explained patterns of BSR in northern Taiwan. This result was expected because Hawkins et al. (2003) con-cluded that water or water–energy (i.e. productivity) constrains richness in the subtropics and tropics, whereas ambient energy strongly constrains species richness in the far north.
Lee et al. (2004) selected 288 bird censuses and conducted for-ward stepwise multiple regression to evaluate the effects of the elevation, primary productivity, and urbanization on BSR. They proposed that BSR might decrease with decreasing primary pro-ductivity in Taiwan. Our findings support this proposal. Interest-ingly, after the effects of elevation and road density had been justified, Lee et al. (2004) did not find that NDVI was a determ-inant of BSR. However, we found that NDVI explained 27.8% of the variance in BSR after the effects of POPN and COVERTYPE
had been justified. We used a system of 1 × 1 km quadrats,
whereas Lee et al. (2004) used 2 × 2 km quadrats.
The regression of elevation including its quadratic and cubic terms, primary productivity (i.e. NDVI), and human activity (i.e. population density) on BSR in this study showed that NDVI and human population density were significant in the model. In contrast, elevation and its quadratic and cubic terms were removed from the model. Additionally, comparing to the signifi-cant correlation of BSR and NDVI in our study, the two variables in Lee et al. (2004) have nonsignificant correlation in the range of NDVI < 0.5 (r = 0.03, P = 0.57). Therefore, NDVI played a more important role of predicting BSR in a smaller grain-sized system. Previous studies of scale effects on species richness patterns revealed that the perception of pattern and the conditional explanatory power of independent variables were directly dependent on the scale of analysis (i.e. grain size, Rahbek & Graves, 2001; van Rensburg et al., 2002). The relationships between species richness and climate-related variables were not only found to be scale-dependent, but were also declined at coarser scales (Foody, 2004; Rahbek, 2005). These findings support a hypothesis of scale dependency in the relationship between BSR and NDVI in Taiwan. However, we need further study to find out how results vary as a function of scale and con-sistent patterns in the scale effect, to attribute relative impact of various factors influencing BSR.
POPN was the second most important factor in the independ-ent error model. It was negatively correlated with BSR. However,
Figure 5 Human population density inversely correlated with elevation in northern Taiwan. The line was fitted by LOWESS smoothing.
Figure 6 Human population density inversely correlated with normalized difference vegetation index (NDVI) in northern Taiwan. The line was fitted by LOWESS smoothing.
C.-N. Koh et al.
positive relationships between species richness and human population density are commonly observed at regional scales (Balmford et al., 2001; Chown et al., 2003; Gaston & Evans, 2004; Evans & Gaston, 2005). They proposed that such relationships may arise from a similar response of species richness and human population size to the energy availability. In our study, NDVI was negatively correlated with human population density, but posi-tively correlated with BSR. There was no evidence that birds and humans responded similarly to productivity.
A history of human development in Taiwan may influence the relationships among NDVI, human population density, and BSR. There were dense forests at low-elevational areas of Taiwan in the 17th century, which were demonstrated by a scene of close canopy depicted in a traveller’s note (Yang, 2004). Since Ching Dynasty incorporated Taiwan into its territory in the late 17th century, people from Mainland China immigrated into lowlands and flourished, forests were gradually cleared for human develop-ment (Yeh, 1995). The NDVI vs. elevation plots showed that NDVI decreased from about 1600 m to low elevations, whereas human population size increased from mid to low elevations. We suggest that NDVI declined as human population size increased in mid- to low elevations, that is, NDVI was negatively affected by human population size.
Human population density had a reverse relationship with BSR; however, they were unrelated in plots of population density
< 10 people/km2. The congruency of no relationship in plots
of population density < 10 people/km2 between the pattern of
human population density vs. BSR and that of human popula-tion density vs. NDVI, delivered a hint that human populapopula-tion density might not directly relate to BSR but by ways of NDVI. In summary, the hypotheses we proposed on the relationships among BSR, NDVI, and human population density were that human population density affected NDVI, NDVI affected BSR, and human population density affected BSR by ways of NDVI.
However, the relationship between primary productivity and human population size might not be negative before Taiwan was densely populated. Before large population from mainland China immigrated into Taiwan, most aboriginal people lived in the lower elevations. Their population size might be positively related to the primary productivity of the land. We argued that the possibly positive relationship between human population size and primary productivity was changed to currently negative one, as many people inhabited and the original forest lands were changed to residential areas, farmlands, industrial areas, etc. Moreover, we hypothesized that relationship between human population size and land’s primary productivity might be nega-tive in densely populated areas, otherwise, it may be posinega-tive. Therefore, differences in the relationship of human population density and species richness between our study and studies in other areas (e.g. Balmford et al., 2001; Chown et al., 2003; Gaston & Evans, 2004; Evans & Gaston, 2005) may be due to their different levels of human disturbance.
We have to pay attention to the different results between the study of Taiwan and those of other areas, which imply a serious problem of resource conservation in Taiwan, especially in its low-lands. After serious deforestation and urbanization in lowlands,
habitat conservation including preservation and restoration should be incorporated into urban planning to alleviate the impacts of intensive human disturbances on species richness therefore loss of native species richness might be recovered (McKinney, 2002). In addition to species richness, consistent changes of species composition may occur (McKinney, 2002). The species composition may be changed in a way that species adapted to forest interiors such as tree-foraging insectivores might decline (Clergeau et al., 1998; Cam et al., 2000). For exam-ple, Pericrocotus solaris, a forest-dwelling insectivore, is not seen until 200 m in western lowlands of Taiwan. However, it is com-monly observed in undeveloped forests along east-southern sea shore of Taiwan. The comparison demonstrates that Pericrocotus
solaris might originally inhabit from sea level before it moved up
to less developed forests. In contrast, species dependent on human resources such as non-native species may invade and flourish in the developed lowlands. A high proportion of exotic avian species richness to resident avian species richness (i.e. 48%) showed serious invasion of exotic species in lowlands of Taiwan (Severinghaus, 1999). To conserve the native species rich-ness in urban areas, we recognize that information on abundance and distribution of exotic species is indispensable. We suggest a species richness conservation planning in Taiwan take into account both of restoring native species richness and reducing exotic species richness.
We used elevation range and number of land cover type as surrogates of habitat heterogeneity. Elevation range was not incorporated into the multiple regression on BSR because it was highly correlated with NDVI. Therefore, we could not use range elevation to evaluate the role of habitat heterogeneity in deter-mining BSR. In contrast, the number of land cover type was sig-nificant in the independent error and the spatial models for BSR. That is, habitat heterogeneity explained some proportion of the variance in BSR. This was the first study that demonstrated habitat heterogeneity partly explained species richness in Taiwan. On the other hand, Ding et al. (in press) used elevation range to examine an effect of topographical heterogeneity on BSR in East Asia. They did not find significant relationship between elevation range and BSR of island quadrats (including Taiwan). They con-cluded that the effect of topographical heterogeneity on BSR may be less important than those of primary productivity, isolation, and area size. As we know, topographical heterogeneity measured as altitudinal range has often been used as a proxy for habitat heterogeneity (Jetz & Gahbek, 2002). A pattern of topographical heterogeneity may not be consistent with that of habitat hetero-geneity. Our result did not contradict that of Ding et al. (in press). The difference implied that habitat heterogeneity might be a more promising process than topographical heterogeneity in explaining BSR in Taiwan.
ACKNOWLEDGEMENTS
This study was funded by Council of Agriculture and the National Science Council, Republic of China. We thank Hau-Jie Shiu, Pei-Li Huang, Tsai-Yu Wu, Yi-Ru Cheng, and Fang-Yi Lin for field collection. We are grateful to two anonymous
Spatial distribution of bird species richness in northern Taiwan reviewers for their helpful comments and suggestions on the
manuscript.
REFERENCES
Balmford, A., Moore, J.L., Brooks, T., Burgess, N., Hansen, L.A., Williams, P. & Rahbek, C. (2001) Conservation conflicts across Africa. Science, 291, 2616 –2619.
Boulinier, T., Nichols, J.D., Hines, J.E., Sauer, J.R., Flather, C.H. & Pollock, K.H. (1998) Estimating species richness: the impor-tance of heterogeneity in species detectability. Ecology, 79, 1010 –1028.
Box, E.O., Holben, B.N. & Kalb, V. (1989) Accuracy of the AVHRR vegetation index as a predictor of biomass, primary
productivity and net CO2 flux. Vegetatio, 80, 71– 89.
Brown, J.H. & Lomolino, M.V. (1998) Biogeography, 2nd edn. Sinauer, Sunderland, Massachusetts.
Cam, E., Nichols, J.D., Sauer, J.R., Hines, J.E. & Flather, C.H. (2000) Relative species richness and community completeness: birds and urbanization in the Mid-Atlantic States. Ecological
Applications, 10, 1196 –1210.
Campbell, N.A., Reece, J.B. & Mitchell, L.G. (1999) Biology, 5th edn. Benjamin/Cummings, Menlo Park, California.
Chown, S.L., van Rensburg, B.J., Gaston, K.J., Rodrigues, A.S. & van Jaarsveld, A.S. (2003) Energy, species richness and human population size: conservation implications at a national scale.
Ecological Applications, 13, 1233 –1241.
Clergeau, P., Savard, J.P.L., Mennechez, G. & Falardeau, G. (1998) Bird abundance and diversity along an urban-rural gradient: a comparative study between two cities on different continents. Condor, 100, 413 – 425.
Cliff, A.D. & Ord, J.K. (1973) Spatial autocorrelation. Pion, London. Curran, P.J. (1980) Multi-spectral remote sensing of vegetation
amount. Progress in Physical Geography, 4, 315 –321.
Currie, D.J. (1991) Energy and large-scale patterns of animal-species and plant animal-species richness. The American Naturalist,
137, 27– 49.
Currie, D.J., Mittelbach, G.G., Cornell, H.V., Field, R., Guégan, J.F., Hawkins, B.A., Kaufman, D.M., Kerr, J.T., Oberdorff, T., O’Brien, E. & Turner, J.R.G. (2004) Predictions and tests of cli-mate-based hypotheses of broad-scale variation in taxonomic richness. Ecology Letters, 7, 1121–1134.
Dark, S.J. (2004) The biogeography of invasive alien plants in California: an application of GIS and spatial regression analysis.
Diversity and Distributions, 10, 1–9.
Ding, T.S., Yuan, H.W., Geng, S., Koh, C.N. & Lee, P.F. (2006) Macro-scale bird species richness patterns of the East Asian mainland and islands: Energy, area and isolation. Journal of
Biogeography, 33, in press.
Evans, K.L. & Gaston, K.J. (2005) People, energy and avian spe-cies richness. Global Ecology and Biogeography, 14, 187–196. Evans, K.L., Warren, P.H. & Gaston, K.J. (2005) Species–energy
relationships at the macroecological scale: a review of the mechanisms. Biological Reviews, 80, 1–25.
Foody, G.M. (2004) Spatial nonstationarity and scale-dependency in the relationship between species richness and environmental
determinants for the sub-Saharan endemic avifauna. Global
Ecology and Biogeography, 13, 315 –320.
Francies, A.P. & Currie, D.J. (2003) A globally-consistent richness– climate relationship for angiosperms. The American Naturalist,
161, 523 –536.
Gaston, K.J. (2000) Global patterns in biodiversity. Nature, 405, 220 –227.
Gaston, K.J. & Evans, K.L. (2004) Birds and people in Europe.
Proceedings of the Royal Society of London. Series B: Biological Sciences, 271, 1649 –1655.
Goward, S.N., Tucher, C.J. & Dye, D.G. (1985) North American vegetation patterns observed with the Nimbus-7 Advanced Very High Resolution Radiometer. Vegetatio, 64, 3 –14. H-Acevedo, D. & Currie, D.J. (2003) Does climate determine
broad-scale patterns of species richness? A test of the causal link by natural experiment. Global Ecology and Biogeography,
12, 461– 473.
Hawkins, B.A., Porter, E.E. & Diniz-Filho, A.F. (2003) Productiv-ity and history as predictors of the latitudinal diversProductiv-ity gradi-ent of terrestrial birds. Ecology, 84, 1608 –1623.
Jetz, W. & Gahbek, C. (2002) Geographic range size and determ-inants of avian species richness. Science, 297, 1548 –1551. Kerr, J.T. & Currie, D.J. (1995) Effects of human activity on global
extinction risk. Conservation Biology, 9, 1528 –1538.
Kerr, J.T. & Packer, L. (1997) Habitat heterogeneity as a determ-inant of mammal species richness in high-energy regions.
Nature, 385, 252–254.
Klopfer, P.H. (1959) Environmental determinants of faunal diversity. The American Naturalist, 93, 337–342.
Lee, P.F., Ding, T.S., Hsu, F.H. & Geng, S. (2004) Breeding bird species richness in Taiwan: distribution on gradients of elevation, primary productivity and urbanization. Journal of
Biogeo-graphy, 31, 307–314.
Lee, P.F., Liao, C.Y., Lee, Y.C., Pang, Y.H., Fu, W.H. & Chen, S.W. (1997) An ecological and environmental GIS database for
Tai-wan. Council of Agriculture, Taipei.
Legendre, P. (1993) Spatial autocorrelation: trouble or new para-digm? Ecology, 74, 1659 –1673.
Lennon, J.J., Greenwood, R.E. & Turner, J.R.G. (2000) Bird diversity and environmental gradients in Britain: a test of the species–energy hypothesis. Journal of Animal Ecology, 69, 581– 598.
Lichstein, J.W., Simons, T.R., Shriner, S.A. & Franzreb, K.E. (2002) Spatial autocorrelation and autoregressive models in ecology. Ecological Monographs, 72, 445 – 463.
Littell, R.C., Milliken, G.A., Stroup, W.W. & Wolfinger, R.D.
(1996) system for mixed models, pp. 303–330. SAS Institute
Inc, Cary.
MacArthur, R.H. & MacArthur, J.W. (1961) On bird species diversity. Ecology, 42, 594–598.
McKinney, M.L. (2002) Urbanizaion, biodiversity, and conserva-tion. Bioscience, 52, 883 – 890.
Ministry of the Interior (2002) Taiwan-Fukien demographic fact
book. Ministry of the Interior, Taipei, Taiwan.
Mittelbach, G.C., Steiner, C.F., Scheiner, S.M., Gross, K.L., Reynolds, H.L., Waide, R.B., Willig, M.R., Dodson, S.I. &
C.-N. Koh et al.
Gough, L. (2001) What is the observed relationship between species richness and productivity? Ecology, 82, 2381–2396. Pianka, E.R. (1966) Latitudinal gradients in species diversity: a
review of the concepts. The American Naturalist, 100, 33 – 46. Rahbek, C. (2005) The role of spatial scale and the perception of
large-scale species-richness patterns. Ecology Letters, 8, 224 – 239.
Rahbek, C. & Graves, G.R. (2001) Multiscale assessment of patterns of avian species richness. Proceedings of the National
Academy of Sciences, USA, 98, 4534 – 4539.
van Rensburg, B.J., Chown, S.L. & Gaston, K.J. (2002) Species richness, environmental correlates, and spatial scale: a test using South African birds. The American Naturalist, 159, 566 – 577.
Rextad, E. & Burnham, K.P. (1991) User’s guide for interactive
program . Abundance estimation for close animal
populations. Colorado State University, Ft. Collins, Colorado.
Reynolds, R.T., Scott, J.M. & Nussbaum, R.A. (1980) A variable circular-plot method for estimating bird numbers. Condor, 82, 309 –313.
Richerson, P.J. & Lum, K. (1980) Patterns of plant species diver-sity in California: relation to weather and topography. The
American Naturalist, 116, 504–536.
Rohde, K. (1992) Latitudinal gradients in species diversity: the search for the primary cause. Oikos, 65, 514–527.
Rosenzweig, M.L. (1995) Species diversity in space and time. Cambridge University Press, Cambridge.
Severinghaus, L.L. (1999) Study on exotic avian species in Taiwan. Wild Birds, 7, 45–58.
Sokal, R.R. & Rohlf, F.J. (1981) Biometry: the principles and
prac-tice of statistics in biological research. W.H. Freeman, New York.
Su, H.J. (1984) Studies on the climate and vegetation types of the natural forests in Taiwan (I): analysis of the variation in climatic factors. Quarterly Journal of Chinese Forestry, 17 (3), 1–14.
Su, H.J. (1992) Vegetation of Taiwan: mountainous vegetation zone and geological climatic zone. Academia Sinica Monograph
Series 11, 39–53. Institute of Botany, Taipei .
Tognelli, M.F. & Kelt, D.A. (2004) Analysis of determinants of mammalian species richness in South America using spatial autoregressive models. Ecography, 27, 427– 436.
Tucker, C.J. (1979) Red and photographic infrared linear combi-nations for monitoring vegetation. Remote Sensing of
Environ-ment, 8, 127–150.
Ustin, S.L., Wessman, B., Curtiss, B., Lasischke, E., Way, J. & Vanderbilt, V.C. (1991) Opportunities for using the EOS imag-ing spectrometers and synthetic aperture radar in ecological models. Ecology, 72, 1934–1945.
Wang, S. (1980) Topographic landscape of Taiwan. Vacation Publications, Taipei.
Yang, Y.C. (2004) Introduction to Taiwan in the seventeenth
cen-tury: Pihai travelog. Yuan-shen Publications, Taipei.
Yeh, C.H. (1995) An exploring history of Taiwan. Tai-yuan Publi-cations, Taipei.