行政院國家科學委員會專題研究計劃成果報告
都會區大氣中超細粒徑微粒之特性探討(I)
Characterization of Ultrafine Particles in Urban Atmosphere (I)
計畫編號:NSC 89-2320-B-002-110
執行期限:88 年 8 月 1 日至 89 年 7 月 31 日
主持人 : 王秋森 台灣大學公共衛生學系
計畫參與人員 : 洪雪芬、黃 雄 台灣大學環境衛生研究所
執行單位 : 國立台灣大學公共衛生學系
中華民國 89 年 10 月 31 日
行政院國家科學委員會專題研究計劃成果報告
都會區大氣中超細粒徑微粒之特性探討(I)
Characterization of Ultrafine Particles in Urban Atmosphere (I)
計畫編號:NSC 89-2320-B-002-110 執行期限:88 年 8 月 1 日至 89 年 7 月 31 日 主持人: 王秋森 台灣大學公共衛生學系 計畫參與人員:洪雪芬、黃 雄 台灣大學環境衛生研究所 中文摘要 本研究主要目的在於測量都會區周 界大氣中超細粒徑(在本研究中定義為 dp < 0.18 µm)微粒之質量濃度,並藉由 不同地點採得之微粒樣本中有機碳與元 素碳含量及微粒質量濃度的差異,評估 汽機車排放源對都會區大氣中超細粒徑 微粒之貢獻。此外,將周界氣膠樣本製 成懸浮液,再以 dichlorofluorescin 處理, 並 測 量 其 所 產 生 之 螢 光 物 質 dichlorofluorescein 之螢光強度以探討不 同粒徑範圍之氣膠微粒上的活性含氧物 種(reactive oxygen species, 簡稱 ROS)濃 度。 研究結果顯示台北都會區周界大氣 中超細粒徑微粒質量濃度在三樓陽台、 一樓前庭、公車站、人行道以及地下道 空氣中分別為 3.5-4.9、6.5-8.8、6.4-34.5、 3.4-22.1 及 104.7-137.2 µg/m3。而含碳分 析方面,相較於三樓陽台,一樓前庭與 地下道空氣中的超細徑微粒其有機碳佔 總碳之質量分率甚高(分別為 0.86 及 0. 9),顯示愈接近汽機車排放源所採集到之 超細粒徑微粒濃度愈高,且其含碳成分 主要以有機碳為主,可見機動車輛為都 會區周界大氣中超細徑微粒之主要貢獻 源。此外,除了超細粒徑微粒外,大氣 中懸浮微粒其單位質量所含的 ROS 濃度 隨粒徑之降低而增高。此種現象與 ROS 之生成機制顯然有關,影響 ROS 含量之 因素值得進一步之探討。 Abstr act
The objective of this study was to measure the mass and number concentration, and chemical composition of ambient ultrafine particles (defined in this study as the particles with aerodynamic diameter < 0.18 µm) in an urban environment. In addition, a fluorogenic probe was used to determine the concentrations of reactive oxygen species (ROS) on particles in various particle size fractions.
The results showed that the hourly average number concentration for particles in the size range of 0.016 to 0.177 µm in a courtyard was in the range of 8.6 × 10⁴ ± 3.3 × 10⁴ particles/cm3. The mass concentration of ultrafine particles at a third-floor balcony, a first-third-floor courtyard, a bus stop, a sidewalk and in an underpass were in the ranges of 3.5~4.9, 6.5~8.8, 6.4~34.5, 3.4~22.1 and 104.7~137.2 µg/m3
, respectively. The mass fractions of organic carbon in the total carbon content of ultrafine particles collected at the first-floor courtyard and in the underpass were similar and markedly higher than those at the third-floor balcony. The data indicated that samples collected at the first-floor courtyard, which were mainly contributed from vehicular exhausts, had higher mass concentrations of ultrafine particles and the carbonaceous material was mainly organic carbon. The results imply that the vehicular exhaust is one of the most important emission sources of ultrafine 關鍵詞:超細粒徑微粒、都會氣膠、有機
particles in Taipei aerosols. Moreover, for the same mass concentrations of particles, the concentration of ROS was found to increase as the particle size decreased, except for ultrafine particles. The size dependency of ROS concentrations is clearly related to the mechanisms of ROS generation. Further studies are needed on the factors that affect the concentration of ROS on ambient aerosol particles.
Keywords: ultrafine particles, urban aerosol, organic carbon, elemental carbon, ROS
Intr oduction
Recent epidemiological studies (Schwartz et al., 1996) have indicated that the increase in mortality rate and the incidence rates of respiratory diseases and other related diseases are clearly correlated with the increase in mass concentration of ambient fine particles (smaller than 2.5 µm in aerodynamic diameter). However, the mass concentrations of particles which have been indicated by epidemiological studies to have health effects are markedly lower than the particle concentrations which have been observed to have biological toxic effects in toxicological studies. The difference between the particle concentrations which give rise to health effects and the particle concentrations which induce biological toxic effects is probably an effect of particle size. The PM2.5 concentration used in
epidemiological studies in fact covers all particles including ultrafine particles which are much smaller than 2.5 µm in aerodynamic diameter. On the other hand, the particles used in toxicological studies in the past were generally in a narrow size range between about 0.1 to 2.5 µm. More recently, toxicological studies have shown that ultrafine particles in the size range of 0.01 to 1 µm have marked biological toxic effects. For example, Oberdörster et al. (1992) showed that inflammatory responses caused by 0.02 µm TiO2 particles in alveoli
and interstices of rat lungs were greater than those observed with 0.25-µm TiO2.
Very fine (defined in this study as the
particles in the size range 0.18 <da <1 µm) and ultrafine particles mainly come from combustion processes including burning of coal and fuel oils, metal smelting, and the exhausts from diesel engines and gasoline-powered vehicles equipped with catalytic converters. Particles in diesel emissions and those generated by photochemical reactions are generally smaller than a few tenths of a micrometer in diameter. Particles in this size range have a relatively high rate, about 20~30 %, of deposition in lower lung and, as a result, toxicants in these particles can be efficiently transferred to the lungs (Friedlander and Yeh. 1998).
The primary objective of this study was to measure the mass concentration, and the carbon contents of very fine and ultrafine particles in ambient aerosols of Taipei city. In addition, the fluorescence of dichlororfluorescein (DCF) obtained by treating each sample of ambient particles with dichlororfluorescin (DCFH) was measured to determine the concentration of reactive oxygen species (ROS) on particles in various size fractions.
Results and Discussion
The results showed that the hourly average number concentration for particles in the size range of 0.016 to 0.177 µm in the courtyard was in the range of 8.6 × 10⁴ ± 3.3 × 10⁴ particles/cm3. Table 1 gives the mass concentration of ultrafine particles (dp < 0.18 µm) collected at five different locations. The mass concentration was in the range of 3.5-4.9 µg/m3
at the third-floor balcony of the Basic Medical Science Building, National Taiwan University College of Medicine and in the range of 6.9-8.8 µ g/m3
at the courtyard of the National Taiwan University College of Public Health. These two sampling sites are at least 20 meters away from main streets and therefore had lower mass concentrations of ultrafine particles. By comparison, the mass concentration was markedly higher at the Jen-Ai Road sidewalk (3.4-22.1 µg/m3) and the bus stop (6.4-34.5 µg/m3
at the Linsen South Road underpass represented a source of vehicular exhausts and therefore had the highest mass concentration of ultrafine particles (104.7-137.2 µg/m3
) among the five sampling sites. Figure 1 shows the mass concentration ratio of ultrafine particles to very fine particles at four sampling locations. The mass concentration ratio at the third-floor balcony was considerably lower than the ratio at the other three sampling locations, indicating that ultrafine particles had relatively higher mass fractions near the sources of vehicular exhausts.
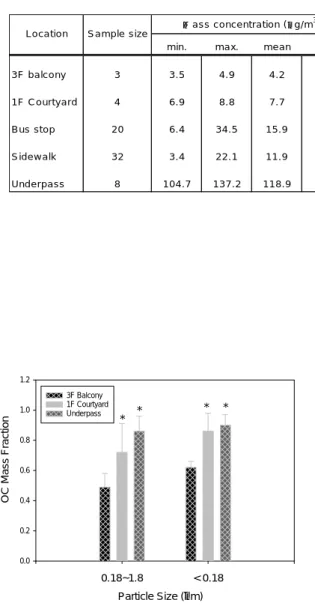
Figure 2 shows the mass fraction of organic carbon in the total carbon content of fine particles and ultrafine particles collected at three sampling sites. For both fine and ultrafine particles, the mass fraction of organic carbon at the third-floor balcony was the lowest among the three locations. The result indicates that both fine and ultrafine particles at locations away from sources of vehicular exhausts have organic carbon concentrations significantly lower than those near the sources.
Data on the fluorescence intensity of DCF were converted to equivalent hydrogen peroxide concentrations using calibration curves obtained from H2O2 assay. The
equivalent H2O2 concentration was used as
an indicator for the reactivity of ROS in a particle sample which has a fluorescence intensity identical to the H2O2 solution of the
equivalent concentration. Figure 3 shows the concentrations of ROS in ambient aerosols in different particles size fractions. The concentrations of ROS in different particle size fractions were compared using the fluorescence measurements for particle suspensions having identical mass concentration of 10 µg/ml. The concentration of ROS was found to be higher in smaller particles, except for
ultrafine particles. Even though the concentration of ROS in ambient particles is relatively low (in sub-pM levels), they are dominantly in very fine and ultrafine particles and therefore are capable of being delivered efficiently to the lower lung airways. As a consequence, very fine particles may have a greater potential to cause damage of pulmonary cells.
Self-evaluation of r esults
The goals of this study, which included measuring the mass and number concentration, and carbon content of atmospheric ultrafine particles in an urban environment, were all completed. In addition, the concentration of ROS which may trigger a cascade of free radical reactions promoting the disease process was also determined in ambient particles of different size fractions. Results of this study were presented at the 19th Annual Conference of the American Association For Aerosol Research and the 2000 European Aerosol Conference.
Refer ences
Friedlander, S. K., and Yeh, E. K., The Submicron Atmospheric Aerosol as a Carrier of Reactive Chemical Species: Case of Peroxides. Appl. Occup. Environ. Hyg., 13:416-420 (1998).
Oberdörster G., Ferin J., Gelein R.,
Soderholm S. C. and Finkelstein J. (1992), Role of the Macrophage in Lung Injury: Studies with Ultrafine Particles,
Environmental Health Perspectives, 97: 193~199.
Schwartz J., Dockery D. W. and Neas L. M. (1996), Is Daily Mortality Associated Specifically with Fine Particles? J. Air & Waste Manage. Assoc., 46: 927~939.
Table 1. The mass concentration of ultrafine particles (da < 0.18 µm) sampled at various locations in Taipei city
m in. m ax. m e an S D 3F ba lcony 3 3.5 4.9 4.2 0.7 1 F C o urty a rd 4 6.9 8.8 7.7 0.9 B us stop 20 6.4 3 4 .5 1 5 .9 7.1 S id e w a lk 32 3.4 2 2 .1 1 1 .9 4.6 Und erpass 8 104.7 137.2 118.9 1 0 .1 L o ca tio n S a m p le s ize Μ
ass c once ntration (µg/m3)
0 1
Figure 1. The mass concentration ratio of ultrafine particles (dp < 0.18 µm) to very fine particles (0.18 < dp < 1 µm) at various sampling sites. Values were mean ±SD. Asterisks indicate a significant difference (P < 0.05) from the ratios at the third floor balcony.
3F Balcony (n = 3) Underpass (n=3) Bus Stop (n=20) Sidewalk (n=9) Ma ss C o n ce n tra ti o n R a ti o * * * 0.0 0.2 0.4 0.6 0.8 1.0 1.2 3F Balcony 1F Courtyard Underpass O C M a ss F ractio n
Figure 2. The mass fraction of organic carbon (OC) in total carbon (TC) in different size intervals of particles. Values were mean ±SD. Asterisks indicate a significant difference (P < 0.05) from the fraction at the third floor balcony.
0.18~1.8 < 0.18 Particle Size (µm) * * * * 0.00 0.05 0.10 0.15 0.20 0.25 0.30 3.2~10 1~3.2 0.18~1 < 0.18 Eq u iva le n t [H 2 O2 ] ( µ M )
Particle size range (µm)
Figure 3. Equivalent hydrogen peroxide concentrations which have the same reactivities as ROS in 10 µg/ml particle suspensions. Values were mean ± SD.