國
立
交
通
大
學
機 械 工 程 學 系
碩 士 論 文
FC-72 流過一加熱面並以步階方式降低
質量流率之流動沸騰熱傳和氣泡特徵之研究
Transient Flow Boiling Heat Transfer and Associated
Bubble Characteristics of FC-72 over a Heated Plate due
to a Step Decrease in Mass Flow Rate
研 究 生:葉庭鈞
指 導 老 師:林 清 發 教授
i
FC-72 流過一加熱面並以步階方式降低
質量流率之流動沸騰熱傳和氣泡特徵之研究
研究生: 葉庭鈞 指導教授: 林清發 博士 國立交通大學機械工程學系摘要
本研究以實驗方式探討 FC-72 介電冷卻液在截面寬為 50 毫米、高 8 毫米之 水平矩形流道中於流動沸騰時進行質量流率驟降,以探討質量流率的改變如何影 響暫態強制對流沸騰熱傳及相關氣泡特徵。加熱銅板埋置於測試段之底板中央, 其長寬尺寸皆為 10 毫米。在本次實驗中,固定熱通量下,不同程度的流量下降 對暫態沸騰熱傳特性及氣泡特徵之影響將會被詳細的探討。在實驗參數上,介電 液 FC-72 之質量流率改變範圍從 300 到 160kg/m2 s,加熱通量為 1.0 到 10 W/cm2。 實驗結果發現,於流動沸騰時,隨著質量流率的下降,加熱的銅板表面壁溫 會有下降的現象。當流量改變的程度越大,壁溫下降的幅度越大。值得注意的是, 當流量驟降之後,由於測試段入口處之壓力值會隨之下降,此時測試段入口之介 電液 FC-72 溫度保持不變,而使得入口處介電液狀態由飽和態轉變為過熱態。而 實驗結果顯示,當流量改變的程度越大,所造成的入口液體過熱度亦越大。除此 之外,隨著質量流率的下降,加熱銅板表面氣泡的脫離直徑及成核址密度會隨著 時間遞增,而氣泡的脫離頻率則隨著時間遞減。由於氣泡特徵的改變所造成之潛 熱熱傳量的增加,最終導致加熱表面壁溫下降的結果。我們亦觀察到當流量改變 的程度越大,對氣泡特徵改變的程度也越大。
ii
Transient Flow Boiling Heat Transfer and Associated
Bubble Characteristics of FC-72 over a Heated Plate due
to a Step Degrease in Mass Flow Rate
Student: TING-CHUN YEH Advisor: Prof. Tsing-Fa Lin
Institute of Mechanical Engineering
National Chiao Tung University
ABSTRACT
An experiment is carried out in the present study to investigate transient flow boiling heat transfer and associated bubble characteristics for coolant FC-72 flowing over a small heated copper plate flush mounted on the bottom of a horizontal rectangular channel due to a step decrease in the coolant mass flow rate. In the experiment, the effects of the levels of the step change in the coolant mass flux and imposed heat flux on the time variations of the measured transient flow boiling heat transfer and bubble characteristics are examined in detail. During the tests, the coolant mass flux G ranges from 300 to 160 kg/m2s for the imposed heat flux q varied from 1.0 to 10 W/cm2.
The experimental results show that the heated surface temperature decreases with time following a reduction in the coolant mass flux in the transient flow boiling. The effect is more pronounced for a larger reduction in G. Besides, it is noted in the transient flow that the inlet liquid condition changes from a saturated state to a superheated state during the mass flux reduction because of the associated drop in the
iii
inlet pressure. Moreover, a larger reduction of the coolant mass flux results in a larger increase in the inlet liquid superheating. Furthermore, as the coolant mass flux reduces with time both the size of the departing bubbles and active nucleation site density increase, but the bubble departure frequency decreases. This results in an increase in latent heat transfer due to the mass flux reduction and hence a drop in the heated surface temperature. We also note that a larger increase in the inlet liquid superheating causes stronger changes in these quantities.
iv
CONTENTS
ABSTRACT (CHINESE) i ABSTRACT (ENGLISH) ii CONTENTS iv LIST OF TABLES viLIST OF FIGURES vii
NOMENCLATURE xi
CHAPTER 1 INTRODUCTION 1
1.1 Motivation of the Present Study 1
1.2 Literature Review 2
1.2.1 Stable Single-Phase and Convective Boiling Heat Transfer 2
1.2.2 Transient single-phase forced convection heat transfer 4
1.2.3 Transient flow boiling heat transfer 5
1.2.4 Bubble Characteristics 7
1.3 Objective of This Study 9
CHAPTER 2 EXPERIMENTAL APPARATUS AND PROCEDURES 13
2.1 Degassing Unit 13
v
2.3 Test Section 15
2.4 Hot-water Loop 16
2.5 Cold-water Loop 16
2.6 Programmable DC Power Supply 16
2.7 Data Acquisition 17
2.8 Optical Measurement Technique 17
2.9 Experimental Procedures 18
2.10 Experimental Parameters 19
CHAPTER 3 DATA REDUCTION 27
3.1 Flow Boiling Heat Transfer Coefficient 27
3.2 Flow Boiling Bubble Characteristics 29
3.3 Uncertainty Analysis 30
CHAPTER 4 TRANSIENT FLOW BOILONG OF FC-72 OVER A SMALL HEATED COPPER PLATE DUE TO A
STEP CHANGE IN MASS FLOW RATE 32
4.1 Single-phase Liquid Convective Heat Transfer 33
4.2 Transient Flow Boiling Heat Transfer Characteristics 33
4.3 Transient Bubble Characteristics in Flow Boiling 36
CHAPTER 5 CONCLUDING REMARKS 69
vi
LIST OF TABLES
Table 1.1 Thermodynamic properties for FC-72 11
Table 1.2 Some single-phase convection heat transfer corrections for
electronics cooling 12
Table 2.1 Experimental Parameters 20
Table 2.2 Thermodynamic and transport properties of the dielectric coolant
FC-72 21
vii
LIST OF FIGURES
Experiment Apparatus
Fig. 2.1 Schematic diagram of experimental apparatus 22
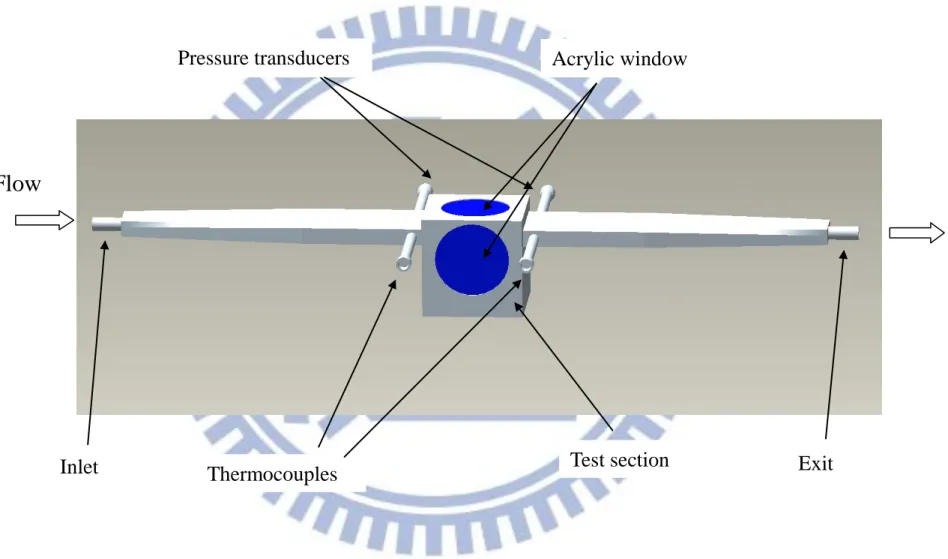
Fig. 2.2 Three dimensional plots of test section along with inlet and
outlet section 23
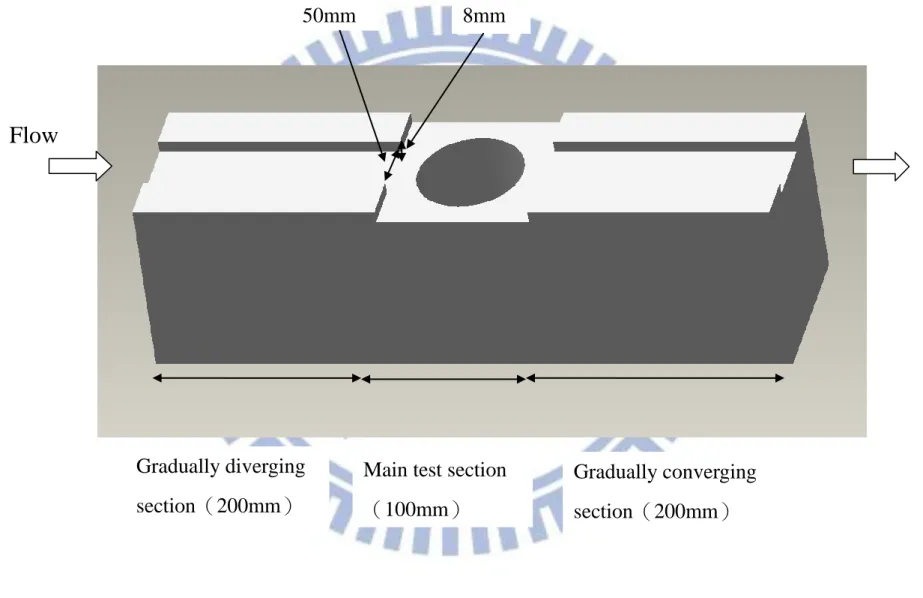
Fig. 2.3 Three-dimensional plots of the test section in rectangular
flow channel 24
Fig. 2.4 Three-dimensional pictures showing Cylindrical Peek block
and Cylindrical Peek bolt 25
Fig. 2.5 Locations of thermocouple 26
TRANSIENT FLOW BOILING
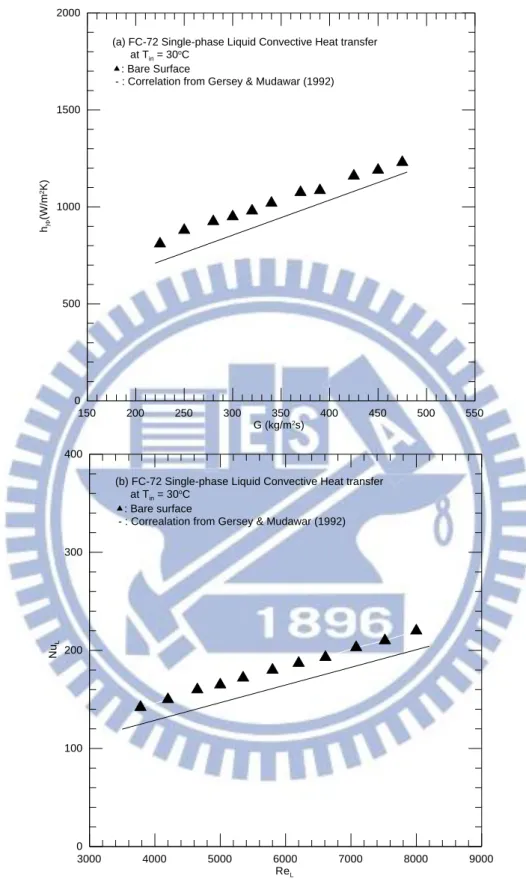
Fig. 4.1 Comparison of the present steady single-phase liquid convection heat transfer data with the correlation of Gersey and Mudawar (1992) for(a)h1ψvs. G and (b) NuL vs. ReL 39
Fig. 4.2 Time variations of (a) inlet temperature, (b) inlet pressure and (c) heated surface temperature (d) heat transfer coefficient following a reduction in the FC-72 mass flux from 300 to 250 kg/m2s at t = 0 with Tin = Tsat = 55℃ and at t→∞, Tin = 55
℃ and Tsat = 54.3℃. 40
Fig. 4.3 Time variations of (a) inlet temperature, (b) inlet pressure and (c) heated surface temperature (d) heat transfer coefficient following a reduction in the FC-72 mass flux from 300 to 200 kg/m2s at t = 0 with Tin = Tsat = 55℃ and at t→∞, Tin = 55
℃ and Tsat = 53.9℃ 41
Fig. 4.4 Time variations of (a) inlet temperature, (b) inlet pressure and (c) heated surface temperature (d) heat transfer coefficient following a reduction in the FC-72 mass flux from 300 to 160 kg/m2s at t = 0 with Tin = Tsat = 55℃ and at t→∞, Tin = 55
℃ and Tsat = 53.3℃ 42
Fig. 4.5 Time variations of (a) heated surface temperature and (b) heat transfer coefficient following FC-72 mass flux reduced to different levels for Tin = 55oC, Tsat = 55oC and q = 5W/cm2 at
viii
Fig. 4.6 Time variations of (a) inlet temperature, (b) inlet pressure and (c) heated surface temperature (d) heat transfer coefficient following a reduction in the FC-72 mass flux from 200 to 160 kg/m2s at t = 0 with Tin = Tsat = 55℃ and at t→∞, Tin = 55
℃ and Tsat = 54.1℃. 44
Fig. 4.7 Time variations of (a) inlet temperature, (b) inlet pressure and (c) heated surface temperature (d) heat transfer coefficient following a reduction in the FC-72 mass flux from 250 to 160 kg/m2s at t = 0 with Tin = Tsat = 55℃ and at t→∞, Tin = 55
℃ and Tsat = 53.9℃. 45
Fig. 4.8 Comparison of the measured data for h2φ/h2φ,0 with the
proposed correlation. 46
Fig. 4.9 Modified boiling curves showing variation of surface heat flux with modified wall superheat for different inlet liquid superheats in stable flow boiling of FC-72 at G = 250 kg/m2s
and Tsat = 54.3℃. (△Tw = Tw – Tin). 47
Fig. 4.10 Modified boiling curves showing variation of surface heat flux with modified wall superheat for different inlet liquid superheats in stable flow boiling of FC-72 at G = 200 kg/m2s
and Tsat = 53.9℃. (△Tw = Tw – Tin). 48
Fig. 4.11 Modified boiling curves showing variation of surface heat flux with modified wall superheat for different inlet liquid superheats in stable flow boiling of FC-72 at G = 160 kg/m2s
and Tsat = 53.3℃. (△Tw = Tw – Tin). 49
Fig. 4.12 Modified boiling curves showing variation of surface heat flux with modified wall superheat for different inlet liquid superheats in stable flow boiling of FC-72 at G = 160 kg/m2s
and Tsat = 53.9℃. (△Tw = Tw – Tin). 50
Fig. 4.13 Modified boiling curves showing variation of surface heat flux with modified wall superheat for different inlet liquid superheats in stable flow boiling of FC-72 at G = 160 kg/m2s
and Tsat = 54.1℃. (△Tw = Tw – Tin). 51
Fig. 4.14 Comparison of the measured data for heat transfer in the transient flow boiling of FC-72 with the proposed correlation. 52 Fig. 4.15 Photos of transient flow boiling flow at selected time instants
following FC-72 mass flux reduced from 300 to 250 kg/m2s for q = 3W/cm2. Initially, Tin = Tsat = 55℃ and at t→∞, Tin
ix
Fig. 4.16 Photos of transient flow boiling flow at selected time instants following FC-72 mass flux reduced from 300 to 200 kg/m2s for q = 4W/cm2. Initially, Tin = Tsat = 55℃ and at t→∞, Tin
= 55℃and Tsat = 53.9℃. 54
Fig. 4.17 Photos of transient flow boiling flow at selected time instants following FC-72 mass flux reduced from 300 to 160 kg/m2s for q = 3W/cm2. Initially, Tin = Tsat =55℃ and at t→∞, Tin =
55℃and Tsat = 53.3℃. 55
Fig. 4.18 Photos of transient flow boiling flow at selected time instants following FC-72 mass flux reduced from 250 to 160 kg/m2s for q = 4W/cm2. Initially, Tin = Tsat = 55℃ and at t→∞, Tin
= 55℃and Tsat = 53.9℃. 56
Fig. 4.19 Photos of transient flow boiling flow at selected time instants following FC-72 mass flux reduced from 200 to 160 kg/m2s for q = 4W/cm2. Initially, Tin = Tsat = 55℃ and at t→∞, Tin
= 55℃and Tsat = 54.1℃ 57
Fig. 4.20 Time variations of bubble departure diameter (a) and frequency (b) and active nucleation site density (c) following a reduction of FC-72 mass flux from 300 to 250kg/m2s in transient flow boiling for various imposed heat fluxes. 58 Fig. 4.21 Time variations of bubble departure diameter (a) and
frequency (b) and active nucleation site density (c) following a reduction of FC-72 mass flux from 300 to 200kg/m2s in transient flow boiling for various imposed heat fluxes. 59 Fig. 4.22 Time variations of bubble departure diameter (a) and
frequency (b) and active nucleation site density (c) following a reduction of FC-72 mass flux from 300 to 160kg/m2s in transient flow boiling for various imposed heat fluxes. 60 Fig. 4.23 Time variations of bubble departure diameter (a) and
frequency (b) and active nucleation site density (c) following a reduction of FC-72 mass flux from 250 to 160kg/m2s in transient flow boiling for various imposed heat fluxes. 61 Fig. 4.24 Time variations of bubble departure diameter (a) and
frequency (b) and active nucleation site density (c) following a reduction of FC-72 mass flux from 200 to 160kg/m2s in transient flow boiling for various imposed heat fluxes.
62 Fig. 4.25 Time variations of (a) bubble departure diameter (b) bubble
x
following FC-72 mass flux reduced to different levels for Tin
= 55oC, Tsat = 55oC and q = 5W/cm2 at t= 0.
63 Fig. 4.26 Variations of bubble departure diameter(a), bubble departure
frequency(b) and active nucleation site density(c) with imposed heat fluxes at different inlet liquid temperatures in stable flow boiling of FC-72 at G = 250kg/m2s and Tsat =
54.3℃.
64 Fig. 4.27 Variations of bubble departure diameter(a), bubble departure
frequency(b) and active nucleation site density(c) with imposed heat fluxes at different inlet liquid temperatures in stable flow boiling of FC-72 at G = 200kg/m2s and Tsat =
53.9℃. 65
Fig. 4.28 Variations of bubble departure diameter(a), bubble departure frequency(b) and active nucleation site density(c) with imposed heat fluxes at different inlet liquid temperatures in stable flow boiling of FC-72 at G = 160kg/m2s and Tsat =
53.3℃. 66
Fig. 4.29 Variations of bubble departure diameter(a), bubble departure frequency(b) and active nucleation site density(c) with imposed heat fluxes at different inlet liquid temperatures in stable flow boiling of FC-72 at G = 160kg/m2s and Tsat =
53.9℃. 67
Fig. 4.30 Variations of bubble departure diameter(a), bubble departure frequency(b) and active nucleation site density(c) with imposed heat fluxes at different inlet liquid temperatures in stable flow boiling of FC-72 at G = 160kg/m2s and Tsat =
xi
NOMENCLATURE
A area, m2
Bo Boiling number, Bo=q/(G.ilv), dimensionless
cp specific heat, J/kg℃
Dh hydraulic diameter of rectangular-channel, m
dp bubble departure diameter, m
f bubble departure frequency
G mass flux, kg/m2s
g acceleration due to gravity, m/s2
H channel height, m
h heat transfer coefficient, W/m2℃
l vertical distance, m
I measured current from DC power supply, A
ilv enthalpy of vaporization, J/kg.K
k thermal conductivity, W/m℃
L plate length, mm
ṁ mass flow rate, kg/s
xii
nb number of departing bubbles
ns number of nucleation sites
N number
Nu Nusselt number,Nu= hDh/kL, dimensionless
Nsup Superheated number, Nsup = (CpL.△Tsup/ilv).(vlv/vL)
P system pressure, kpa
Pr Prandtl number, Pr =μ‧Cp/k , dimensionless
Q power input, W
q average imposed heat flux, W/cm2 ReL liquid Reynolds number, ReL= G‧L/μL,
tb time period, s
T temperature,℃
𝜈 specific volume V coolant (FC-72) flow velocity, m/s, or voltage drop, V
W width, m
Greek Symbols
α thermal diffusion coefficient, m2/s
xiii
ΔT temperature difference, ℃
ρ density, kg/m3
ε relative heat loss, dimensionless
μ dynamic viscosity, kg/m.s σ surface tension, N/m Subscripts ave average b bottom cu copper cp copper plate d diameter e electric heater h hydraulic
in at the inlet of the test section
L liquid
lv liquid phase to vapor phase
n net power input to the coolant FC-72
out at the outlet of the test section
xiv
r coolant FC-72
s side surface
sat saturated flow boiling
sp Single-phase convective heat transfer
t total v vapor w wall 1Φ single-phase liquid 2Φ two-phase boiling 0 initial value at t = 0
1
CHAPTER 1
INTRODUCTION
1.1 Motivation of the Present Study
Significant progress in IC (integrated circuit) technology in recent years allows us to greatly increase component density in IC chips to enhance their performance. As electronic devices become smaller, the power dissipation density in them increases substantially. It is also well known that the junction temperature of IC must be kept under 85℃ to maintain its normal operation [1].The heat removal method based on gas cooling is usually not sufficiently effective for devices containing high heat generation components. Besides, the use of the direct liquid cooled method is known to produce good results for high power density devices encountered in advanced CPU. Furthermore, the two-phase flow boiling is one of the most effective cooling methods because latent heat transfer involved in the process. In employing liquid boiling in electronics cooling, the coolants must be chemically stable, inert, and dielectric. The coolant FC-72, a fluorocarbon liquid manufactured by the 3M Company, meets the above requirements and its boiling point is appropriate for electronics cooling. Some thermophysical properties for FC-72 are listed in Table 1.1. Moreover, it is worth noting that the power dissipation in IC chips is also time dependent in practical operation. Therefore the coolant flow rate must be varied in time to meet the required time varying cooling load. Consequently, a detailed understanding of the phase-change processes subject to the time varying coolant flow rate and imposed heat flux is essential in thermal design for electronics cooling. Although considerable research has been carried out in the past for the two-phase flow and heat transfer
2
under the condition of fixed flow rate and imposed heat flux, the corresponding research for the transient flow rate and imposed heat flux remains largely unexplored. In the present study an initial attempt is made to unravel how the characteristics of FC-72 flow boiling heat transfer and bubble motion in a channel are affected by the time varying coolant flow rate for a constant imposed heat flux.
1.2 Literature Review
In what follows the literature relevant to the present study is reviewed, particularly on using dielectric liquids for cooling of electronic equipments.
1.2.1 Stable Single-Phase and Convective Boiling Heat Transfer
Investigation of refrigerants R-113 and FC-72 single-phase and subcooled flow boiling heat transfer from a small heated patch was carried out by Samant and Simon [2]. They combined the single-phase experimental data to develop an empirical correlation. In the subcooled boiling of FC-72 they noted large temperature excursions at the onset of nucleate boiling and hence a boiling hysteresis near the onset of nucleate boiling. Besides, in the nucleate boiling region the slope of the boiling curve increases with the coolant flow velocity. Garimella and Eibeck [3] analyzed heat transfer characteristics for an array of protruding elements in single-phase forced convection of water for the channel Reynolds number ranging from 150 to 5,150. The heat transfer coefficient was found to decrease at decreasing Reynolds number and at increasing ratio of the channel height to element height. Incropera et al. [4] experimentally investigated single-phase convective heat transfer from a single heat source and four-row arrays of 12 discrete heat sources flush-mounted in a horizontal rectangular channel. The working fluids they used were water and FC-77 for the channel Reynolds number ranging from 1,000 to 14,000.
3
They developed a model to predict the relation between the Reynolds number and Nusselt number for the turbulent flow regime. Unfortunately, their measured data were significantly under-predicted in the laminar flow regime. Slightly later, Incropera et al. [5, 6] examined single-phase liquid convection and flow boiling of water and FC-72 in a horizontal rectangular channel with a 1×10 array flush mounted discrete heat sources. They found in the single-phase forced convection experiment that when the Reynolds number is raised from a very low value to a very high value, the resulting flow regimes included laminar mixed convection, transition from laminar mixed convection to laminar forced convection, laminar forced convection, transition from laminar forced convection to turbulent forced convection, and turbulent forced convection. Besides, they defined the wall temperature overshoot at the boiling inception as the constant heat flux temperature difference between the maximum temperature recorded under the single-phase convection condition and the corresponding theoretical temperature under boiling conditions. According to their experimental results, increasing flow velocity and heat flux causes a smaller temperature overshoot.
Mudawar and Maddox [7] investigated critical heat flux for FC-72 boiling over a single heat source flush mounted on one wall of a vertical rectangular channel. An increase in the channel pressure drop and a decrease in the critical heat flux were noted at increasing void fraction. In a continuing study Mudawar et al. [8, 9] experimentally examined flow boiling of FC-72 over flush-mounted heat sources. The multi-heat sources in the vertical flow channel were arranged in a 1 × 9 array for the flow velocity ranging from 13 to 400 cm/s and for the liquid subcooling from 3℃ to 36℃ with the system pressure at 1.36 bar. They observed that increases in the flow velocity and subcooling resulted in a delay in the incipence of nucleate boiling and an
4
increase in the critical heat flux. Besides, they proposed an empirical correlation for the heat transfer coefficient measured in the single-phase region. The chip surface temperature was noted to increase slightly at decreasing velocity, and the result was opposite to that of Tso et al. [10]. Yun et al. [11] investigated flow boiling heat transfer of carbon dioxide in mini tubes and noted that the effects of heat flux on the heat transfer coefficient before critical vapor quality were strong at all mass flux. Besides, when the mass flux is less than 500 kg/m2s, the effects of the mass flux on
the heat transfer coefficient before the critical quality are significant.
The single-phase heat transfer correlations proposed in the above studies are given in Table 1.2.
1.2.2 Transient single-phase forced convection heat transfer
Investigation of transient single-phase forced convection in a horizontal plane channel with different time varying imposed heat fluxes on the channel walls was carried out by Girault and Petit [12]. On the top plate the imposed heat flux varies like a square wave. While on the bottom plate the imposed heat flux is like a sinusoidal wave. During the power-on both the top and bottom plate temperatures were found to vary smoothly. There is a small wall temperature oscillation for the power-off situation. This is considered to result from the existence of internal energy in the channel walls even when the power is turned off. Bhowmik and Tou [13, 14] performed an experiment to study transient FC-72 forced convection heat transfer from a four-in-line chip module that is flush-mounted onto one wall of a vertical rectangular channel. The Reynolds number based on the heat source length ranges from 800 to 2,625 for the heat flux varying from 1 to 7 W/cm2. Their data suggest that
5
importance in the thermal systems during the power-on and power-off periods. Besides, the heat transfer coefficient was noted to be affected strongly by the number of chips. In a similar experiment [15] they investigated the transient heat transfer characteristics from an array of 4 x 1 flush mounted simulated electronic chips using water as the working fluid during the power-off periods. The Reynolds number based on the heat source length ranges from 1,050 to 2,625. The transient heat transfer regime in a period of 75 seconds after the heater power is cut-off was examined. They observed that the Nusselt numbers of the four chips at the beginning of the power-off were close but then they diverged with time. However, the Nusselt number increases with time, due to the chip wall temperature decrease with time. When compared with water, an overall increase of 70% in the Nusselt number is obtained by using FC-72.
1.2.3 Transient flow boiling heat transfer
Kataoka et al. [16] investigated transient flow boiling of water over a platinum wire subject to an exponentially increasing heat input. The wire diameter and length respectively vary from 0.8 to 1.5 mm and from 3.93 to 10.4 cm. Two types of transient boiling were observed. In A-type boiling (heating period is 20ms, 50ms, or 10s), the transient maximum critical heat flux increases with decreasing period at constant flow velocity. Whereas, in the B-type boiling (heating period is 5ms, 10ms, or 14ms), the transient maximum heat flux decreases first with the period and then increases. Two-phase flow and heat transfer in a small tube of 1mm internal diameter using R-141b as the working fluid were studied by Lin et al. [17]. At a low heat flux, a relatively constant wall temperature was obtained. Besides, forced convection evaporation occured towards the outlet end of the tube and the fluctuations in the wall temperature were small. With a high heat flux, significant fluctuation in wall
6
temperature was observed. This is caused by a combination of time varying heat transfer coefficient and time varying local pressure and fluid saturation temperature.
Two-phase flow instabilities in flow boiling of various liquids in long heated channels have been recognized for several decades [18, 19]. On certain operating conditions significant temporal oscillations in pressure, temperature, mass flux and boiling onset appear. Recently, some detailed characteristics associated with these instabilities were explored through experimental measurement and theoretical modeling. Specifically in flow boiling of refrigerant R-11 in a vertical channel, the pressure drop and thermal oscillations were observed by Kakac et al. [20]. Meanwhile, a two-phase homogeneous model combined with thermodynamic equilibrium assumption was used to predict the conditions leading to the thermal oscillation. Besides, they also predicted the periods and amplitudes of the oscillations, which were in good agreement with their measured data. Slightly later, Kakac and his colleagues [21] further noted the presence of density-wave oscillation superimposed on the pressure-drop oscillations. Moreover, the drift-flux model was employed in their numerical prediction. In a continuing study for R-11 in a horizontal tube of 106 cm long [22], the research group led by Kakac examined the dependence of the oscillation amplitude and period on the system parameters and located the boundaries of various oscillations on steady-state pressure drop vs. mass flux characteristic curves. A similar experimental study was carried out by Comakli et al. [23] for a longer tube (L=319.5 cm). They showed that the channel length had an important effect on the two-phase flow dynamic instabilities.
Analysis of dynamic behavior of a horizontal boiling channel connected with a surge tank for liquid supply also receives some attention. Mawasha and Gross [24] used a constitutive model containing a cubic nonlinearity combined with a
7
homogeneous two-phase flow model to simulate the pressure-drop oscillation. The prediction is in qualitative agreement with measured data. Later, the effects of the channel wall heat capacity are included in their analysis [25] to allow the wall temperature and heat transfer coefficient to vary with time.
The boiling onset in a upward flow of subcooled water in a vertical tube of 7.8 m long connected with a liquid surge tank was noted by Wang et al. [26] to cause substantial flow pressure and density-wave oscillations. These boiling onset oscillations were attributed to a sudden increase of pressure drop across the channel and a large change in the water flow rate at the onset of nucleate boiling, which resulted in the feedback of the pressure drop and flow rate by the system and caused the boiling onset location to move in and out of the channel. Therefore, strong flow oscillations are induced in the channel.
Aside from the boiling instabilities in conventional channels, pressure-drop oscillations of n-pentane liquid in a vertical small rectangular channel (Dh = 0.889
mm and L=50 & 200 mm) were reported recently by Brutin et al. [27]. Besides, a non-stationary state of two-phase flow was observed. The effects of the inlet flow conditions on the boiling instabilities were found to be relatively significant [28]. A similar study for subcooled flow boiling of deionized water was conducted by Shuai et al. [29] and the pressure-drop oscillations were also noted.
1.2.4 Bubble Characteristics
Literature relevant to bubble characteristics in boiling flow is briefly reviewed. A recent experiment conducted by Chang et al. [30] focused on the behavior of near-wall bubbles in subcooled flow boiling of water. The population of the near-wall bubbles was found to increase with the increase in the heat flux and in the superheated
8
liquid layer very small bubbles were noted to attach on the heated wall. In addition, the coalesced bubbles are smaller for a higher mass flux of the flow. In a recent experiment Bang et al. [31] examined boiling of R-134a in a vertical rectangular channel focusing on the characteristic structures in the near-wall region. They noted the presence of the vapor remants below the discrete bubbles and coalesced bubbles and the presence of an interleaved liquid layer between the vapor remants and bubbles. Besides, the bubble layer was divided into two types, a near-wall bubble layer dominated by small bubbles and a following bubble layer prevailed by large coalesced bubbles. Kandlikar [32] examined the subcooled flow boiling for water in a rectangular horizontal channel. They concluded that the bubble growth was slow at high subcooling and the bubble departure diameter decreased as the flow rate increased.
By using optical measurement techniques, Maurus et al. [33, 34] examined the bubble distribution and local void fraction in subcooled flow boiling of water at atmospheric pressure. They reported that the bubble size increased with an increase in the heat flux but reduced with an increase in the mass flux. The total bubble life time, the remaining lifetime after the detachment process and the waiting time between two bubble cycles decreased significantly as the mass flux increased. In a recent study Maurus and Sattelmayer [35] further defined the bubbly region by the ratio of the averaged phase boundary velocity to the averaged fluid velocity. On the other hand, an experimental analysis was carried out by Thorncroft et al. [36] to investigate the vapor bubble growth and departure in vertical upflow and downflow boiling of FC-87. They found that the bubble growth rate and bubble departure diameter increased with the Jacob number (increasing ΔTsat) and decreased at increasing mass flux in both
9
site in vertical upflow tube boiling were investigated by Okawa et al. [37-39]. They noted that the inertia force had a significant influence on the onset of detachment but the influence was gradually reduced with time. They also observed three different bubble rise paths after the departure from nucleation sites. Specifically, some bubbles slide upward along the vertical wall, some bubbles detach from the wall after sliding, and other bubbles remain close to the wall and reattach to the wall. Forced convection boiling experiments conducted by Situ et al. [40, 41] for water in a vertical annular channel revealed that the bubble departure frequency increased as the heat flux increased. Moreover, the bubble lift-off diameter increases at increasing inlet temperature and heat flux. In addition, Yin et al. [42] examined subcooled flow boiling of R-134a in a horizontal annular duct and noted that both the bubble departure size and frequency reduced at increasing liquid subcooling. They found that only the liquid subcooling showed a large effect on the bubble size.
1.3 Objective of This Study
The above literature review clearly indicates that the two-phase flow instabilities in the boiling of liquids in a long heated channel have received considerable attention. However, the unstable characteristics of flow boiling heat transfer and associated bubble behavior in a channel subject to imposed time varying flow rate and heat flux remain largely unexplored. In this study, an experimental study will be carried out to explore how a step decrease in the mass flow rate affects the transient boiling heat transfer and associated bubble characteristics of FC-72 flow over a small heated plate flush mounted on a horizontal rectangular channel with a constant imposed heat flux. In the experiment, initially saturated flow boiling of FC-72 at given constant pressure, mass flow rate and heat flux prevails in the channel. Then the FC-72 mass flux is
10
lowered suddenly to another constant level by reducing the inlet FC-72 pressure. The effects of the change in the mass flux of FC-72 on the transient boiling heat transfer characteristics following the coolant mass flux reduction will be examined in detail. Besides, flow visualization is conducted here to unravel some time varying bubble characteristics associated with the transient flow boiling such as the bubble departure diameter, departure frequency and active nucleation site density to improve our understanding of the transient flow boiling processes in the channel.
11
Table 1.1 Thermodynamic properties for FC-72.
Properties
FC-72
Appearance Clear, colorless
Average Molecular Weight 338
Boiling Point (1 atm) 55.7℃
Pour Point -90℃
Estimated Critical Temperature 449K
Estimated Critical Pressure 1.83 × 10⁶pascals
Vapor Pressure 30.9 × 10³pascals
Latent Heat of Vaporization (at normal boiling point) 88 J/g
Liquid Density 1680 kg/m3
Kinematic Viscosity 0.38 centistokes
Absolute Viscosity 0.64 centipoise
Liquid Specific Heat 1100 J kg-1C-1
Liquid Thermal Conductivity 0.057 W m-1℃-1
Coefficient of Expansion 0.00156℃-1
Surface Tension 10 dynes/cm
Refractive Index 1.251
Water Solubility 10 ppmw
Solubility in Water <5 ppmw
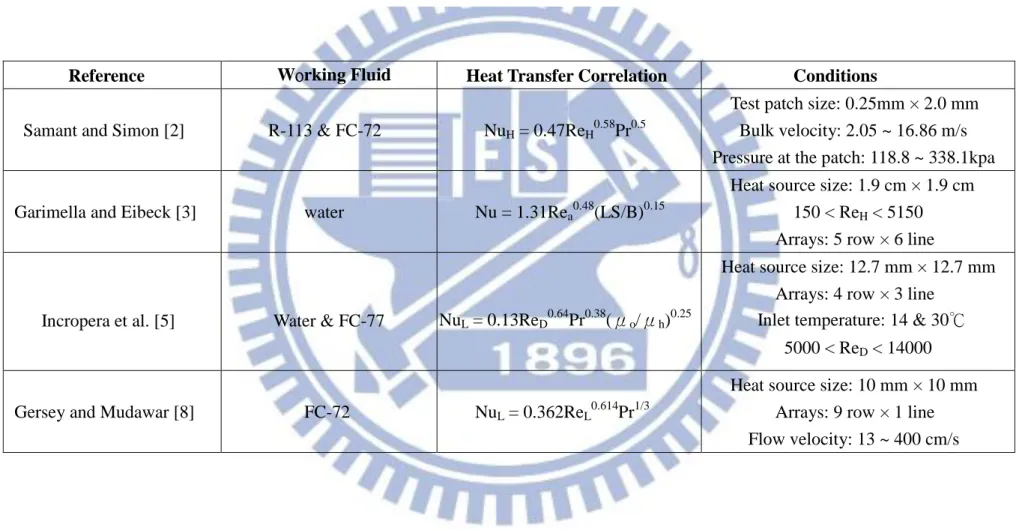
Reference Working Fluid Heat Transfer Correlation Conditions
Samant and Simon [2] R-113 & FC-72 NuH = 0.47ReH0.58Pr0.5
Test patch size: 0.25mm × 2.0 mm Bulk velocity: 2.05 ~ 16.86 m/s Pressure at the patch: 118.8 ~ 338.1kpa
Garimella and Eibeck [3] water Nu = 1.31Rea0.48(LS/B)0.15
Heat source size: 1.9 cm × 1.9 cm 150 < ReH < 5150
Arrays: 5 row × 6 line
Incropera et al. [5] Water & FC-77 NuL = 0.13ReD0.64Pr0.38(μo/μh)0.25
Heat source size: 12.7 mm × 12.7 mm Arrays: 4 row × 3 line
Inlet temperature: 14 & 30℃ 5000 < ReD < 14000
Gersey and Mudawar [8]
FC-72 NuL = 0.362ReL0.614Pr1/3
Heat source size: 10 mm × 10 mm Arrays: 9 row × 1 line Flow velocity: 13 ~ 400 cm/s
Table 1.2 Some single-phase convection heat transfer corrections for electronics cooling. Table 1.2 Some single-phase convection heat transfer corrections for electronics cooling. Table 1.2 Some single-phase convection heat transfer corrections for electronics cooling. Table 1.2 Some single-phase convection heat transfer corrections for electronics cooling.
13
CHAPTER 2
EXPERIMENTAL APPARATUS AND PROCEDURES
The experimental system established in the present study to investigate the transient flow boiling heat transfer of the dielectric coolant FC-72 over a small heated copper plate flush mounted on the bottom of a horizontal rectangular channel is depicted schematically in Fig. 2.1. This system includes four major parts, namely, a degassing unit, a coolant loop, a hot-water loop, and a cold water loop. The test section along with the entrance and exit sections are shown in Fig. 2.2 by three- dimensional plots. The liquid coolant FC-72 is driven by a gear pump and the inlet temperature of the coolant is regulated by a pre-heater with a hot water circulation in it. The coolant vapor generated during boiling in the test section is then condensed in a condenser cooled by another water thermostat and then returns to a receiver. The details of each part in the experimental system are described in the following.
2.1 Degassing Unit
Since any non-condensable gases dissolved in the coolant FC-72 can significantly affect the heat transfer performance and nucleate boiling phenomena, we must degas the coolant before conducting the experiments. After each charge of the coolant or re-arrangement of the piping system, the coolant must be degassed. The degassing unit consists of a 8-liter tank patched with a flexible electric heater on its inside surface to heat the coolant to its boiling point. During the degassing process, air and any other non-condensable gases dissolved in the coolant escape from the liquid FC-72 in the tank and pass through the released valve on the top of the tank. Besides, a pressure transducer and a thermocouple are equipped in the tank to measure the
14
pressure and temperature of FC-72.
2.2 Coolant Loop
After degassing the coolant FC-72, we remove non-condensable gases possibly existing in the coolant-loop by running a vacuum pump and then fill the degassed FC-72 liquid into the coolant-loop. The coolant loop is composed of a variable-speed gear pump, a filter, a volume flow meter, a pre-heater, a test section including the inlet and outlet sections, a condenser, and a receiver. The magnetic gear pump includes an AC motor, a pump head and a controller. The coolant flow rate is controlled by the AC motor through setting the inverter frequency of the controller. Besides, the coolant flow rate can be further adjusted by regulating a bypass valve.
The coolant FC-72 at the outlet of the magnetic micro-pump must be kept subcooled to avoid any vapor flow through the volume flow meter. The pre-heater is used to heat the subcooled coolant FC-72 to a preset subcooled or saturated temperature at the test section inlet by receiving heat from the hot water in the hot-water loop. Finally, vapor-liquid coolant mixture is generated in the test section when the coolant flows over the heated copper plate. The vapor flow leaving the test section is then re-liquefied by the condenser in the cold-water loop.
After leaving the condenser, the liquid FC-72 flows back to the receiver at the bottom of the system. An accumulator is connected to a high-pressure nitrogen tank to dampen the fluctuations of the coolant flow rate and pressure. The filter is employed to remove the impurities and non-condensable gases possibly existing in the loop. Varying the temperature and flow rate of the hot-water flowing through the pre-heater allows us to control the pressure of the coolant loop. Two absolute pressure transducers are installed at the inlet and outlet of the test section with a resolution up to ± 2kPa. All the refrigerant and water temperatures are measured by calibrated
15
copper-constantan thermocouples (T-type) with a calibrated accuracy of ±0.2℃. The test section is thermally insulated with a polyethylene insulation layer so that heat loss from it can be reduced significantly.
2.3 Test Section
The test section mainly consists of a square copper plate flush mounted on the bottom of the horizontal rectangular channel. The rectangular flow-channel includes a gradually diverging section, the main test section, and a gradually converging section (Fig. 2.3). They are all made of stainless steel plate. The installation of the inlet and exit sections intends to avoid the sudden change in the cross section of the channel. The test section is 50 mm in width, 8 mm in height, and 200 mm in length. Hence the aspect ratio of the test section is 6.25. The heated plate is placed around the geometric center of the bottom plate of the test section. A ladder-shaped acrylic window is installed on the upper lid and lateral side of the test section right around the heated plate.The temperature and pressure of the FC-72 flow at the inlet and exit of the test section are measured by the calibrated thermocouples and pressure transducers, as schematically shown in Fig. 2.2.
The copper plate module schematically shown in Figs. 2.4 and 2.5 includes a hollow cylindrical Peek block, a cylindrical Peek bolt, a copper plate, and a electric-heater. The copper plate is 10-mm long and 2-mm thick and it is heated by passing DC current through the electric-heater. Also, four thermocouples are fixed at the back surface of the copper plate to estimate the temperature of the upper surface of the copper plate and another two thermocouples are fixed at the top and bottom surfaces of the electric-heater to measure their surface temperatures. The locations of the thermocouples at the backside of the copper plate and at the electric-heater surface are shown in Fig. 2.5.
16
2.4 Hot-water Loop
In order to maintain the dielectric coolant FC-72 at the preset temperature at the test section inlet, a hot-water loop is used to preheat the coolant before it arrives at the test section inlet. The hot-water loop for the pre-heater includes a thermostat with a 20-liter hot water container and a 2-kW heater in it, and a 0.5-hp water pump which can drive the hot water at a specified flow rate to the pre-heater. Besides, a bypass valve in the loop can further adjust the water flow rate. The hot water passes through the container while the liquid coolant FC-72 flows through the inner coiled pipe in the pre-heater. The connecting pipe between the pre-heater and test section is thermally insulated with a 5-cm thick polyethylene layer to reduce the heat loss from the pipe.
2.5 Cold-water Loop
The cold-water loop is designed for condensing the liquid-vapor mixture of FC-72 delivered from the test section. The maximum cooling capacity of the thermostat is 2,000 Kcal/hr. The cold water at a specific flow rate is driven by a 0.5-hp pump to the condenser and a bypass loop is provided to adjust the flow rate. By adjusting the temperature and flow rate of the cold water, the bulk temperature of FC-72 in the condenser can be controlled at a preset level.
2.6 Programmable DC Power Supply
The power generated in the electric-heater is provided by a programmable DC power supply (Chroma 6203-60). This power supply provides a maximum rated D.C. power of 300 W for an output voltage of 60 V and an output current of 5 A. A Yokogawa WT210 digital power meter with an accuracy of ±0.1% is used to measure the DC current through the electric-heater and the voltage drop across the heater with
17
an accuracy of ± 1.5%. Thus the power input to the heater can be calculated.
2.7 Data Acquisition
The data acquisition system employed to acquire and process the data from various transducers is a 30-channel data logger (YOKOGAWA MX-100) along with a personal computer. All the voltage signals from the T-type thermocouples, pressure transducers, and volume flow-meters are converted to the temperature, pressure, and volume flow rate by the internal calibration equations in the computer and are displayed on the computer screen simultaneously.
2.8 Optical Measurement Technique
The optical measurement technique employed in the present study enables us to capture the bubble characteristics in the boiling flow near the copper plate. The photographic apparatus consists of a high speed digital video camera (IDT High-speed CMOS Digital Camera), a micro-lens (Optem Zoom160), a three-dimensional positioning mechanism, and a personal computer. The high-speed motion analyzer can take photographs up to 143,307 frames/s. Here, a recording rate of 1500 frames/s is adopted to obtain the images of the bubble ebullition processes. The positioning mechanism is used to hold the camera at the required accurate position. The data for the bubble characteristics are collected in the regions near the geometric center of the plate surface. After the coolant flow rate is lowered suddenly, we start recording the boiling activity. The high speed motion analyzer stores the images which are later downloaded to the personal computer. Then, the mean bubble departure diameter and frequency and active nucleation site density at each time step are calculated by viewing more than 400 frames before and after that time step for
18
each case. In order to achieve the highest possible resolution and to eliminate errors in calibration, the camera lens is fixed at a constant focal length, resulting in a fixed viewing area. Specifically, the images of the bubbles during boiling processes are directly visualized and measured by showing them on the computer screen in a much slower rate. By considering the pixel depth, size, resolution, center-to-center spacing, sensor image area, minimum inter-frame rate, and integration time of the digital camera and computer screen, the uncertainties of the measured dp, f and nac are
estimated to be ±5.0%, ±4.5% and ±5.5%, respectively.
2.9 Experimental Procedures
In each experimental run, liquid FC-72 in the coolant container is degassed first.
Besides, the non-condensable gases in the coolant loop are evacuated and the liquid FC-72 is filled into the loop. Then, we turn on the controller for setting the required rotation rate of the AC motor to regulate the FC-72 flow rate. Next, the temperature and flow rate of the hot-water loop are adjusted so that the FC-72 temperature at the test section inlet can be maintained at a preset level. The imposed heat flux on the boiling surface is adjusted by controlling the electric current delivered to the heater from the D.C. power supply. Temperature and flow rate of the cold water in the cold-water loop can be adjusted to condense and subcool the liquid-vapor mixture of FC-72 from the test section. Meanwhile, we regulate the FC-72 pressure at the test section inlet by adjusting the gate valve locating right after the outlet of the test section. As the boiling flow in the test section reaches statistically steady-state condition, we suddenly lower the FC-72 mass flow rate to another constant level and the boiling flow experiences unsteady variations in heat transfer and bubble behavior. By measuring the current delivered to and voltage drop across the heater and by
19
photographing the bubble activity during the transient processes, we can calculate the time dependent heat transfer rate to the refrigerant and obtain the associated bubble characteristics. The whole system is considered to arrive at a statistically steady state when the time variations of the system pressure and imposed heat flux are respectively within ±1% and ±4%, and the time variations of the heated wall temperature are less than ±0.2℃ for a period of 100 minutes. All the data channels are scanned every 0.5 second for an entire transient process.
2.10 Experimental Parameters
The ranges of the experimental parameters to be covered in the present study are listed in Table 2.1. Moreover, the thermodynamic and transport properties of FC-72 are given in Table 2.2.
20
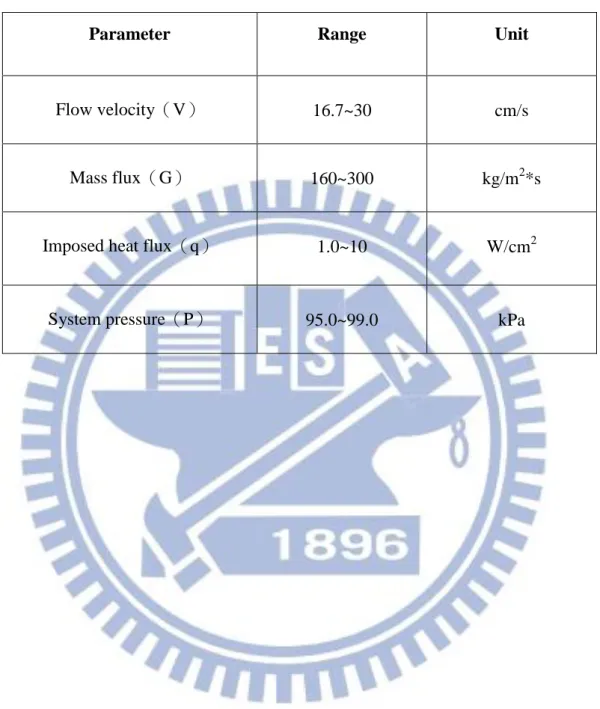
Table 2.1 Experimental Parameters
Parameter Range Unit
Flow velocity(V) 16.7~30 cm/s
Mass flux(G) 160~300 kg/m2*s
Imposed heat flux(q) 1.0~10 W/cm2
Temperature T Pressure P Latent heat ilv Density ρ liquid vapor Dynamic viscosityμ liquid vapor Specific heat Cp liquid vapor Conductivity K liquid vapor Thermal expansion coefficient β Surface tension σ Thermal diffusion coefficient α liquid vapor Prandtl No. Pr liquid vapor
℃ K Mpa kJ/kg kg/m3(l) kg/m3(v) mPa*s(l) uPa*s(v) J/kg*K(l) J/kg*K(v) mW/mK(l) mW/mK(v) 1/K(l)
mN/m(l) m2/s(l) m3/s(v) 20 293.15 0.024 90.4 1687 3.43 0.69 10.76 1045 844 57.9 10.4 0.00157 10.9 3.29E-08 3.6 12.4 0.87 25 298.15 0.03 88.5 1674 4.28 0.64 10.94 1053 851 57.4 10.8 0.00159 10.47 3.26E-08 3 11.8 0.86 30 303.15 0.038 86.7 1660 5.27 0.6 11.11 1061 858 56.9 11.1 0.0016 10.04 3.23E-08 2.5 11.2 0.86 35 308.15 0.046 84.8 1647 6.44 0.56 11.29 1068 866 56.3 11.5 0.00161 9.62 3.20E-08 2.1 10.6 0.85 40 313.15 0.057 82.9 1634 7.78 0.53 11.47 1076 873 55.8 11.8 0.00162 9.2 3.17E-08 1.7 10.2 0.85 45 318.15 0.069 81.1 1621 9.31 0.5 11.64 1084 880 55.2 12.2 0.00164 8.78 3.14E-08 1.5 9.7 0.84 50 323.15 0.083 79.1 1607 11.06 0.47 11.82 1092 887 54.7 12.5 0.00165 8.36 3.12E-08 1.3 9.3 0.84 54.3 327.45 0.097 77.5 1596 12.75 0.44 11.97 1098 892 54.3 12.8 0.00166 8.01 3.09E-08 1.1 9 0.83 55 328.15 0.099 77.2 1594 13.03 0.44 12 1099 893 54.2 12.9 0.00166 7.95 3.09E-08 1.1 9 0.83 55.7 328.85 0.1013 76.9 1592 13.33 0.44 12.02 1101 894 54.1 12.9 0.00167 7.9 3.09E-08 1.1 8.9 0.83 60 333.15 0.117 75.2 1581 15.25 0.42 12.17 1107 900 53.6 13.2 0.00168 7.55 3.06E-08 1 8.6 0.83 70 343.15 0.16 71.1 1554 20.49 0.38 12.53 1123 913 52.5 13.9 0.00171 6.75 3.01E-08 0.7 8.1 0.82 80 353.15 0.213 66.7 1528 27 0.34 12.88 1138 926 51.5 14.6 0.00174 5.97 2.96E-08 0.6 7.6 0.82
Table 2.2 Thermodynamic and transport properties of the dielectric coolant FC-72
Fig. 2.1 Schematic diagram of experimental apparatus
Pressure transducers
Acrylic window
Thermocouples
Test section
Exit
Fig. 2.2 Three dimensional plots of test section along with inlet and outlet section
Flow
2
3
50mm
8mm
Flow
Gradually diverging
section(200mm)
Main test section
(100mm)
Gradually converging
section(200mm)
Fig. 2.3 Three-dimensional plots of the test section in rectangular flow channel
Copper plate (10 × 10mm
2)
Electric-heater
Cylindrical-hollow Peek block
Cylindrical Peek bolt
Fig. 2.4 Three-dimensional pictures showing Cylindrical PeeK block and Cylindrical Peek bolt
2
Perspective view
Top view Top view
Front view Fig 2.5 Location of thermocouples
‧ ‧ ‧ ‧ ‧ ‧ ‧ ‧ ‧ ‧ ‧ ‧ ‧ ‧ ‧ ‧ ‧ ‧ ‧ T1 T2 T3 T4 T5 T6 T7 T1 T6 T5 T7 T1 T7
All the spots on pictures designate locations of thermocouple tips
T2 T4 T3 10 mm 3 mm 26
27
CHAPTER 3
DATA REDUCTION
In the present study of heat transfer and bubble characteristics in the transient flow boiling of FC-72 affected by a step decrease in the coolant mass flux over the small heated plate flush mounted on the bottom of the horizontal rectangular channel, the coolant mass flux ranges from 300 kg/ 2s to 160 kg/ 2s and the imposed heat
flux from 0.1 to 10 W/c 2. A data reduction analysis is needed to calculate the flow
boiling heat transfer characteristics from the raw data measured in the horizontal rectangular channel.
3.1 Flow Boiling Heat Transfer Characteristics
Before the flow boiling experiment, the net power input Qn to the coolant flowing over the copper plate is evaluated from the difference between the total power input Qt to the copper plate and total heat loss from the test section Qloss. The total power input can be calculated from the measured voltage drop across the electric-heater and the electric current passing through it.
The total power input Qt and the effective power input Qn are hence calculated respectively from the equations:
Qt = V ∙ I ( 3.1 ) where V and I are individually the voltage drop across and current through the electric-heater, and
28
Here the total heat loss from the copper plate is approximately estimated by accounting for radial conduction heat transfer from the copper plate to the surrounding cylindrical Peek block and downward heat conduction from the heated plate to bottom Peek plate as
Qloss =4kp(Tcu− Tp,s)Acu,s
Lcu,s +
kp(Te− Tp,b)Ap,b Lp,b
In the above equation kp is the thermal conductivity of the Peek, Acu,s and Ap,b are respectively the side surface area of the copper plate and bottom surface area of the Peek plate. Lcu,s is the horizontal distance between the side surface of the copper plate and the thermocouple tips in the cylindrical Peek block, and Lp,bis the vertical distance between the bottom surface of the electric-heater and the thermocouple tips in the bottom Peek plate. Besides, Tcu and Te are respectively the space-average temperature of the copper plate and the temperature at the bottom surface of the electric-heater ; Tp,s and Tp,b are temperatures measured in the cylindrical Peek block and bottom Peek plate, respectively.
The net imposed hat flux at the copper plate surface is defined as q = Qn/Acp
where Acp is the surface area of the copper plate. The relative heat loss from the heated copper plate is defined
ε =
QlossQt
× 100%
(3.3)
(3.4)
29
The results from this estimation show the relative heat loss for all cases investigated here for the two-phase flow ranges from 6% to 20% depending on the imposed heat flux.
The average single phase liquid convection and time average saturated flow boiling heat transfer coefficients over the copper plate are defined respectively as h1∅
=
Qn Acp∙(Tw−Tr,ave) And h2∅=
Qn Acp∙(Tw−Tr,ave) with T , ve=
T n T2 outWhere T , ve is the average of the measured inlet and outlet temperatures of the coolant flow through the test section, which is taken as the average bulk liquid coolant temperature for both single-phase and boiling flows, and Tw is the space-average temperature of the upper surface of the copper plate. Note that Tw is calculated from the measured average temperature from the thermocouples located near the upper surface of the copper plate according to the one-dimensional steady state conduction heat transfer. Thus we have
Tw = Tcu− (q ×kl
cu) (3.9)
Where Tcu is the average measured temperature from the thermocouples installed in the copper plate and kCu and l are individually the thermal conductivity of copper and the vertical distance between the thermocouple tips and the upper surface of the copper plate.
3.2 Flow Boiling Bubble Characteristics
(3.6)
(3.7)
30
To explore time variations of the bubble characteristics, we estimate the space-average bubble departure diameter and frequency and the average active nucleation site density on the heating surface at given selected instants for the cases dominated by the bubbly flow. Specifically, for a given instant the average bubble departure diameter is determined by measuring the diameters of departing bubbles on a small heated surface area and it is defined as
dp = ∑ dp
where N is the number of measured bubbles. In this determination of dp, N is not less
than 3. Similarly, the mean bubble departure frequency is estimated by averaging the number of bubbles departing from the heated surface nb over a certain period of time tb
at a few bubble departing sites N. Here tb is set at 0.27 second. Thus fis defined as
= ∑ = ∑ n /t
here N is also greater than 3. The average active nucleation site density is estimated by counting the number of bubble nucleation sites ns over a small heated surface area
As′, and it is defined as
n c = ns/As′
For each data point the above estimations are conducted for 400 frames around this data point.
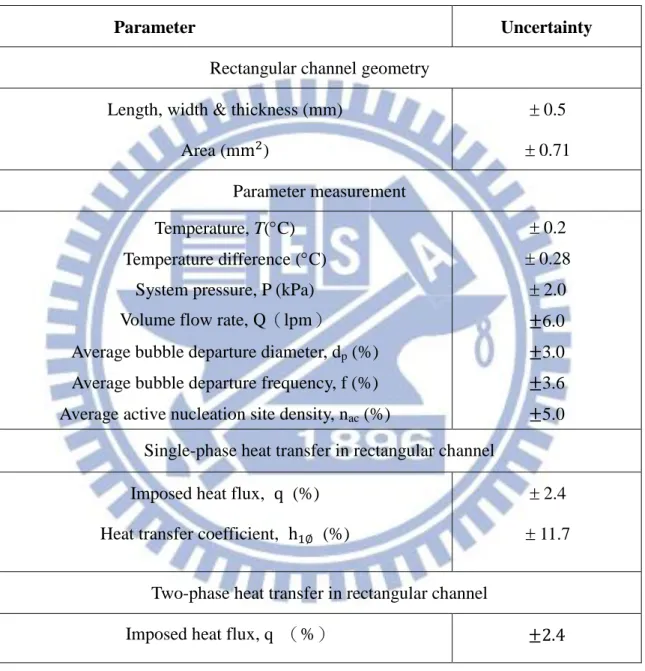
3.3 Uncertainty Analysis
Uncertainty of the single-phase liquid convection and flow boiling heat transfer characteristics and other parameters are estimated by the procedures proposed by Kline and McClintock [43]. The detailed results from this uncertainty analysis are summarized in Table 3.1.
(3.10)
(3.11)
31
Table 3.1 Summary of the results from the uncertainty analysis
Parameter Uncertainty
Rectangular channel geometry Length, width & thickness (mm)
Area (m 2) 0.5 0.71 Parameter measurement Temperature, T(C) Temperature difference (C)
System pressure, P (kPa) Volume flow rate, Q(lpm) Average bubble departure diameter, dp (%)
Average bubble departure frequency, f (%) Average active nucleation site density, nac (%)
0.2 0.28 2.0 ±6.0 ±3.0 ±3.6 ±5.0 Single-phase heat transfer in rectangular channel
Imposed heat flux, q (%) Heat transfer coefficient, h1∅ (%)
2.4
11.7 Two-phase heat transfer in rectangular channel
32
CHAPTER 4
TRANSIENT FLOW BOILING OF FC-72 OVER A
SMALL HEATED COPPER PLATE DUE TO A STEP
DECREASE IN MASS FLOW RATE
The experimental results from this study are presented in this chapter to illustrate how a step decrease in the coolant mass flow rate affects the FC-72 transient flow boiling heat transfer over a small heated copper plate flush mounted on the bottom of a horizontal rectangular channel. The present experiments are carried out for the FC-72 mass flux ranging from 300 to 160 kg/m2s for the imposed heat flux varying from 1.0 W/cm2 to 10 W/cm2. Specifically, we investigate the following five cases for the coolant mass flux reductions: from 300 to 250 kg/m2s, 300 to 200 kg/m2s, 300 to 160 kg/m2s, 250 to 160 kg/m2s, and 200 to 160kg/m2s. The coolant in the test section is initially maintained at slightly subatmospheric pressure of 99 kPa with Tsat = 55℃
for FC-72. In the following, effects of a step decrease in the coolant mass flux on the time variations of the measured transient flow boiling heat transfer and bubble characteristics will be examined in detail. Note that before the step change in the coolant mass flux we have steady-state saturated nucleate boiling of FC-72 at a constant coolant mass flux in the test section at a given imposed heat flux, which is the initial flow condition in the experiment. At the test section inlet the flow is in pure saturated liquid state with x = 0. The heat transfer performance is presented mainly in terms of the transient variations of the average surface temperature of the copper plate and the boiling heat transfer coefficient. Besides, the associated bubble characteristics will be examined.
33
4.1 Single-phase Liquid Convective Heat Transfer
Before beginning the flow boiling experiments, steady single-phase convective heat
transfer tests are conducted for liquid FC-72 flow over the copper plate heated by a constant heat flux in the rectangular channel. The measured space-average heat transfer coefficient for single-phase convection from the heated copper surface to the coolant is compared with the correlation proposed by Gersey and Mudawar [8]. Their correlation is
Nu ̅̅̅̅L = 0.362.ReL0.614 .Pr1/3 where ReL = G.L 𝜇L
h̅lφ
=
kL L .Nu̅̅̅̅L (4.3)Their correlation is based on the experimental data procured from the same liquid and same flow configuration as the present study and the comparison is shown in Fig. 4.1 for the dimensional and dimensionless heat transfer coefficients. The results indicate that our data are in good agreement with their correlation.
It should be mentioned that all of the working fluid properties used in reducing the data for Fig. 4.1 from Equations (4.1) – (4.3) are calculated at the coolant inlet
temperature. The copper plate length is used in defining the Reynolds number ReL and
average Nusselt number Nu̅̅̅̅L.
4.2 Transient Flow Boiling Heat Transfer Characteristics
The effects of the step decrease in the coolant mass flux on the temporal heat transfer characteristics of the FC-72 flow boiling over the heated plate are illustrated in Fig. 4.2 by showing the time variations of the heated surfaced temperature and boiling heat transfer coefficient for various heat fluxes for the FC-72 mass flux lowered slightly from 300 to 250 kg/m2s. For clarity, the time variations of the inlet (4.1)
34
coolant temperature and pressure are also given in the figure. For the plots presented in this study the symbol〝t = 0〞designates the instant of time we begin to lower the coolant mass flux. The results for a given heat flux clearly show that immediately after the coolant mass flux is lowered, the heated surface temperature decreases gradually (Fig. 4.2(c)) and the boiling heat transfer coefficient increases slowly (Fig. 4.2(d)). It takes about 20 seconds for Tw and h2ψ to level off. This unusual trend of
increasing boiling heat transfer coefficient at reducing coolant mass flux can be attributed to the accompanying decreasing inlet coolant pressure (Fig. 4.2(b)). Thus the corresponding saturated temperature of FC-72 also decreases with time. But the inlet coolant temperature stays at a nearly coolant level in the process (Fig. 4.2(a)) and it is above the saturated temperature of FC-72. Consequently, the liquid FC-72 over the plate is at superheated state. The degree of the liquid superheating becomes more pronounced as time proceeds. This increasing liquid superheating results in favorable bubble characteristics for boiling heat transfer, which will become clear later when the data for the bubble characteristics are presented. As the boiling flow reaches steady state at t > 25 seconds, the liquid superheating is around 0.7℃. We also observe from the data in Figs. 4.2(c) and (d) that the degrees of Tw and h2ψ changes
during the process are not affected by the imposed heat flux to a noticeable degree. For a larger step decrease in the coolant mass flux, the drop in the heated surface temperature and the rise in the boiling heat transfer coefficient are greater, as evident from comparing the data in Figs. 4.3 and 4.4 with Fig. 4.2. This can be more clearly seen in Fig. 4.5. The above result is a direct consequence of a higher liquid superheating for a larger reduction in G. Specifically, for G reduced from 300 to 200 kg/m2s and 300 to 160 kg/m2s the inlet liquid superheatings as the flow reaches steady state are 1.1℃ and 1.7℃, respectively. Similar trends are noted for the cases with G lowered from 200 to 160 kg/m2s and 250 to 160 kg/m2s (Figs. 4.6 and 4.7).
35
The above data for the transient boiling heat transfer coefficient h2ψ can be
correlated as
h2ψ/h2ψ,0 = 1+ b. G
G [1
L ] (4.4)
In the above equation a = 0.0073, b = 0.07 and c = 0.15. Besides, △G is the total mass
flux reduction during the entire process. G0 and h2φ,0 are respectively the mass flux
and initial steady saturated flow boiling heat transfer coefficient at t < 0. Here h2φ,0
can be correlated as Nu0 = h2φ,0
L
kL = 214.5 L
(4.5)
Figure 4.8 shows that nearly all the present experimental data fall within ±5% of the correlation proposed in Equation (4.4) and the mean absolute error is 3% . The correlation also suggests that the time constant for the change of the boiling heat transfer characteristics of the flow with the coolant mass flux reduction is ( H/G0)/a
and is around 7.0 seconds. This time constant results mainly from the inertia of the flow rate change with time.
To unravel the effects of liquid superheating on the boiling heat transfer, in Figs. 4.9-4.13 we compare the measured data for the steady-state boiling curves in the nucleate boiling regime for different inlet liquid superheats at the same constant FC-72 mass flux and saturated temperature. Here the inlet liquid superheat is defined as △Tsup ≡ Tin – Tsat and the wall superheat is defined as △Tw ≡ Tw – Tin. The use
of Tin in defining the wall superheat instead of Tsat is considered to be more
appropriate by Thome [44] for subcooled boiling and is adopted in the present study for superheated boiling. The data in Figs. 4.9-4.13 clearly manifest that at a high liquid superheat with △Tsup ≧1.1℃ the boiling curves shift significantly to the left,