科技部補助專題研究計畫成果報告
期末報告
綠建築對不動產價值之影響
計 畫 類 別 : 個別型計畫 計 畫 編 號 : MOST 102-2410-H-004-211- 執 行 期 間 : 102 年 08 月 01 日至 103 年 07 月 31 日 執 行 單 位 : 國立政治大學地政學系 計 畫 主 持 人 : 陳奉瑤 計畫參與人員: 碩士班研究生-兼任助理人員:李智偉 碩士班研究生-兼任助理人員:吳孟璇 報 告 附 件 : 出席國際會議研究心得報告及發表論文 處 理 方 式 : 1.公開資訊:本計畫可公開查詢 2.「本研究」是否已有嚴重損及公共利益之發現:否 3.「本報告」是否建議提供政府單位施政參考:否中 華 民 國 103 年 10 月 29 日
中 文 摘 要 : 能源耗竭與生態永續是近年全球關切之議題,建築產業消耗 之能源及對生態的破壞尤甚,綠建築之推動為各國政策發展 方向,無論透過市場機制或政策推廣綠建築,綠建築價格及 綠效能將是重要關鍵。 本文以新北市為研究範圍,利用特徵價格迴歸分析進行實 證,實證結果顯示,新北市擁有綠建築標章之華廈及住宅電 梯大樓,平均溢價為 8%;合格級、銅級、銀級與黃金級的溢 價率分別為 14.3%、2.7%、4.8%及 8%;高價區與低價區之溢 價率分別為 4.5%與 16.8%,顯然綠建築對於價格的影響在低 價地區較能顯現,在高價地區則無法突顯;就空間地域而 言,市中心區域之綠建築溢價率較低,偏遠地區之溢價率相 對較高。換言之,綠建築對偏遠、相對低價之房地產發揮廣 告效果,且以合格級居多,綠建築的推動在未來仍有很大的 空間。 中文關鍵詞: 綠建築、綠建築標章、特徵價格模型、新北市
英 文 摘 要 : Energy depletion and Ecological sustainability are two global-wide issues that most countries seriously concern about, and construction industry takes a big share of energy consumption and ecological damage. Therefore, the promotion of the green building gradually becomes the trend and leads the direction of national policy. Either pushes the trend with the market mechanism or with the hand of the government policy, the price of green building and the green effect will be the two significant keys.
This research exams the price effect of the green label with Rosen Hedonic Model in New Taipei City, and the result shows that the building certificated with green label gets 8 percent premium on average. Price premium varies at different levels of labels, and they are 14.3%, 2.7%, 4.8% and 8% for qualified, copper, silver and gold levels. High-priced and low-priced area have 4.5% and 16.8% green premium
respectively, and it's obvious that the green
premium outstands strongly in low-priced area but not in high-priced area. In terms of space and geography, the buildings in CBD obtain lower green premium than those in outskirts. In other words, the green
buildings perform better in outskirt and lower-prices area with the help of advertisement, and
qualified-level green buildings take higher share among them, showing that there are still rooms for promoting green buildings in the future.
英文關鍵詞: Green building, Green building label,Hedonic model, New Taipei City
一、 前言
二十世紀以來,全球環境逐漸惡化,綠建築研發逐漸成為國際間關切的議題。 我國綠色建築的策略,在基於各環境議題的比重平衡下,依據環境尺度由大至小的 指標次序,可歸類為四大範疇、九大指標包括:生態(含生物多樣性、綠化量、基 地保水等三指標)、節能(日常節能指標)、減廢(含二氧化碳及廢棄物減量二指標)、 健康(含室內環境、水資源、污水垃圾改善等三指標),稱之為「EEWH 系統」(Ecology, Energy Saving, Waste Reduction, Health)。其為全世界截至 2010 年 26 個推動綠建築評 估系統的國家中,第四個上路的系統。換言之,我國在綠建築的推動上名列前茅。 綠建築為未來的趨勢,國外相關文獻顯示綠建築標章與相關節能建築認證將成 為影響房價的重要特徵,且綠建築對房價或租金收益的影響是正面而顯著的。例如: Eichholtz et al.(2010)指出美國有綠建築認證、Energy Star 認證和 LEED 認證等三個 變數皆對價格有顯著影響,於租金面分別增加1.8%、2.12%和 5.8%,有效租金面增 加4.7%、6.6%和 5.9%,售價面則增加 13.3%、12.9%和 11.1%。Pivo (2010)研究美國 Energy Star 認證對社會責任投資的回報,發現 Energy Star 認證能增加 5.2%租金和 1.3%的佔有率。Aroul and Hansz (2012)研究 Frisco 和 McKinney 城市,發現建物有綠 特色能增加2%的售價。除此之外,英國倫敦研究(Andrea et al.,2012)發現 BREEAM 認證提升售價 30.5%、提升租金 38%,Leopoldsberger(2011)研究德國發現每月每平 方公尺的能源成本和維護成本分別對租金造成2%和 9.5%的減損。 反觀我國,1998 年開始推動綠建築,內政部建築研究所訂定「綠建築與居住環 境科技計畫」據以執行,1999 年制訂出「綠建築解說與評估手冊」做為我國綠建築 評審之基礎,迄今已進入第三代,取得綠建築候選或綠建築標章的數量雖有逐漸增 加的趨勢,但截至至2014 年 6 月底為止,獲得綠建築標章認證的民間住宅僅有 113 件,扣除所有新建公共建築依公共工程委員會的要求必須取得綠建築標章,以及部 分指標性建築商開發高級住宅引入綠建築設計概念外,綠建築住宅的推廣於一般新 建住宅並不普遍。就對綠建築的需求而言,依溫雅貴(2003)、方嘉琳(2005)和張桂鳳 (2008)的研究可發現,國內消費者對綠建築的需求應該很高,基於利之所在勢之所趨, 綠建築之供給量應不只如此,但在台灣,建築業者卻無法感受其價值,而消費者似 乎也輕估綠建築帶來的價值,而難以反應在住宅價格上,因而產生負面循環,以致 綠建築數量之增加速度緩慢。台灣綠建築與住宅價格的關係尚未明朗,除了都市更 新估價因綠建築容積獎勵而增加樓地板面積及其價格因而較為明確外,綠建築價值 於市場的反應,及其資本化於市場價值的情形如何,有待深入探究。 此外,不同價格水準或空間區域上綠建築溢價情況是否存在差異,高價地區之 於低價地區,市中心地區之於郊區,甚至新的綠建築與舊綠建築是否因設施的維護 是否良好而以有差別?國內過去相關研究,多著重於強調綠建築之重要性、綠建築 之投入成本(劉賢樹,2003、盧裕文,2011),僅 Chen et al.(2014)於台北大學特定區 之研究指出,建築標章在價格中影響不顯著,反而綠建色之有無對房價較具影響力。 美國估價協會(Appraisal Institute)強調估價師評估綠建築時,應該確定”which questions to ask”,並且確認”which items are likely to affect value”,為有更周延的研究成果,本文將研究範圍擴充至全新北市,依特徵價格理論建構綠建築變數於不動產 特徵價格迴歸模型,做為實證分析基礎。藉由不同價格水準或空間地域探索綠建築 之溢價,由價格的角度提出綠建築後續推展的方向建議,並提供不動產估價師評估 不動產價值之參考。 綜合前述,本文設定研究目的如下: (一)分析綠建築指標對不動產市場價值之影響,釐清其與房價影響之程度,據以 提供綠建築對房價影響之認知,以促進綠建築推廣。 (二)探索不同價格水準或空間地域綠建築溢價差異程度,做為不動產估價師於評 估綠建築價值時之參考。
二、 文獻探討
綠建築對房價正面的影響,主要為低營運和維護成本造成迅速的投資回報、增 加綠建築的市場利益,以及可忽略額外的成本。Steven(2002)指出綠建築可減少生命 周期的成本,高價值的綠建築特色甚至可在3 到 5 年回收其成本,其將主要價值利 益分為11 項:(1)較低的營運和維護成本;(2)節省能源和資源;(3)認證、補助和誘 因等;(4)較快吸引承租人;(5)較高的租金、投資/出售價值;(6)較低的流動率和空 置率;(7)減少固定成本;(8)減少內部移動成本;(9)增加產量;(10)較快、較佳的公 共過程;(11)改善風險和市場銷售性。而綠建築的阻礙,主要則在於初期花費成本高, 再加上承租戶對綠建築的認知和教育,知識、研究和資源不夠普及,以致不了解綠 的意義;而建設公司缺乏綠建築相關經驗、開發者對其中風險的認知不夠了解、或 不清楚節省的利益與投資者/地主之間的關係、不夠充分了解其價值和估價方式等, 使綠建築對房價產生負面的影響。Yongheng et al.(2013)研究新加坡綠建築,結果發 現綠建築於預售時平均溢價為4%,轉售時溢價高達 10%,顯示綠建築效用是顯著且 被消費者接受,因而得以將節能與綠效能之成效反映於轉售價格上。Yoshida and Sugiura (2011)研究日本之綠建築,指出經 Tokyo Green Building Program 認證之建物 在轉售時折價5.5%,推測消費者對於綠節能技術抱持懷疑,又綠建築的經營需額外 花費維護成本,在轉賣綠建築時買賣雙方無法給予綠效能正面之肯定。Zheng et al.(2011)的研究也指出北京「最綠」之綠建築在預售時溢價高達 17.7%,但在轉售卻 產生11%的折價,綠建築與價格之關係在各國實證結果中,顯示出不盡相同之溢價 率。 有關綠建築對於商辦或住宅的租金和售價影響研究,Eichholtz et al.(2009)以全美 8,182 個出租案例 (其中綠建築有 694 個)和 1,816 個出售案例(其中綠建築有 199 個) 研究綠建築對商辦租金和售價的影響,採用的自變數包括是否為綠建築、為Energy Star 認證或 LEED 認證、建物面積、建物等級(A、B)、屋齡、是否有裝修、有無公 共設施等,發現租金和是否為綠建築、是否獲得Energy Star 認證、建物面積、建物 等級(A 和 B)和屋齡等有顯著正相關,其中有綠建築標章能提升租金 3.5%、Energy Star 認證能提升租金 3.3%;至於有效租金方面,有綠建築認證能增加有效租金 10%, Energy Star 認證能提升有效租金 10%、LEED 認證則能提升租金 9.4%;售價方面, 是否為綠建築、是否獲得Energy Star 認證、建物等級 A 和屋齡有顯著正相關,建物 等級B 有顯著負相關,其中有綠建築認證能提升售價 16.8%、獲得 Energy Star 認證 能提升售價19.1%。Eichholtz et al.於 2010 年再對全美 18,858 個出租案例其中(綠建 築有1,943 個)和 5,249 個出售案例(其中綠建築有 744 個)做綠建築的持續性動態分析, 研究發現屋齡、公共設施、是否為綠建築、建物面積皆對租金產生顯著正相關,針 對有綠建築認證、有Energy Star 認證和有 LEED 認證等三個變數皆顯著,租金面與 非綠建築相比,分別增加1.8%、2.12%和 5.8%,有效租金面分別增加 4.7%、6.6% 和5.9%,售價面則分別增加 13.3%、12.9%和 11.1%。報酬,自變數包括社會資產投資特色、國家市場情況、地區性經濟、可及性情形、 建物品質、政府服務成本等,研究發現市場價值方面,Energy Star 認證、離商業中 心再開發區域的距離、商業中心區0.5 英里內有無火車站和郊區 0.5 英里內有無火車 站的正相關影響較大,其中Energy Star 認證能增加 5.2%租金和 1.3%的佔有率。 Chegut et al.(2012)研究英國倫敦綠建築對租金和售價的影響(出租個案 1,149 個,其 中有64 個綠建築;出售個案 2,019,其中有 69 個綠建築),變數包括是否為綠建築、 建物面積、屋齡、有無公共設施、是否裝修過、是否為二手、離火車站距離,研究 發現租金方面,有綠建築標章、使用面積、屋齡對租金有顯著正相關,控制出租契 約特色和地區供給後,BREEAM 認證提升租金 30.5%;售價方面,有綠建築標章、 建物面積、離火車站距離對售價有顯著正相關,控制變數後,BREEAM 認證增加售 價38%。Reichardt et al.(2012)研究美國商辦得到永續建物認證對其租金的影響和發 展的時間軌跡,研究自變數包括屋齡、承租面積、基地面積、空置率、有無Energy Star 認證或LEED 認證、年期、季別等,透過此研究進一步證實 Energy Star 或 LEED 認 證對租金的動態影響,其發現認證年期越早,租金增加影響越大。
此外,有關綠建築對住宅價格的影響面,Lorenz et al.(2006)研究德國 Stuttgart 28,789 個永續性建物和市場價值的關連,自變數包括樓地板面積、地點品質、住宅 品質、現代化程度、屋齡、是否為1 樓或 2 樓或大於 2 樓、是否為頂樓或地下室等, 研究成果指出樓地板面積、地點品質、住宅品質、現代化程度對房價有顯著地正向 影響。Leopoldsberger (2011)以德國 57 個城市 532 個節能建物為估價標的,以樓地板 面積、屋齡、建物品質(高、中、低)、有無電梯、建物空調設施、維護成本、能源成 本、其他費用等為自變數,研究發現建物品質、建物空調設備對租金有顯著正相關; 維護成本(-2%)、能源成本(-9.5%)、屋齡對租金有顯著負相關。Aroul and Hansz (2012) 以Frisco 和 McKinney (分別有 6,555 和 7,500 個案例)為研究範圍,分析綠特色建物 和強制綠建築計畫對住宅交易價格的影響,研究變數包括建物是否有綠特色、是否 為強制綠建築計畫的建物、面積、屋齡、屋齡平方、年期、季別等,主研究結果顯 示綠特色、強制綠建築對住宅交易價格為顯著正相關,其中有綠特色的建物售價增 加2%。劉彣柔(2011)以香港為研究範圍,研究成果發現綠建築認證對房地產價格有 些微正向影響,但其影響不甚顯著。而陳怡璇(2011)以問卷調查法調查 120 位估價師, 對綠建築價格認知結果顯示87%之估價師認為理論上綠建築對不動產價格將產生正 面影響,66%的估價師認為市場上會反應出正面影響,且多數估價師認為其影響程 度在10%以內。 綜合上述可發現,國外運用特徵價格模型分析綠建築對不動產價格的影響程度, 主要以辦公室為主,近來已慢慢擴充至住宅。國內缺乏相關研究,僅Chen et al.(2014) 進行綠建築指標與綠特色之量化研究,可惜侷限於特定子範圍,且持有綠建築標章 者均為同一建設公司,恐有偏誤。本文為與國外研究有對話空間,將以特徵價格理 論為研究方法,擴大實證地區,以分析綠建築與不動產成交價格之關係。
三、 研究方法
(一) 實證模型
Sirmans et al. (2005)指出特徵價格模型中半對數模型可透過特徵係數值說明每 一單位特徵的改變房價將有多少百分比的變動,還可最小化異質變異的問題,而 Leopoldsberger et al.(2011)、Aroul & Hansz (2012)和 Reichardt et al. (2012)等與本文相 關之文獻,亦採用半對數特徵價格模型為實證模型,故本文採如下之特徵價格模型, 此評估綠建築對房價的影響。 Ln P α ∑ β X ∑ β D β G ε (1) Ln(Pi):第 i 個樣本交易每坪單價之自然對數。 α0:截距項。 βj:第j 個特徵係數值。 Xji:第i 個樣本第 j 個連續性特徵屬性。 Dki:第i 個樣本第 k 個虛擬特徵屬性。 βg:綠建築變數之係數。 G :第 i 個樣本是否為綠建築的虛擬特徵屬性。 :第i 個樣本之常態分配殘差項。 本文考量國內不動產特性與實價登錄資料,並參考國外綠建築相關文獻,於特 徵價格模型中,虛擬變數部分選擇放置綠建築變數(Eichholtz et al.(2010), Yongheng et al.(2013), Reichardt et al.(2012)…)、建材等級(Leopoldsberger (2011), Pivo (2010)…)、 臨路狀況、預售(Yongheng et al.,2013)、隔間、交易年(Reichardt et al.,2012)、管理組 織;連續變數為屋齡(Reichardt et al.(2012), Aroul and Hansz (2012)…)、移轉層次 (Lorenz et al.,2006)、總樓層,並放入集群區位變數(Eichholtz et al.,2010)。
(二) 研究資料說明
1. 資料篩選 截至民國103 年 6 月,台灣民間住宿類建築取得綠標章者共 185 件,民間及公 有各為113 件(61.1%)及 72 件(38.9%);民間自建之綠建築,以北部居多為 79 件(69.9%), 其中又以新北市37 件(46.8%)佔多數,因此本文以新北市為實證地區。本研究以實 價登錄資料做為比較綠建築與非綠建築價格差異之基礎,透過財團法人建築中心的 公開資料取得綠建築標章社區之座落地號,再由政府公開資訊網站1中依照綠建築社 區之地號查詢建案之使用執照,由使用執照記載之建築完工日期、區段地址、總樓 層數等三項,篩選出實價登錄交易資料中屬於綠建築交易之個案。當中實價登錄中 新北市原始資料筆數114550 筆,透過比較篩選後實價登錄中之綠建築社區交易共 1549 筆及綠建築 500 公尺範圍內之非綠建築社區交易 2418 筆,全部樣本共 3967 筆。 建築型態由公開資料可得知綠建築社區多屬於華廈(12 件,15.2%)及住宅大樓(57 件, 72.2%)2,為了提高綠建築與非綠建築之替代性,故僅篩選建築型態為華廈及住宅大 樓之交易資料,而交易標的僅篩選「房+地」及「房+地+車」兩者。本研究將研究範 圍鎖定於住宅類型不動產,在主要用途中僅篩選「住商用」、「住宅用」、「見使用執 照」、「見其他登記事項」等,使用分區僅保留住、商。於樓層方面,住宅使用之華 廈及住宅大樓,若成交樓層位於一樓或頂樓,成交單價會因可及性、景觀性及使用 便利性受到顯著之影響;另方面,若移轉標的超過一層樓者,總價與單價之關係會 與市場價格關係有所差異,故本研究排除位於一樓、頂樓及交易標的超過一層樓之 交易案例,以維持案例之相似性。同時為降低時間變動之影響,本文以綠建築社區 建築完工日期前後兩年進行篩選,保留與綠建築興建日期條件相近者。 綠建築依指標分數給予不同等級之綠標章,分別為未分級、合格級、銅級、銀 級、黃金級與鑽石級。本研究考量未分級其內涵可能難與其他等級標章在同一個比 較水準進行評估,故未將未分級之綠建築社區納入本次研究範圍。新北市之綠建築 社區包括11 件合格級、6 件銅級、12 件銀級、3 件黃金級,共 32 件,現階段尚無民 間住宅類建築取得鑽石級綠建築標章。考量綠建築社區價格日期之連續性及完整性, 限縮交易日期為101 年至 103 年 3 月新北市之實價登錄交易資訊為本研究之樣本。 2. 樣本之空間分布 樣本之空間分布狀況如圖一所示,三角形圖示為有交易紀錄之綠建築社區坐落 位置,圓形則為非綠建築之交易個案,由圖中可發現新北市之綠建築主要分布於西 側及西南側,且多分佈於新開發地區如淡海新市鎮、三峽樹林,或是板橋等高單價 地區,交易相對冷淡之地區如瑞芳、石碇等,並無綠建築之蹤影。 1 台北市地理資訊e 點通、新北市執照存根查詢系統。 2 依實價登錄之分類,10 層樓以下有電梯為華廈、11 層樓以上有電梯為住宅大樓圖一 所有交易樣本及綠建築社區之分布
本研究之目的在於比較綠建築與非綠建築間價格之差異,單以特徵價格模型將 所有實價登錄資料與綠建築成交資料直接進行綠建築溢價之萃取,將因無法有效控 制區位變數而導致難以取得準確之溢價,本研究參考Eichholtz et al.(2010)以 GIS 技 術將綠建築附近500 公尺內之成交案例劃入近鄰地區作為比較標的,選定綠建築社 區為中心分別依地區條件在新北市分別劃設13 個分區(如圖二所示),透過區位虛擬 變數進行各分區綠建築價格溢價之萃取。 圖二 各次分區之分布 圖三 各群集之分布 由於本研究之綠建築社區散落在新北市各行政區,以GIS 設立之分區內樣本數 量也因篩選的方式而有數量上的差異,且部分分區雖在地理條件上有空間座落上的 差異,但就價格水準上可被視為同一水準,可將其合併為同一集群。為使集群內的 樣本差異最小化,集群間差異最大化,本研究以二階段集群分析,以分區變數、座 標X、Y、以及單價作為分類之依據,由系統在第一階段判定所有交易資料應區分之 群集數量,而在第二階段再將所有的交易資料分入各個集群中,依此建立實證模型 中控制區域對價格之影響變數。集群分析結果如圖三及表一所示,以板橋地區(集群 2)之平均單價最高,鶯歌地區(集群 11)最低。
表一 各集群單價 單位:萬元 集群 所在地區 平均數 最小值 最大值 標準差 集群1 新店區 39.2 27.5 69.1 7.9 集群2 板橋區 65.7 45.8 91.1 8.5 集群3 板橋區 63.9 31.1 79.1 9 集群4 三重/樹林/蘆洲 41.2 30.3 67.2 7.8 集群5 三重區 38.6 28.5 51.5 3.8 集群6 新莊區 42.5 30.7 64.8 6.1 集群7 淡水區 41.2 20.7 64.9 9.4 集群8 淡水區 20.1 14.4 28.9 2.9 集群9 中和/板橋區 48.5 20.9 68.7 7.8 集群10 三峽/樹林區 25.4 14.1 36.5 4.6 集群11 鶯歌區 13.8 10.4 20.1 1.6 3. 敘述統計 101年至103年3月之交易樣本以GIS技術控制區位條件下,符合之研究樣本數為 3967筆,其中包含2418筆非綠建築交易、1549筆綠建築交易。在價格分布上如表二 所示,綠建築平均銷售單價為42.3萬,非綠建築為38萬,若單從價格面切入而不考 量其他因素,綠建築價格平均價格高於非綠築約莫一成;若將綠建築再細分為不同 等級,合格級、銅級、銀級及黃金級綠建築平均成交價格為44.8萬、48.2萬、39.2萬、 42.8萬,以銅級綠建築平均交易單價最高,銀級最低。從各等級綠建築的空間分布 情形可以發現,綠建築等級與地區平均交易水準並非正向關聯,建商並不會因為地 區價格高而選擇興建更高等級之綠建築,反之高價地區大多以合格級、銅級綠建築 為主,也導致各等級之綠建築等級之平均單價並未因等級提升而有較高的單價表 現。 表二 各等級綠標章單價 單位:萬元 樣本 數量(筆) 平均數 最小值 最大值 標準差 非綠建築交易 2418(61.0%) 38 10.4 91.1 16.1 綠建築交易 1549(39.0%) 42.3 11 89.6 16.3 合格級 488(31.5%) 44.8 11 89.3 24.4 銅級 122(7.9%) 48.2 23.3 89.6 17.5 銀級 667(43.1%) 39.2 20.5 64.9 9.2 黃金級 272(17.5%) 42.8 28.5 62.1 7.6
表三為樣本之敘述統計,從整理得知不同等級之樣本數量存在數量上之差異, 受到相關法規獎勵的影響,銀級綠建築之數量較其他等級之綠建築交易多,佔比 43.1%。就綠建築樣本特徵屬性而論,9.4%樣本以SRC、SC建造,94.7%的樣本臨路 主要道路、68.4%為預售成交案件,97.1%之交易案成立管理組織,而僅有非常小比 例的交易案並無隔;在交易日期方面,考量價格之連續性以及資料完整性,本研究 案將交易日期鎖定於實價登錄實施後之隔年,即101年1月1日至103年3月,101年共 1385筆(34.9%)、102年共2322筆(58.5%)、103年至3月之交易量共260筆(6.6%)。
表三 變數敘述統計表 變數名稱 綠建築交易 非綠建築交易 綠建築變數 樣本數 百分比 樣本數 百分比 綠建築 1549 39.00% 2418 61.00% 合格級 488 31.50% - - 銅級 122 7.90% - - 銀級 667 43.10% - - 黃金級 272 17.50% - - 特徵變數 SRC、SC 146 9.40% 171 7.10% 非SRC、SC 1403 90.60% 2247 92.90% 臨主要道路 1467 94.70% 1975 81.70% 非臨主要道路 82 5.30% 443 18.30% 預售 1060 68.40% 1554 64.30% 轉售 489 31.60% 864 35.70% 有隔間 1510 97.50% 2403 99.40% 無隔間 39 2.50% 15 0.60% 有管理組織 1504 97.10% 2002 82.80% 無管理組織 45 2.90% 416 17.20% 時間變數 101 年 364 23.50% 1021 42.20% 102 年 927 59.80% 1395 57.70% 103 年 258 16.70% 2 0.10% 區位變數 集群1 (新店區) 321 85.10% 56 14.90% 集群2 (板橋區) 98 20.40% 382 79.60% 集群3 (板橋區) 137 88.40% 18 11.60% 集群4 (三重/樹林/蘆洲) 78 53.40% 68 46.60% 集群5 (三重區) 201 95.30% 10 4.70% 集群6 (新莊區) 84 17.30% 402 82.70% 集群7 (淡水區) 130 54.40% 109 45.60% 集群8 (淡水區) 128 21.40% 471 78.60% 集群9 (中和/板橋) 140 24.30% 437 75.70% 集群10 (三峽/樹林) 155 25.80% 446 74.20% 集群11 (鶯歌區) 77 80.20% 19 19.80%
四、 實證結果
針對新北市26個綠建築社區,以綠建築社區為中心以GIS技術劃設半徑500公尺 的研究範圍後建立13個分區,再以分區虛擬變數、座標X、座標Y、扣除車位單價為 距離,透過二階段及群分析再合併建立出11個集群。以特徵價格法分別萃取出綠標 章對建築價格之影響,以及不同標章等及對價格之影響,研究結果如下: (一) 綠建築標章對價格之影響: 以特徵價格法控制各變數對價格的影響下,由表四Model 1 實證結果得知新北 市取得綠建築標章之建築平均溢價約為8%3。以屋齡角度切入綠建築溢價之維持, 整體而言新北市建築平均屋齡增加一年,平均單價約下降2.9%,若為綠建築,以屋 齡與綠建築交乘項之係數值可知,屋齡對價格之減損效果較非綠建築和緩,屋齡增 加一年,平均單價下降2.2%4,就維持價格的能力而言,綠建築之表現較非綠建築良 好。在區位變數上,各集群之係數關係符合價格層次邏輯,集群2、3、6 及 9 分別 為板橋與新莊地區,價格屬於高價地區;集群8 及集群 10 分別為淡水區及三重樹林 區,價格水準於整體樣本中屬於低價地區。 3 EXP(0.077)-1=0.08,本文之溢價率皆以方式進行係數值轉換。 4 EXP(-0.029+0.007)-1=0.022,為屋齡與綠建築交乘項係數與屋齡係數之合。表四 綠標章對價格之影響 Model 1 Model 2 自變數 係數 VIF 係數 VIF 截距項 11.853 *** 0 11.799 *** 0 綠建築 0.077 *** 3.491 合格級 0.134 *** 2.129 銅級 0.027 ** 1.224 銀級 0.047 *** 3.432 黃金級 0.077 *** 4.193 屋齡x 綠建築 0.007 * 2.274 屋齡 -0.029 *** 4.435 -0.027 *** 4.454 預售 -0.172 *** 5.311 -0.161 *** 5.334 102 年 0.126 *** 1.366 0.129 *** 1.38 103 年 0.099 *** 4.714 0.115 *** 4.867 SRC、SC 0.07 *** 1.713 0.052 *** 1.801 臨主要道路 0.008 1.288 -0.003 1.379 移轉層次 0.005 *** 1.58 0.005 *** 1.58 總樓層數 0.001 * 4.738 0.002 *** 4.886 有無隔間 -0.007 1.04 -0.004 1.041 管理組織 0.026 *** 1.33 0.02 *** 1.317 集群1 0.852 *** 6.025 0.905 *** 7.182 集群2 1.411 *** 8.597 1.447 *** 8.805 集群3 1.233 *** 4.937 1.219 *** 4.847 集群4 0.956 *** 2.704 1.01 *** 3.079 集群5 0.902 *** 6.662 0.922 *** 9.062 集群6 1.094 *** 7.421 1.135 *** 7.604 集群7 0.874 *** 4.47 0.937 *** 5.419 集群8 0.375 *** 7.711 0.399 *** 7.741 集群9 1.18 *** 7.749 1.22 *** 8.43 集群10 0.529 *** 8.081 0.574 *** 8.742 Adj. R2 0.91 0.912 F 檢定 1832.403*** 1712.038*** 註1:模型皆以 Ln 交易單價為自變數 註2:***、**、*分別表示在 1%、5%、10%的顯著水準下,以雙尾檢定拒絕虛無假設。
(二) 不同等級之綠標章對價格之影響: 將綠建築以不同等級區分溢價效果,由表四Model 2實證結果發現新北市合格級、 銅級、銀級與黃金級綠標章之溢價率分別為14.3%、2.7%、4.8%及8%。撇除合格級 綠建築之溢價率,銅級、銀級與黃金級綠建築之溢價與認知上之溢價趨勢相符,亦 即綠建築之溢價隨等級之提高而有相對應提升。細看合格級之綠建築,新北市合格 級綠建築社區有大學哈佛、世界花園-橋峰A+、昇陽府中棧、星光藝術館、悅讀MIHO、 微笑莊園、新巨蛋、碧連天及養心殿,在單價上因區位的不同而有所差異。惟部分 社區如世界花園-橋峰A+、新巨蛋及養心殿,在價格上與周邊類似之不動產有特別明 顯之差異,產品定位上為地區性高單價產品,使得在萃取綠建築溢價上無法有效掌 握,致使合格級綠建築之溢價因個案關係而有高溢價之情況產生。 (三) 綠標章對不同價格水準不動產之影響: 綠建築若以價格區間檢視溢價之程度,由表五分量模型實證結果得知在10分位、 25分位、50分位、75分位及90分位之價格水準下,綠建築之溢價率為16.8%、10.2%、 8.1%、9.1%及4.5%,皆於1%的顯著水準下拒絕虛無假設,顯示溢價程度與價格水準 呈顯著反向變動。高價區主要分布於板橋區,而低價區主要為淡水、三峽、樹林及 鶯歌區,將綠建築與價格水準相當的案例比較後顯示,綠建築在高價地區較無法突 顯綠建築之價值。 從影響價格之因素角度切入,於高價地區,區位對價格之影響比綠建築對價格 之影響更為強烈,導致不動產價格的高低主要取決於區位,綠建築的影響相對較小; 於低價地區,土地稀有度相對低,區位對價格之影響較無明顯之差異,反而建物的 特徵屬性對價格的影響較高價區有影響力。
表五 各價格水準間綠標章對價格之影響 變數 模型 0.1 0.25 0.5 0.75 0.9 截距項 11.531 *** 11.568 *** 11.73 *** 11.874 *** 12.233 *** 綠建築 0.155 *** 0.097 *** 0.078 *** 0.087 *** 0.044 *** SRC、SC -0.026 * 0.003 0.06 *** 0.099 *** 0.15 *** 臨主要道路 0.032 * 0.053 *** 0.041 *** 0.026 * 0.002 102 年 0.109 *** 0.14 *** 0.146 *** 0.12 *** 0.095 *** 103 年 -0.029 0.051 *** 0.115 *** 0.108 *** 0.13 *** 屋齡 -0.004 -0.012 *** -0.026 *** -0.023 *** -0.029 *** 預售 -0.126 *** -0.136 *** -0.137 *** -0.139 *** -0.155 *** 層次 0.005 *** 0.005 *** 0.005 *** 0.005 *** 0.005 *** 總樓層 0.005 *** 0.005 *** 0.001 -0.002 * -0.004 *** 有無隔間 0.035 0.046 * 0.044 -0.002 -0.193 *** 管理組織 0.021 * 0.057 *** 0.014 0.021 *** 0.021 * 集群1 0.715 *** 0.73 *** 0.832 *** 0.917 *** 1.004 *** 集群2 1.421 *** 1.364 *** 1.449 *** 1.46 *** 1.435 *** 集群3 1.086 *** 1.112 *** 1.311 *** 1.379 *** 1.446 *** 集群4 0.851 *** 0.827 *** 0.964 *** 1.062 *** 1.154 *** 集群5 0.969 *** 0.91 *** 0.914 *** 0.918 *** 0.894 *** 集群6 1.183 *** 1.111 *** 1.101 *** 1.117 *** 1.073 *** 集群7 0.78 *** 0.773 *** 0.91 *** 1.034 *** 1.07 *** 集群8 0.396 *** 0.387 *** 0.393 *** 0.433 *** 0.415 *** 集群9 1.102 *** 1.117 *** 1.205 *** 1.274 *** 1.242 *** 集群10 0.449 *** 0.442 *** 0.577 *** 0.62 *** 0.628 *** Adj. R2 0.731 0.74 0.724 0.707 0.683 註1:模型皆以 Ln 交易單價為自變數 註2:***、**、*分別表示在 1%、5%、10%的顯著水準下,以雙尾檢定拒絕虛無假設。 (四) 綠標章於空間溢價之關係 就整體新北市綠建築而言,平均綠建築溢價率約8%,若進一步探討不同空間地 域對綠建築價格之影響,於市中心地區選取集群2、3、6 及 9(板橋、新莊地區),郊 區選取集群8、10 及 11(淡水、三峽樹林、鶯歌地區)進行比較分析。實證結果如表 六顯示,市中心地區綠建築溢價率為4.2%,而郊區之綠建築溢價為 16.4%,綠建築 在郊區較能突顯其競價能力。分量迴歸顯示高單價地區綠建築溢價為4.5%,低單價 地區溢價16.8%,其與空間溢價實證結果相互輝映,可見綠建築在不同區域間確實 存有不同的溢價效果。
惟細看綠建築與屋齡之交乘項,市中心地區綠建築平均屋齡增加一年,對建物 每坪單價產生0.5%5之加價效果,而偏遠地區平均屋齡增加一年,對價格反而產生 4.5%6之折價效果。綠建築環保減碳及節能省水效果需要透過日常的維護方得維持, 就實證結果發現,市中心綠建築隨著屋齡上升反而價格依然維持在一定之水準,反 而偏遠地區之綠建築,相對於非綠建築反而隨著屋齡的上升而有加速折舊之狀況, 可能歸責於綠設施之維護不周,推估綠建築對郊區房價而言,廣告效果大於實質效 果。 表六 市中心與郊區綠建築之溢價 市中心綠建築 郊區綠建築 自變數 係數 VIF 係數 VIF 截距項 12.749 *** 0 11.58 *** 0 綠建築 0.041 *** 4.329 0.152 *** 3.029 屋齡x 綠建築 0.028 *** 3.014 -0.032 *** 1.697 SRC、SC 0.106 *** 2.267 臨主要道路 0.036 *** 1.24 0.095 *** 1.919 102 年 0.154 *** 1.207 0.146 *** 1.221 103 年 0.164 *** 1.697 0.237 * 1.01 屋齡 -0.023 *** 4.722 -0.012 *** 5.863 預售 -0.053 *** 6.331 -0.167 *** 7.1 移轉層次 0.004 *** 1.688 0.004 *** 1.438 總樓層數 0 6.79 0.002 * 3.509 有無隔間 0.03 1.024 0.081 * 1.019 管理組織 0.066 *** 1.287 0.023 ** 1.638 集群2 / 集群 8 0.373 *** 2.981 0.459 *** 6.539 集群3 / 集群 10 0.271 *** 4.752 0.554 *** 8.953 集群9 0.121 *** 2.226 Adj. R2 0.795 0.724 F 檢定 439.427*** 262.404*** 註1:模型皆以 Ln 交易單價為自變數 註2:***、**、*分別表示在 1%、5%、10%的顯著水準下,以雙尾檢定拒絕虛無假設。 註3:因郊區之樣本中建材為 SRC、SC 過少,此變數被系統排除。 5 EXP(-0.023+0.028)= 0.005 6 EXP(-0.012-0.032)= -0.045
五、 結論與建議
如同Eichholtz et al(2009),Pivo(2010)之研究結果,綠建築對不動產價格有一定之 影響,實證結果顯示新北市綠建築平均之溢價率為8%,除與國外文獻相互輝映外, 與陳怡璇(2011)對國內估價師之調查相符。若進一步依綠建築等級區分,合格級、銅 級、銀級與黃金級的溢價率分別為14.3%、2.7%、4.8%及8%,通過綠建築門檻的溢 價率相對何種等級之綠建築,有顯著較高的溢價率;若以價格等級做區分,低價區 至高價區綠建築之溢價率分別為16.8%、10.2%、8.1%、9.1%及4.5%,顯然綠建築低 價區之價格效果較高價地區高出許多;若以空間地域而言,市中心區域之綠建築溢 價率4.2%,遠低於郊區之溢價率16.8%,但以屋齡角度切入可發現,市中心之綠建築 長期而言較能維持其價格水準,反而偏遠地區之綠建築其折舊率較非綠建築高,可 能歸責於綠設施無良善之維護,溢價效果無法顯現。 利之所在,勢之所趨,新北市之綠建築在實證結果中有顯著的價格差異。綠建 築不論在興建過程中或是在持有營運期間,對於環境或是資源都有實質上的貢獻。 價格除了反映需求外,同時也隱含了市場上供給之狀況,綠建築在交易市場上的佔 比約,在市場的趨勢以及法規上的要求下,市場上綠建築的比例逐漸上升,而溢價 的比例也會隨供給之上升而下降,隨之在市場間取得平衡。 配合都市更新容積獎勵,新北市在過去幾年所推動之都更案件採綠建築方式興 建之數量逐年增高,但於103年4月29日發布之都市計畫法新北市施行細則後,對於 建案開發或都市更新採綠建築者容積獎勵予以限縮,例如第46條規定基地面積大於 六千平方公尺且總樓地板面積大於三萬平方公尺者,應取得候選綠建築證書及通過 綠建築分級評估銀級以上;又如第48條對於綠建築容積直接限縮,依規定取得候選 綠建築證書及通過綠建築分級評估,黃金級給予獎勵額度上限不得高於基準容積百 分之三;取得鑽石級給予獎勵額度上限不得高於基準容積百分之六。主管機關對於 建商推行綠建築的態度已從獎勵變成強制義務,認為綠建築為建築開發所需具備之 基本要求;另一方面,主管機關將綠建築部分指標變成法規之一部分,必須達到一 定之要求才可取得建造或使用執照,例如第40、43、44及56條對於綠覆率、透水率、 排水逕流平衡及植栽部分,強迫附加於建築開發審查要中,即使建案不申請綠建築 標章,亦滿足一定水準之綠化概念。此洽可與本文之研究成果相互輝映,比例最高 之合格級應為最基本要求,未來應就更高等級才給予獎勵,才能有效推動綠建築發 展,且就效用的提升才有實質助益。至於是否如同Aroul and Hansz (2012) 之研究一 般,在政府強迫興建綠建築下,綠建築仍保有一定之溢價水準,則有待未來驗證。六、 參考文獻
方嘉琳,2005,由消費者觀點探討住宅產品綠色行銷之研究,國立高雄大學都市發 展與建築研究所碩士論文。 財團法人臺灣建築中心,2012,綠建築標章、候選綠建築證書通過案件一覽表(迄 101 年7 月底),http://www.tabc.org.tw/。 陳怡璇,2011,以國外經驗探討國內綠建築價格之估算,國立臺北大學不動產與城 鄉環境學系碩士論文。 陳瑞鈴、鄭元良、林憲德、汪哲銘、周鼎金、章裕民、鄭政利、張又升、林子平、 郭柏巖、李魁鵬、黃瑞隆、黃國倉、吳麗真(編輯),2009,綠建築解說及評估手 冊,臺北:內政部建築研究所。 張桂鳳,2008,永續建築居住效益對購屋選擇之影響,住宅學報 17(1):51-70。 溫雅貴,2003,綠建築標章應用在住宅類建築接受態度之研究-以綠色消費觀點探討, 國立臺灣大學土木工程學研究所碩士論文。 劉賢樹,2003,符合綠建築基本指標之成本分析研究-以集合住宅四項評估指標為例, 國立中央大學土木工程學系碩士在職專班碩士論文。 劉彣柔,2010,大眾運輸可及性與綠建築認證對房地產價格之影響研究-以香港地 區為例,國立成功大學都市計劃學系碩博士班學位論文。 盧裕文,2011,綠建築成本分析與比較,國立成功大學土木工程學系碩士論文。 Aroul, R. R. and J. A. Hansz, 2012, “The Value of "Green": Evidence from the First Mandatory Residential Green Building Program”, The Journal of Real Estate Research,34(1):27-49
Chegut, A., P. Eichholtz and N. Kok, 2012, “Supply, Demand and the Value of Green” Buildings, RICS RESEARCH.
Eichholtz, P., N. Kok and J. P. Quigley, 2009, “Doing Well By Doing Good? An Analysis Of The Financial Performance Of Green Office Buildings In The Usa”, RICS RESEARCH.
Eichholtz, P., N. Kok and J. P. Quigley, 2010, “ Sustainability and the Dynamics of Green Building New Evidence on the Financial Performance of Green Office Buildings in the USA”, RICS RESEARCH.
Eichholtz, P., N. Kok and J. P. Quigley, 2010, “The Economics of Green Building”, Maastricht University, http://nilskok.typepad.com/EKQ3/EKQ_ Economics.pdf. Leopoldsberger, G., S. Bienert, W. Brunauer, K. Bobsin and C. Schutzenhofer, 2011,
Appraisal Journal, 79(2):115-125
Lorenz, D., S. Trück, & T. Lützkendorf, , 2006, “Exploring the Relationship between the Sustainability of Construction and Market Value-Theoretical Basics and Initial Empirical Results from the Residential Property Sector”, Property Management, 25 (2):119-149.
Chen, F. Y., I. W. Peng, and J. H. Liang, 2013, “Is ''Green'' Capitalized to Residential Property Price? Taiwan''s Evidence”, Annual Conference of European Real Estate Society, The Vienna University of Technology.
Pivo, G. and J. D. Fisher,2010, “Income , Value , and Returns in Socially Responsible Office Properties”, The Journal of Real Estate Research, 32(3):243-270
Reichardt, A., F. Fuerst, N. B. Rottke and J. Zietz, 2012, “Sustainable Building Certification and the Rent Premium: A Panel Data Approach”, The Journal of Real Estate Research, 34(1):99-126
Sirmans, G. S., D. A. Macpherson and E. N. Zietz, 2005, “The Composition of Hedonic Pricing Models”, Journal of Real Estate Literature, 13(1):3-43.
Steven, Morton, 2002, “Business Case for Green Design”, Building Operating Management, www.facilitiesnet.com/bom/Nov02/Nov02environment.shtml
行政院國家科學委員會補助國內專家學者出席國際學術會議報告
103 年 4 月 20 日 報告人姓名 陳奉瑤 服務機構 及職稱 政治大學地政系教授 時間 會議 地點 103.4.1-5 美國聖地牙哥 本會核定 補助文號 102-2410-H-004 -211 - 會議 名稱 (中文) 第 30 屆美國不動產學會年會(英文) 30th Annual American Real Estate Society Meeting 發表
論文 題目
(中文) 綠建築一定有價格溢酬嗎?-台灣經驗
(英文) Is Green Building with “Green Premium”?- Taiwan’s Evidence 一、參加會議經過
會議於美國加州聖地牙哥之Coronado Island Marriott Resort舉辦,是美國不動產相關 產學交流的盛會。會議一共有79個場次,主題包括:Bridging Academic Theory and Industry Practice、The Impact of Foreclosure and Short Sales、REITs I: Equity Market Analysis、 Brokerage/Agency: Agent Specialization and Expertise、Real Estate Investment Strategies、 Real Estate Finance、Mortgage Markets、REITs II: Corporate Governance and Firm Strategy、 Real Estate Investment、Real Estate Cycles、Appraisal/Valuation – Methodological Issues and Enhancements、Applications of Advanced Statistical Tools to Real Estate Analysis、
Government Policy & Regulation、Multifamily Housing the World – Curriculum Comparison and Learning、REITs III: Debt and Taxes、Brokerage/Agency – Strategic Issues and
Concerns、Issues in Housing Demand、Hotel/Lodging Property Analysis、Real Estate Capital Markets、Green/Sustainable Development – Office Buildings、Modeling Housing Prices and Trends、Brokerage/Agency – Performance Impacts、International Real Estate Finance & Investment、REITs IV: Risk and Return、Green/Sustainable Development – Housing and Development、Housing – The Value of Local Market Knowledge、Real Estate Market
Analysis、Amenity Valuation、REITs V: Accounting Based Issues、Mixed-Use, Industrial, and Office Property Analysis、Green/Sustainable Development – Energy and Policy Issues、 Emerging Data Analysis Techniques: Applications to Real Estate、Real Estate Portfolio Management、Infrastructure Investment and Public Private Partnerships、Urban Growth and Decline、Housing – Demand Side Issues、Corporate Real Estate、Hedging, Insurance, and Risk Management、Spatial Analysis and Applications of GIS、Securitized Real Estate、The Efficiency of Real Estate Markets等。另外,還有8場Education Track,分別對Real Estate Programs Outside the Business School: What is Needed to Call it a Real Estate Program?、 Real Estate Education Papers、Global Real Estate Education Around the World – Curriculum Comparison and Learning、Teaching Real Estate Development in an Interdisciplinary
Curriculum、The Good, the Bad, and the Tried and True – New, Old, and Out There Models of Pedagogy for Real Estate、Fulbright's, Fellows, and Funding: The International Experience、 Writing and Publishing a Successful Case and Teaching Notes以及Caucus of the Education Group等議題加以討論,以及博士生的研討會。不僅達到產學交流的目的、也有很深入 的傳承。與會人數超過350人、共發300餘篇文章,對掌握現今不動產學術發展之脈動,
附件
相當有助益。
二、與會心得
參加國際研討會可直接接觸國際知名學者,藉由文章發表可吸引國際學者對台灣 制度、不動產市場的興趣,參與本次會議主要以綠建築相關為個人關注重點,除發表 「Is Green Building with “Green Premium”?- Taiwan’s Evidence」(附件一)外,亦積極 餐與綠建築或永續不動產的各場次,與University of San Diego的Norm G. Miller、 Cleveland State University的Robert A. Simons、Central Michigan University的Spenser J. Robinson、University of Technology, Sydney的Pernille H. Christensen等,尤其Roosevelt University的Sofia V. Dermisi對本國科會專題的後續研究有很大的啟發。綠建築不動產 於國內的發展尚屬初步,歐美各國已經將其與GIS做很好的連結,尤其對綠建築價值 形成的特色有不同的認知,這是可以加以斟酌思考的。 三、建議 由於參與發表文章數量非常多,同一時段就有多個場次同時進行,難免會有遺珠 之憾,且當場提供的紙本不多,只能待會議結束後再上網繼續找文章研究。 四、攜回資料名稱及內容
30th Annual American Real Estate Society Meeting 會議內容,參見
附件一
Green Premium in Green Condo’s Building? Evidence in Taiwan
Fong-Yao Chen I-Wei Peng** Jen-Hsu Liang*** Yin-Yu Liang****
Abstract
This study investigates price effects of green technology on residential property. Disregard awareness of the importance of green building, it is argued that no green premiums are added for EEWH, a green certification in Taiwan. Besides renewal programs, developers have less incentive to build EEWH certified buildings. The hedonic regression analysis is used to estimate price premium of green label/ green feature. Result shows that price premium exist with green features but premium for green label is not significant on residential property. Moreover, low maintenance costs features have a positive impact on prices; high maintenance costs features have a negative impact on prices. In other words, maintenance cost is the main concern. Tenants prefer the features which were completed in construction and no maintenance needed during its use. The result seems to be common sense but is not consistent with the energy saving effect of green building. Except increase incentives in urban renewal, consider how to improve efficiency in the use of green building is needed in the near future.
Keywords: Green building, Hedonic Price Theory, Quantile Regression
Department of Land Economics, National Chengchi University, Taipei, Taiwan. [email protected] Contact author ** Department of Land Economics, National Chengchi University, Taipei, Taiwan.
*** Department of Land Resources, Chinese Culture University, Taipei, Taiwan. **** The Burnham-Moores Center for Real Estate, University of San Diego.
1. Introduction
The Environmentally sustainable buildings: challenges and policies by Organization for Economic Co-operation and Development (OECD) indicated that buildings around the world consume 32% of the resources, 12% of the water, and 40% of the energy. And in addition to that, they produce 40% of buried garbage (OECD, 2003). RICS (2005) founds that buildings account for at least 30% of the world’s greenhouse gas emissions, and the energy consumption is continuous after it is constructed. In order to reduce the environmental load, be compatible with the environment, and provide healthier environment for residents; many countries have put forward the concepts of green building, ecology architecture, sustainable architecture, and established sustainable real estate systems.
U.S. Green building Council (USGBC) advanced “Leadership in Energy and Environment Design” (LEED) in 1995. Up to April 2010, there were 5,384 certified office buildings, and 27,167 registered office buildings. In Taiwan, the EEWH (Ecology, Energy Saving, Waste Reduction, Health) system was established in 1999. Up to July 2013, there were only 84 residential green label certified buildings, and 179 candidate for certification. Obviously, the promotion of green building in Taiwan not as widely accepted. Developers could not see the value of green building, and consumers seem to underestimate its value to have reaction in housing price. Therefore, a negative cycle existed and a slowdown in the number of green building increased. Additionally green building related energy-saving certification has become an important factor in appraisal in foreign countries but the relationship between green building and housing price is not clear in Taiwan. Besides the floor area ratio rewards in urban renewal, Taiwanese appraiser did not experience addition to value for green building, not to mention its capitalization at market value.
In recent years, U.S. studies have found that green building is one of the factors that can be a rising factor in declination of real estate market. Literatures also showed that green building is a future trend, green label and building energy conservation will become an important factor of real estate price. Furthermore, most studies point out that green building has a positive and significant influence for price and rent. In other words, green building has benefit to health in individual level and is contributive to sustainable development in public level. Consumers "should" be cognitive, "should" be willing to spend more money to buy green building, and then green building price "should" be higher. However, does it happen in Taiwan market or not is to be further discussed. This paper will also review literatures and construct empirical model of green building on residential sales price. Finally, we analyze the results and have a conclusion.
2. Literature Review
2.1 The relationship between green building’s quantity and sales price
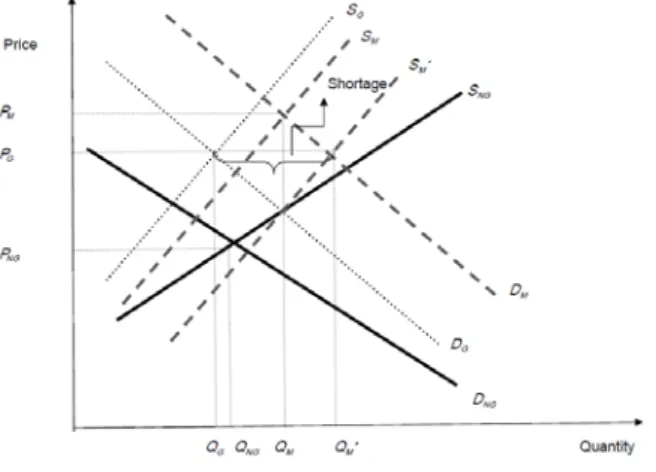
Fuerst and McAllister (2011) offered the theoretical framework for the market expected response to green features. In the initial period of promotion, the price of the green building exceeds the price of non-green building. But by the requirement and the active promotion from the government, the price of green building will go back to the fundamental. As shown in Exhibit 1, the demand curves of the Green building and non-Green building are given by DG and DNG respectively, and the supply curves are given by SG and SNG. Assume that the green and non-green are almost perfectly substituted; an increase in demand of green properties will result in decrease in demand for non-green properties. The demand increase for green properties will result in a price increase from PNG to PG and the short run inelasticity in supply results in a premium (PG-PNG) for green properties. This leads to the first research expectation that green features will result in residential transaction price premiums.
If the government has any policy to promote green building by law, demand for green properties shifts further to the right in Exhibit 1, from DG to DM. The short-term supply makes SG right shift to SM, resulting in an upward shift in prices to PM, and the equilibrium increment of the quantity is QM. The price of green properties in a promotion of green building will experience a price premium of (PM -PG) above the green properties and a price premium of (PM -PG) above non-green properties, and (PM- PNG) is the premium due to the promotion program. In the long run, the supply of the green properties will increase to SM', reducing the price of green properties to the level of PG, and the equilibrium
increment of the quantity is QM', moving the equilibrium price back to the initial (PG-PNG). Back to cases in Taiwan, the present stage here should be described that we do have the supply of the green building, but aren’t compelled to move to PG from PNG. Though the promotion has been in law for years, the price effect seems to make it a distance from PNG.
Resource: Fuerst and McAllister (2011:53)
Figure 1 Short-run effect of introducing certification into the market
2.2 The Green impact on Housing Rent/ Housing Price 2.2.1 Green Premium
The green premium mainly comes from low operating and maintenance cost. Steven (2002) indicates that the Green building can lower down the cost from the life-cycle. Moreover, the features of high-valued green buildings even recover the cost in 3-5 years. The capability to get capital back from return is due to the incentives of lower operating expenses, savings from energy and resources, certification, and subsidies. There are many papers on this realm of the price or rent impacts of green buildings, and most of them focus on commercial properties. Eichholtz et al.( 2010a, 2010b) used hedonic regression to analyze the premium among green buildings, and found that certified buildings receive rent and effective rent premiums at 3.5% and 10% respectively, and 16.8% premiums on sales price. The afterwards research on sustainability and dynamic analysis also found that certified building could raise the rent, effective rent and sales price at 1.8%, 4.7% and 13.3%.
Reichardt et al.(2012) moved on to analyze the rent of certified office buildings in the US. This paper shows that both Energy Star and LEED have the dynamic impacts on the rent, which means that earlier the building got certified, higher the rent premium was. Harrison and Seiler (2011) also found that the buildings with Energy Star or LEED could raise their rent by 6-7%. Dermissi (2009) showed empirical evidence that buildings certified with LEED could raise its sales price at 18%; Pivo (2010) also found that Energy Star-certified buildings could raise their rent and occupancy rate by 5.2% and 1.3%. Eichholtz et al.( 2013) indicated that both Energy Star and LEED have positive impacts on rent and sales price, and the impact from two systems are subtle. For instance, the empirical evidence indicated that the Energy Star labelled building could raise its effective rent and sales price at 6.6% and 12.9%, while those labelled with LEED are at 5.9 and 11.1%.
Though Wiley et al.(2010), Fuerst and McAllister(2010) and Eicholtz et al.(2010b) found out that the buildings labelled with Energy Star or LEED could obtain the premiums on rent and sales price. Nevertheless, their results have shown that the rent premiums gained from LEED are 15-17%, 4.5% and 6%, while those from Energy Star are 7~9%, 3.4% and 2%. Those labelled with LEED gain the sales price premiums are $130/sqm, 25% and 11%, while those labelled with Energy Star gain $30/sqm, 18% and 13%. It’s obvious to see that Energy Star performs better then LEED if we only consider the premium from rent or sales price. When it comes to the occupancy rate, it is higher to those labelled with LEED than those with Energy Star.(Fuerst and McAllister, 2010, 2011) As for those dual-labelled buildings, the positive impact on the rent or sales price is much more significant. Fuerst and McAllister(2010) indicates that those dual-labelled buildings’ rent premium is 9~10%, and sales premium is 28~29%;Fuerst et al.(2012) then found that premium on sales price is 11%.
Besides focusing on Energy Star and LEED, there are researches from other green certificate systems. Chegut et al.(2010) showed the average rent premium of the office building is 16-20% if the building is certified by BREEAM (Building Research Establishment Environmental Assessment Methodology) in UK. Chegut et al.(2012) found out that rent and green labels are in positive correlation, the rent premium of the building with BREEAM labelled is 30.5%, and the premium of sales price is 38%. Newell et al.(2011) analyzed the commercial building certified by NABERS(National Australian Built Environment Rating System) in Australia, the result showed that those buildings could raise rent and sales price up 0.3% and 1.9% respectively. Fuerst et al.(2012) also pointed out that it could perform better and receive positive premium if the building obtains the EPC (Energy Performance Certificates) from EU.
On residential buildings, Aroul and Hanzs(2012) found out that Green buildings receive 2% premium on sales price. And when disaggregated into mandatory and voluntary green transactions, the respective premiums are 5% and 1%. Deng et al. (2012) examined the average green premium on rent and sales price are 4-6% and 14-21% respectively. Many studies support the idea that the green certificated buildings would make the house price higher. (Australian Bureau of Statistics, 2007; Fuerst et al., 2013) It comes with different levels of premium according to different level of green levels. Brounen and Kok (2011) indicated that, compared to buildings rated D, the premium estimated for A, B and C are 10%, 5.5% and 2.5% respectively. And for dwellings rated E, F and G, the estimated discounts are 0.5%, 2.5% and 5% respectively. Kok and Kahn (2012) found that the label of Energy Star puts positive impact on house price. However, impact from LEED is not significant. Miller et al.(2008) also shows that the green buildings hold no significant premium on sales price.
2.2.1 Green Noise
The main obstacles to promote green building are high cost in the initial stage, tenants’ cognitive deficits of green, as well as insufficient education, knowledge and research. In addition, developers with no relative experience in green building know not much about green’s risk, cost, benefit and value. Many would perhaps assume negative impact on the sales price. Leopoldsberger (2011) examined the appraisal of the cost-saving buildings in German. The result showed that both maintenance cost and energy cost are significantly negatively correlated to rent, which indirectly pointed out that the green effect from maintenance and energy-saving do not necessarily have the positive impact on rent. Fuerst and McAllister(2011) examined the effect of EPC rating on market value and market rent by 708 commercial properties in UK, including 23 BREEAM certified. They found no significant effect of EPC rating on market rent and market value, and there was significantly negative impact at the 10% level for BREEAM certified building.
Yoshida and Sugiura(2012) analyzed how the green label affect the sales price of the residential buildings in Tokyo. They obtain a total sample of 34862 sales of condominiums, concluding 1472 samples evaluated under Tokyo Green Building program. The empirical result pointed out green-labelled buildings exist a 5% discount on the price. They tried to explain this phenomenon and came up with the inference that the discount is the refection of the extra expense on the maintenance. Precisely speaking, besides the design for reducing heat island effect and longer building economic life that could lower renewal cost which reduce the discount; other green features like planting, green building materials, and the water circulation will make the sales price discounted due to extra maintenance cost and capital investment.
McAllister(2013) reviewed 29 literatures for green building. Most used hedonic regression to analyze the green impact on price, and commercial property is the main objects. Chen (2011) interviewed 120 Taiwanese appraisers and indicated that 87% of the appraisers agreed that green label would theoretically have positive impact on the sales price, 66% of the appraisers are conceived positive impact will be shown on the market, and most of them consider the impact to be around 10% of the price. There is a lack of empirical study in Taiwan on this subject due to lack of transparency for green related information. Therefore, we focus on a closed area to have a field survey to obtain data of green label and green features. This is the first empirical study to analyze the impact of both EEWH label and green features on sales price in Taiwan.
2.2.3 EEWH in Taiwan
According to "Plan of Green building and Residential Environment", issued by EEWH established in 1999, include nine categories:
a. Biodiversity: increasing the ecological quality of green space on large sites, such as: natural banks and community green network system;
b. Greenery: global warming mitigation and green landscaping, such as: atrium garden, balcony garden, or green walls;
c. On-site Water Retention: the capacity of the site to retain, store and filter rainwater by direct infiltration, pervious pavement, and green roof;
d. Energy Saving: reduce the large daily consumption by using sun shading design and energy saving lights;
e. CO2 Reduction: reduce the amount of carbon dioxide emitted from production and transportation of construction materials by improving the design of building structure, such as: expose AC pipework and use of light steel frame partitioning;
f. Construction Waste Reduction: the use of renewable resources, such as: recycled building materials and dry walls;
g. Indoor Environment: divided into the following four areas- acoustic environment, lighting, ventilation and interior finishing. Example such as: use of natural and green interior finishing materials, maintain clean indoor air, use of ecology coating, and noise and vibration control; h. Water Resource: active reuse of rainwater and non-drinking water, such as: water-efficient
appliance and incorporate water recycling system;
i. Sewage and Garbage Improvements: including garbage room, refrigerating, freezing or pre-compression treatment facilities for garbage, and rain and sewage diversion.
Green label is rank as “Diamond”, “Gold”, “Silver”, “Bronze” and “Qualified”. However green label is non-mandatory registration, we could not get enough ranked samples to have an empirical study. Therefore we put it together and set a dummy variable to discuss whether green labelled or not. Moreover, we want to analyze more on price effect of green building in Taiwan. To deeper investigate green on sales price, we also analysis the price effect of green features as Yoshida & Sugiura(2012). We refer to the above catagories to choose green features variables, such as atrium garden, balcony garden and green roof, pervious paving, infiltration ponds, sun visors, energy saving lights, reuse of rainwater, refrigerating, freezing or pre-compression treatment facilities for garbage, drainage pipeline, exposed electrical, gas and communication lines, and the use of light steel frame partitioning.
Our hypothesis is as following,
1. “Green label” is capitalized into housing prices. 2. “Green features” are capitalized into housing prices.
3.Methodology 3.1 The Model
Hedonic regression model was adapted to analyze the effect of Green Building features as most literatures (Aroul and Hansz, 2012;Chegut et al., 2012). Besides normal building attributes, Green label is added as shown in Model (1) and Green features is added in Model (2). After trial and error, we find linear regression suits better for this study.
In the equations, α0 is the constant term, εi is assumed to be the residuals that comply with normal
distribution, and the expected value of the error term is 0. The dependent variable is sales price. Independent variables Xji are the jth physical characteristics of ith sample. The variables include
transaction year, transaction floor, building size, age and shape. In the model, GFgi indicates dummy
variable where value equals 1 when gth feature implemented and 0 when it is not. 3.2 The data
This paper selected the Taipei University designated area for spatial extent. The region is relatively concentrated and the projects have higher likelihood for implementing green features. 359 transactions are recorded at the Interior Ministry from 2008 to 2012. The average sales price is 811.74 million, with standard deviation of 411.17 million and range between minimum of 2.2 million and maximum of 34 million. Average building size is 42.9 pings (1526 sqft) with minimum of 14 pings (498 sqft) and maximum of 108 pings (3842 sqft); standard deviation is 15.08 pings (536.5 sqft). The average building age is 3.23 years with standard deviation of 1.89 years. It is a new building development area.
Our information on Green label is cases approved by Taiwan Architecture and Building Center. 46 cases, or 12.74% of our data pool, are licensed Green label transactions.
As for the "green" impact on sales price, since design is more convenient for tenants and most literatures show positive effects, our expectation of its impact is positive. The impact of green feature depends on the maintenance and management of long-term benefits. We expect a negative impact in atrium garden, balcony garden, permeable paving, green roof, garbage room and refrigerated garbage storage device due to high maintenance frequency and cost. The feature with low maintenance frequency and cost, infiltration ponds, sun visors, energy saving lights, exposed pipework, light steel frame partitioning, recycled building materials, natural interior finishing materials and water-efficient appliance is expected to have a positive impact on the sales price. The statistical result of green feature in 51 cases is as Exhibit 1. The top three were atrium garden, garbage room and energy saving lights.
Exhibit 1 Statistical result of green feature in cases and samples Green feature Cases with (total 51 cases) % with (total 359 samples) atrium garden 46 98% balcony garden 11 16% permeable paving 24 43% infiltration ponds 27 53% green roof 2 1% sun visors 7 10% energy saving lights 40 78% accessible M&E system 23 37% light steel frame 27 50% recycle materials 15 18% natural materials 14 21% water‐efficient appliances 37 62% garbage room 41 80% refrigerated garbage storage device 19 37%
4. Empirical results
4.1 The cognition of green label and green feature on sales price
We conducted a questionnaire survey supplemented with illustrative images in March 2013. We ask households to express their cognition of green label / green feature on the sales price and the maintenance cost by "strongly agree", "agree", "neutral", "disagree", and "strongly disagree". Finally, we got 103 effective questionnaires.
Most of all the people interviewed agreed that green label and green feature will rise up sales price. There are 72% respondents agreed with green label would make sales price rising, and 63% for green feature. (See Exhibit 5) It seems to be more recognition of the impact of green label. Furthermore, we do the Paired-Samples T Test to test the difference between these two. The result showed a significant difference between green label and green feature in the 95% confidence interval. It means the cognition of green label impact on the sales price higher than the one of green feature.
Exhibit 5 Positive cognition of green label/green feature on sales price
Item strongly disagree
disagree neutral agree strongly agree Green label will make sales price up 0% 7% 21% 53% 19% Green feature will make sales price up 0% 5% 32% 50% 13%
Further, we did a survey to understand the cognition of green feature on sales price and maintenance cost, the impact is scaled from 0 to 9 points where 0 for no effect and 9 for greater impact. The statistical results are shown in Exhibit 6. Those surveyed consider features such as garbage room, garbage freezing facilities and atrium garden having greater impact on sales price; exposed pipework, light steel frame partitioning and permeable paving having less impact on sales price. As for impact on maintenance cost, garbage freezing facilities, atrium garden and garbage room have higher impact; while light steel frame partitioning, exposed pipework, permeable paving and recycled building materials have relatively lower impact. We see respondents believe features that have higher effect on sales price also comes with higher maintenance cost. Though green features raise maintenance cost, most have greater increase for sales price. More than 60 percent of respondents agree that green features will yield higher sales price.
Is there a cognitive different between the impact of sales price and maintenance cost? In the last column of Exhibit 6, the t-value found at 5% significance level, shows significant impact of garbage room, green interior finishing materials, recycle materials, water-efficient appliance and light steel frame partitioning. These green features are built-in upon completion of the structure with low maintenance frequency/cost, long-lived economic facilities; which is in line with existing homebuyer's expectations. Only three cognitions are negative, which are: balcony garden, energy saving lights, exposed pipework. However they are statistically non-significant.
Exhibit 6 Residents’ cognition of green feature
Green feature Impact on sales price
Impact on
maintenance cost
Impact on sales price and maintenance cost average rank average rank average t-value garbage room 6.09 1 4.98 3 1.107 4.786 refrigerated garbage device 5.89 2 5.59 1 0.301 1.127 atrium garden 5.57 3 5.32 2 0.252 1.204 natural materials 5.4 4 3.9 8 1.495 5.627 green roof 5.05 5 4.88 5 0.165 0.594 water-efficient appliance 5 6 4.15 7 0.854 3.049 recycle materials 4.72 7 3.55 11 1.165 4.206 balcony garden 4.7 8 4.97 4 -0.272 -1.12 energy saving lights 4.53 9 4.82 6 -0.282 -1.035 sun visors 4.02 10 3.76 10 0.262 1.135 infiltration ponds 3.9 11 3.79 9 0.117 0.452 permeable paving 3.63 12 3.55 11 0.078 0.322
light steel frame 3.53 13 2.9 14 0.631 2.61 exposed
pipework 3.42 14 3.54 13 -0.126 -0.528 Note: t-value shaded indicates significance at the 5% level
4.2 Impact on sales price
4.2.1 Empirical analysis of green label on sales price
Previous result shows the resident’s cognition of green labels and features. How do they impact sales price? Firstly, we add a dummy variable for green label to regression (model 1). The results display in Exhibit 7, which Adjust R² is 0.902. The other building attribute variables beside green label are significant at the 1% level. However, the impact on sales price is not significant if it is green label. Age coefficient is negative while other factors are positive. The time variables, in 2010, 2011 and 2012, were significant and coefficient is positive. The result makes sense.
The total turnover of the study sample ranged between NT$ 2.2 to 34 million, which is fairly wide. To understand whether there are differences in level of sales price, quantile regression is used. This study is limited to the number of samples; excluding 0.9 components analysis, build only 0.1, 0.25, 0.5 and 0.75 components. Empirical results are shown in Exhibit 7, each of the components of the coefficient of determination were 0.622, 0.654, 0.688 and 0.733. The higher sub bits indicate better fit of the model. Except for q10, most are at 10% level of significance. This result meets expectations, and higher price having greater impact. The green label certification will be able to play a bonus effect. The total price of NT$ 5.7 million is a threshold of providing green building.
Exhibit 7 Empirical result of OLS and Quantile (add green label variable) OLS q10 q25 q50 q75 variable (46 M) (57 M) (70 M) (925 M) Constant -357.41*** (-9.91) -216.76*** (-5.44) -180.38*** (-5.55) -214.04*** (-4.16) -232.46*** (-3.59) Shape 49.76*** (2.93) 76.86*** (3.3) 64.51*** (4.72) 42.68*** (2.99) 30.09* (1.82) floor 4.95*** (3.72) 6.31*** (4.18) 4.26*** (3.02) 4.44*** (2.99) 2.48 (1.37) 1st floor 355.12*** (4.65) 287.49** (2.02) 225.71* (1.66) 305.64* (1.75) 544.14*** (2.71) Building size 22.30*** (44.65) 16.39*** (20.95) 17.71*** (34.5) 19.52*** (21.55) 21.58*** (17.67) Q98 -29.70 (-0.93) -22.51 (-0.64) -69.77* (-1.88) -18.70 (-0.69) -3.93 (-0.13) Q99 69.67** (2.44) (1.47) 50.62 (1.37) 32.40 72.73*** (3.57) 72.11*** (3.53) Q100 223.76*** (8.04) 163.33*** (4.47) 155.00*** (6.08) 226.14*** (10.33) 215.13*** (7.2) Q101 399.69*** (13.47) 324.64***(9.37) 299.57***(15) 391.75***(15) 399.68*** (15.47) Age -14.20*** (-3.03) -13.17** (-2.09) -11.91*** (-2.76) -21.91*** (-4.14) -21.22*** (-4.77) Green label (1.44) 33.63 (0.89) 28.80 46.54** (2.22) 47.42*** (2.66) 48.87* (1.79) Adjust R² 0.902 0.622 0.654 0.688 0.733
Note: ∗∗∗ indicates significance at the 1% level; ∗∗ indicates significance at the 5% level;∗ indicates significance at the 10% level.
4.2.2 Empirical analysis of green feature on sales price
In Exhibit 8 we add dummy variables and green features in regression model, which Adjust R² is 0.919. The result of other variables is similar to model 1. Significant variable includes balcony garden, permeable paving, green roof, exposed pipework, light steel frame partitioning and natural interior finishing materials. In descending order for influences, significant negative variable are green roof, balcony garden and permeable paving, which are classified to high maintenance facility. Their coefficients are -180.112, -75.321 and -36.93.
On the other hand, in descending order the significant positive variable are light steel frame partitioning, natural interior finishing materials, exposed pipework. These are put into the construction period without regular maintenance of facility, which has a positive impact on house prices. Their coefficients are 113.196, 91.874 and 86.45. In other word, people prefer the green feature which has high initial investment costs and low maintenance cost in future economic life.