國
立
交
通
大
學
管理科學系
碩
士
論
文
訊息正反性和產品正反性的交互作用對消費者認
知、態度、購買意願的影響
The Interactive Effect of Message Framing and Product Type on
Cognition, Attitude, Purchase Intention
研 究 生:許毓貞
指導教授:張家齊 博士
訊息正反性和產品正反性的交互作用對消費者認知、態度、購買意願的影響
The Interactive Effect of Message Framing and Product Type on Cognition,
Attitude, Purchase Intention
研 究 生:許毓貞 Student:Hsu Yu Chen
指導教授:張家齊博士 Advisor:Dr. Chia-Chi Chang
國 立 交 通 大 學
管理科學系
碩 士 論 文
A Thesis
Submitted to Department of Manangement Science College of Management
National Chiao Tung University in Partial Fulfillment of the Requirements
for the Degree of Master
in
Business Administration June 2007
訊息正反性和產品正反性的交互作用對消費者認知、態度、購買
意願的影響
研究生:許毓貞 指導教授:張家齊博士國立交通大學管理科學系(研究所)碩士班
中文摘要
本研究旨在研究訊息正反性和產品正反性對消費者認知、態度、購買意願
的影響。本研究為一 2x2 的實驗設計:獨立變數為訊息正反性、調節變數
為產品正反性,而相依變數為認知、態度、和購買意願。研究分析方法則
採用多變量變異數分析法(
multivariate ANOVA)。
本研究的四個主要研究發現為:
1. 訊息正反性和產品正反性的交互作用對廣告效果有顯著影響。
2. 對正面產品的廣告效果而言,正面訊息顯著地優於負面訊息。
3. 對負面產品的廣告效果而言,正面訊息和負面訊息沒有顯著性的差
異。
4. 對現在擁有正面產品的人來說,正面訊息顯著地優於負面訊息;對
現在沒有擁有正面產品的人來說,正面訊息和負面訊息沒有顯著性
的差異。
The Interactive Effect of Message Framing and Product Type on
Cognition, Attitude, Purchase Intention
Student:Hsu Yu Chen Advisors:Dr. Chia-Chi Chang
Master of Business Administration
National Chiao Tung University
ABSTRACT
This research aims to understand the interactive effect between advertising appeals and product types on consumers’ cognition, attitude, and purchase intention. This research applies a 2*2 design—advertising appeals (positive and negative) serve as independent variables, product types (2 positive and 2 negative products) serve as moderators, and cognition, attitude, purchase intention serve as dependent variables. Eight different advertisements were designed to fit in this experiment. The main analysis method of this research is multivariate ANOVA. There are four main findings of this research:
1. The interactive effect between advertising appeals and product types on advertising effectiveness is significant.
2. For positive products, positive appeals are significantly more effective than negative appeals.
3. For negative products, there is no significant difference between positive and negative appeals.
4. For people who own positive products now, positive appeals are significantly more effective than negative appeals.
誌 謝
在交大管科所的這兩年以來,影響我最大的一件事,就是能夠成為家齊老師的門 生。在課程上,選修老師所開授的專業銷售管理和消費者行為,讓我能夠自動自發地預 習和複習所學的知識,讓我能夠和老師以及外國來的同學一起在課堂上討論,進而磨練 自己的膽量、建立自己的信心;在論文寫作上,老師嚴格地要求邏輯上的推理,期勉學 生主動自己尋找問題、解決問題,讓我學習到不管做什麼事都要秉持著主動、認真的態 度;在未來的道路上,老師更進一步鼓勵我前往荷蘭求學、指導我英文寫作的訣竅,讓 我能夠順利獲得去荷蘭當交換學生的資格;在待人處世上,老師也經常指示我要為人寬 厚、正面思考,對我的一生受用無窮。家齊老師,謝謝您,您真是我生命中的貴人!! 謝謝昭璇,崇孝,Max,Roger,怡樺,在撰寫論文的這一年,特別慶幸有這些同門 夥伴的陪伴,大家一起提出問題、討論問題、解決問題,讓這條艱辛的路不僅不再孤單, 也能時常充滿了許多歡樂。另外,特別感謝康家寧同學,百忙之中抽空幫我設計廣告, 謝謝! 最後,謝謝我的父母給我一個溫暖的家,讓我能夠順利地求學;謝謝我的姊姊給我 的鼓勵,讓我有信心前往荷蘭求學;謝謝我的男友韋誠,不管在什麼情況下,總是給我 100%的支持。謝謝我的家人,我愛你們!! 交通大學 管理科學研究所 許毓貞目錄
中文摘要 ... i ABSTRACT ... ii 誌謝... iii 目錄... iv 表目錄 ... vii 圖目錄 ... ix Chapter 1 Introduction... 1 1.1 Background... 1 1.2 Research Motivation... 2 1.3 Research Objectives ... 2 1.4 Research Structure... 3Chapter 2 Literature Review ... 5
2.1 Positive and negative appeals --Independent variables ... 5
2.1.1 Definition of positive appeals ... 6
2.1.2 Definition of negative appeals... 6
2.2 Positive and negative products—Moderators... 8
2.2.1 Definition of positive products... 8
2.2.2 Definition of negative products... 9
2.3 Dependent Variables-- Cad、Cb、Aad、Ab、PI ... 11
2.3.1 Cad (Advertisement cognition) and Cb (Brand cognition)... 11
2.3.2 Aad (Attitude toward the advertisement) ... 12
2.3.3 Ab (Attitude toward the brand) ... 12
2.3.4 PI (Purchase Intention)... 12
2.4 The ELM Model, the DMH Model, and the Kano Concept ... 13
2.4.1 The ELM Model... 13
2.4.2 The DMH (Dual Mediation Hypothesis) ... 15
2.4.3 The Kano Concept... 16
2.5 Hypotheses ... 17
Chapter 3 Research Methodology ... 23
3.1 Conceptual Research Framework ... 23
3.2 Sampling plan ... 23
3.3 Data collection ... 24
3.4 Measures ... 24
3.4.1 Cad (Advertisement cognition) and Cb (Brand cognition)... 24
3.4.2 Aad (Attitude toward the advertisement) ... 25
3.4.3 Anticipated satisfaction ... 25
3.4.4 Prepurchase Satisfaction... 26
3.4.5 PI (Purchase Intention)... 27
3.5 Data Analysis Method... 27
3.6 Manipulation Check... 27
3.6.1 Product strength... 28
3.6.2 Results of Product strength ... 29
3.6.3 Appeal Strength ... 29
3.6.4 Results of Appeal Strength... 31
3.7 Pretest... 32
Chapter 4 Research Analysis and Results... 33
4.1 Background of Respondents ... 33
4.2 Reliability and Validity of the Results ... 33
4.2.1 Reliability Analysis ... 33
4.2.2 Validity Analysis ... 33
4.3 Analysis of Results ... 39
4.3.1 Correlation Analysis between Different Construct ... 39
4.3.2 Regression Analysis ... 39
4.3.3 Chi-square Analysis ... 40
4.3.4 MANOVA, ANOVA, and Independent-Sample T Test ... 42
4.3.5 ANOVA for Demographic Variables... 53
4.4 Results of the Tested Hypotheses ... 61
Chapter 5 Conclusion, Limitation, and Future Research ... 62
5.1 Discussion ... 62
5.1.1 Summaries of the findings... 62
5.1.2 Cad and Cb ... 62
5.1.3 Aad and Ab... 63
5.1.4 Anticipated Satisfaction, Prepurchase Satisfaction, and Purchase Intention ... 63
5.1.5 Negative Appeals Work Better for Negative Products? ... 64
5.2 Implications... 64
5.2.1 Different Marketing Strategy ... 64
5.2.2 Product Life Cycle... 65
5.3 Limitations and Directions for Future Research... 65
5.3.1 Limitations... 65
5.3.2 Directions for Future Research... 66
Reference ... 68
Appendix Ⅰ ... 71
Appendix Ⅱ ... 73
Manipulation check 1: Product strength of negative product ... 73
Appendix Ⅲ Manipulation check 2: appeal strength ... 75
Appendix Ⅳ ... 79
Official Survey ... 79
Appendix Ⅴ ... 85
Advertisements ... 85
Appendix Ⅵ ... 93
Comparison for Product Strength... 93
Appendix Ⅶ ... 94
Comparison for Positive and Negative Appeals for Each Product... 94
Appendix Ⅷ ... 95
MANOVA for Negative Products (Now*Appeal)... 95
Appendix Ⅸ ... 96
MANOVA for Positive Products (Future*Appeal)... 96
Appendix Ⅹ ... 97
表目錄
TABLE 1.1REVENUE OF TOP FIVE MEDIA...2
TABLE 2.1ADVERTISEMENT APPEALS...6
TABLE 2.2NEGATIVE INDUCEMENTS...7
TABLE 2.3POSITIVE PRODUCTS BASED ON DIFFERENT INVOLVEMENT...8
TABLE 2.4MEASURING CONSUMER INVOLVEMENT PROFILES...9
TABLE 2.5NEGATIVE PRODUCT CATEGORIES...10
TABLE 2.6NEGATIVE PRODUCTS BASED ON DIFFERENT INVOLVEMENT... 11
TABLE 2.7COGNITIVE RESPONSE CATEGORIES... 11
TABLE 2.8THE DEFINITION OF AAD...12
TABLE 4.1DEMOGRAPHICS OF RESPONDENTS...34
TABLE 4.2RELIABILITY ANALYSIS FOR 5 CONSTRUCTS...35
TABLE 4.3FACTOR ANALYSIS...36
TABLE 4.4GOODNESS-OF-FIT INDEX OF CFA...37
TABLE 4.5LOADING OF CFA ...37
TABLE 4.6PEARSON CORRELATION COEFFICIENT (FIVE DEPENDENT VARIABLES)...39
TABLE 4.7REGRESSION OF PURCHASE INTENTION...40
TABLE 4.8CAD FOR POSITIVE PRODUCT...40
TABLE 4.9CB FOR POSITIVE PRODUCT...41
TABLE 4.10CAD FOR NEGATIVE PRODUCT...41
TABLE 4.11CB FOR NEGATIVE PRODUCT...41
TABLE 4.12MANOVA...42
TABLE 4.13ANOVA FOR FIVE DEPENDENT VARIABLES...43
TABLE 4.14CONTRAST RESULTS OF AAD...44
TABLE 4.15AAD OF EACH PRODUCT...45
TABLE 4.16CONTRAST RESULTS OF AB...45
TABLE 4.17AB OF EACH PRODUCT...46
TABLE 4.18CONTRAST RESULTS OF ANTICIPATED SATISFACTION...47
TABLE 4.19ANTICIPATED SATISFACTION OF EACH PRODUCT...48
TABLE 4.20CONTRAST RESULTS OF PREPURCHASE SATISFACTION...49
TABLE 4.21PREPURCHASE SATISFACTION OF EACH PRODUCT...50
TABLE 4.22CONTRAST RESULTS OF PURCHASE INTENTION...50
TABLE 4.23PURCHASE INTENTION OF EACH PRODUCT...52
TABLE 4.24MANOVA(OWING THE POSITIVE PRODUCT *ADVERTISING APPEAL)...53
TABLE 4.25ANOVA FOR FIVE DEPENDENT VARIABLES...54
TABLE 4.26CONTRAST RESULTS OF AAD(HAVE*APPEAL)(POSITIVE PRODUCT) ...54
TABLE 4.27CONTRAST RESULTS OF AB (HAVE*APPEAL)(POSITIVE PRODUCT)...56
PRODUCT)...57
TABLE 4.29CONTRAST RESULTS OF PREPURCHASE SATISFACTION(HAVE*APPEAL)(POSITIVE PRODUCT)...58
TABLE 4.30CONTRAST RESULTS OF PURCHASE INTENTION (HAVE*APPEAL)(POSITIVE PRODUCT)...60
TABLE 4.31RESULTS OF THE HYPOTHESES...61
TABLE 5.1SUMMARY OF THE FINDINGS (ADVERTISING APPEAL* PRODUCT TYPE) ...62
TABLE 5.2SUMMARY OF THE FINDINGS (ADVERTISING APPEALS*“HAVE IS OR NOT”)...62
圖目錄
FIGURE 1.1ADVERTISEMENT VALUE...1
FIGURE 1.2RESEARCH STRUCTURE...3
FIGURE 1.3RESEARCH FLOW...4
FIGURE 2.1ELABORATION LIKELIHOOD MODEL OF PERSUASION...14
FIGURE 2.2ATTITUDE TOWARDS THE AD AS A MEDIATOR...15
FIGURE 2.3KANO CONCEPT...16
FIGURE 2.4KANO CONCEPT (ATTRACTIVE QUALITY ATTRIBUTE) ...20
FIGURE 2.5KANO CONCEPT (MUST-BE QUALITY ATTRIBUTE)...22
FIGURE 3.1CONCEPTUAL RESEARCH FRAMEWORKS...23
FIGURE 4.1CFA ...38
FIGURE 4.2ATTITUDE TOWARD THE ADVERTISEMENT...44
FIGURE 4.3ATTITUDE TOWARD THE BRAND...46
FIGURE 4.4ANTICIPATED SATISFACTION...47
FIGURE 4.5PREPURCHASE SATISFACTION...49
FIGURE 4.6PURCHASE INTENTION...51
FIGURE 4.7ATTITUDE TOWARD THE ADVERTISEMENT...55
FIGURE 4.8ATTITUDE TOWARD THE BRAND...56
FIGURE 4.9ANTICIPATED SATISFACTION...58
FIGURE 4.10PREPURCHASE SATISFACTION...59
FIGURE 4.11PURCHASE INTENTION...60
Chapter 1 Introduction
1.1 Background
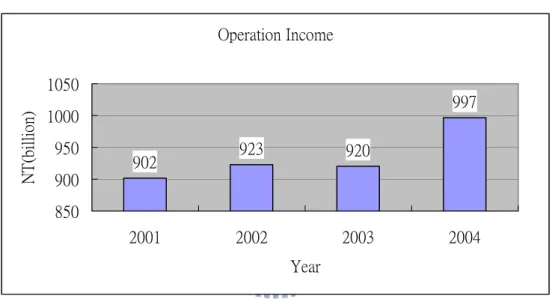
Thousands of new products are launched in the market in every single day. Advertisements seem to be the most popular way for sellers to promote their products, to raise consumer awareness, and finally get to the purchasing stage. That is why the money spent on advertisements is increasing every year. The following is a plot of advertisement value in Taiwan from 2001 to 2004.
Figure 1.1 Advertisement Value Operation Income 902 923 920 997 850 900 950 1000 1050 2001 2002 2003 2004 Year NT (b illio n)
Source: Government Website
(http://2k3dmz2.moea.gov.tw/gnweb/news/hot_html/ente94Q1.htm)
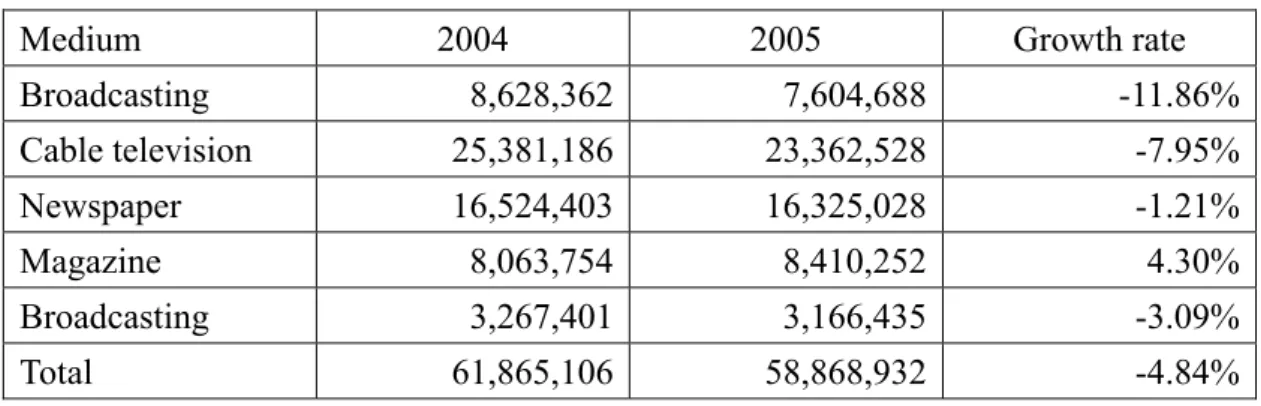
However, owing to the difference of product nature and target market, advertisement must be designed fittingly and the type of media must be chosen wisely. This research chooses print advertisement in magazines as the medium because it is the only one with positive growth rate among the top five types of media in Taiwan. (see Table 1.1)
Table 1.1 Revenue of Top Five Media
Medium 2004 2005 Growth rate
Broadcasting 8,628,362 7,604,688 -11.86% Cable television 25,381,186 23,362,528 -7.95% Newspaper 16,524,403 16,325,028 -1.21% Magazine 8,063,754 8,410,252 4.30% Broadcasting 3,267,401 3,166,435 -3.09% Total 61,865,106 58,868,932 -4.84% Period : 2005/0101~2005/12/31
Product category:All (Unit: thousands) Cite form: Rainmaker˙XKM International Corp.
1.2 Research Motivation
In the past, marketers believed that it could not be wrong to use positive appeals in their advertisements, but there are more and more negative appeals used now. The motivation of this research was elicited by seeing some negative appeals of beauty products and reading some beauty related paper (Bloch and Richins 1992; Amanda B Bower and Landreth 2001; Leeuwen and Macrae 2004), and then the issue was expanded to how the compatibility between product types (positive/ negative products) and advertising appeals (positive/ negative appeals) could influence the effectiveness of advertisements.
1.3 Research Objectives
The objective of this research is to find the compatibility between the product types (positive/ negative products) and the advertising appeals (positive/negative appeals), which could lead to more effectiveness in advertising. It is a practical issue that all the marketers would like to know, since everyone wants to know the secret formula to make their products profitable.
1.4 Research Structure
This research includes five chapters, and the outline of each chapter is as followings:
Chapter One introduces the research background, research motivation, research objectives, and the research structure.
Chapter Two reviews the antecedent literatures relevant to this research. It contains positive and negative appeals, positive and negative products, the ELM Model, the DMH Model, the Kano concept, cognition, attitude, purchase intention, and the hypotheses. In this research, the appeals will serve as independent variable, the products as moderators, and the cognition/attitude/purchase intention as dependent variables.
Chapter Three illustrates how the experiment is designed and the data is collected. It presents a conceptual research framework, sample selection, data collection, measurements, data analysis method, manipulation check, and pre-test.
Chapter Four examines the hypotheses and shows the statistical results of this research. It includes reliability analysis, factor analysis, correlation analysis, regression analysis, MANOVA, ANOVA, and Independent-Sample T Test. With this information, we could compare the differences and figure out what the factors behind the phenomenon are.
Chapter Five summarizes the findings, describes the limitation of this research and provides suggestions for future researches.
The theoretical framework is as followings:
Figure 1.2 Research Structure Advertising appeals (positive / negative appeals) Product type
(positive / negative products)
Advertisement and brand cognition (Cad, Cb), Attitude toward advertisement and brand (Aad, Ab)
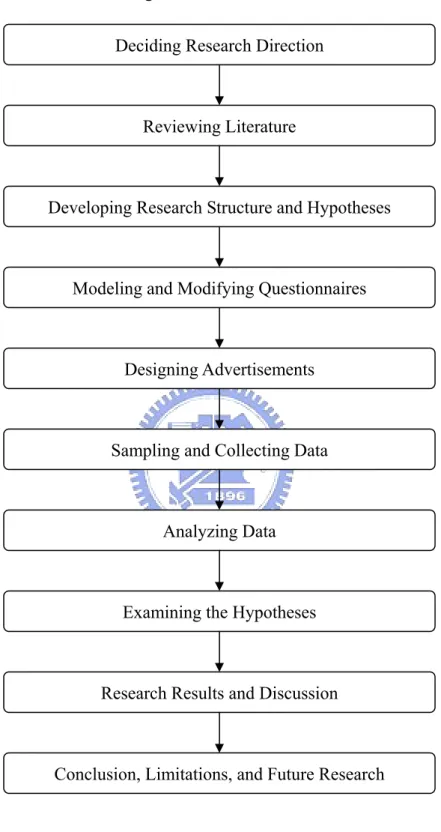
The research flow is as followings:
Figure 1.3 Research Flow Deciding Research Direction
Sampling and Collecting Data
Analyzing Data
Examining the Hypotheses
Research Results and Discussion
Conclusion, Limitations, and Future Research Reviewing Literature
Developing Research Structure and Hypotheses
Modeling and Modifying Questionnaires
Chapter 2 Literature Review
Many literatures discuss how positive advertising appeals and messages in advertisement are more effective than negative ones. On the other hand, some empirical studies have found that certain products and services, like insurance, are more effective using a negative tone. This research attempts to find whether there is a relationship between positive/negative products and appeals, which could make advertisements more effective.
This literature review consists of four parts. The first defines positive and negative products. The second defines positive and negative appeals. The third defines the dependent variables—Cad, Cb, Aad, Ab, and PI. The forth illustrates the ELM (Elaboration Likelihood Model), the DMH (Dual Mediation Hypothesis), and Kano Concept which are relevant and used in this research. The final part discusses the logic of the hypotheses.
2.1 Positive and negative appeals --Independent variables
In advertisements, advertisers decide what kind of appeals to use, which turns out different perceptions and responses from consumers. The following is a table of the advertisement appeals in research (Ho 2002).
Table 2.1 Advertisement Appeals
Scholar Hotchkiss Bridge Donald Kotler Chang Ho Period 1949 1950 1955 1991 1990 2002 Ration ◎ ◎ ◎ ◎ Emotion ◎ ◎ ◎ ◎ Curiosity ◎ ◎ Memory ◎ Success ◎ Economy ◎ Fear ◎ ◎ Information ◎ Beauty ◎ Ethic ◎ ◎ Humor ◎ Positive ◎ Neutral ◎ Negative ◎ Source: (Ho 2002)
2.1.1 Definition of positive appeals
Positive appeal is defined as the desirable consequence resulting from using the advertised product (Wheatley and Oshikawa 1970; Liang 1992; Lin 1992; Yin 1998; Chen 2001; Liou 2001). Also, positive appeal is defined as rational appeals that is integrated with positive feelings of emotional appeals and attempts to combine consumers’ self-advantage and purchase intention into a positive emotion (Ho 2002). This research adopted the former definition.
2.1.2 Definition of negative appeals
Negative appeal emphasizes the undesirable consequences of failing to use the product emphasized (Wheatley and Oshikawa 1970; Liang 1992; Lin 1992; Yin 1998; Chen 2001; Liou 2001). Negative appeal is defined as rational appeals integrated with negative feelings of
emotional appeals and attempts to combine consumers’ self-advantage and purchase intention into a negative emotion (Ho 2002). This research adopted the former definition.
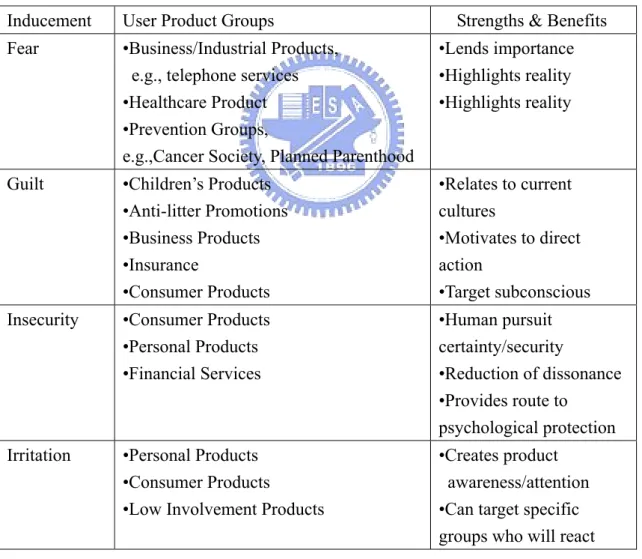
Another definition is from Negative Appeals (Fram and Vogler 1990). In “Negative Appeals: The Neglected Side of Promotion”(Fram and Vogler 1990), negative inducements involving psychological emotional appeals can also create customer acceptance of a product or service. For example, fear is an actual emotional response that can induce changes in attitude or behavior intentions (e.g., toward a healthy life or toward environmental protection) and consumer actions (e.g., stop smoking or buying green products) (LaTour and Rotfeld 1997).
Table 2.2 Negative inducements
Inducement User Product Groups Strengths & Benefits Fear •Business/Industrial Products,
e.g., telephone services •Healthcare Product
•Prevention Groups,
e.g.,Cancer Society, Planned Parenthood
•Lends importance •Highlights reality •Highlights reality
Guilt •Children’s Products •Anti-litter Promotions •Business Products •Insurance •Consumer Products •Relates to current cultures •Motivates to direct action •Target subconscious Insecurity •Consumer Products
•Personal Products •Financial Services •Human pursuit certainty/security •Reduction of dissonance •Provides route to psychological protection Irritation •Personal Products
•Consumer Products
•Low Involvement Products
•Creates product awareness/attention •Can target specific groups who will react Source: (Fram and Vogler 1990)
2.2 Positive and negative products—Moderators
Actually, “positive product” and “negative product” are subjective to different people. Someone’s positive product may be another’s negative product. For example, most women enjoy shopping and buying groceries, but most men view it as time-wasting and boring. For this reason, this research differentiates positive and negative products by examining if the products are seen as positive or negative by an apparent majority of consumers.
2.2.1 Definition of positive products
A positive product is a product that consumers enjoy purchasing and using (Fram and Widrick 1981; Widrick and Fram 1984; MacKenzie, Lutz et al. 1986). In previous research, researchers asked consumers’ feelings toward a product, using 50% of “like or like very much” as the threshold for identifying a positive product. The following products/services can be placed in this category: flowers and plants (77%), dress clothing (76%), hair care services (65%), sports equipment (56%), stereo equipment (52%), and cameras (50%) (Widrick and Fram 1984). Furthermore, a positive product can be divided into two categories according to its level of involvement (Fram and Widrick 1981), as following.
Table 2.3 Positive Products Based on Different Involvement Involvement Level Positive Motivation
High Vacation Planning / Dress Clothing / Book Selection / Pleasure Boat Low Morning Beverage / Movie Selection / Newspaper /
Snack Foods Source: (Fram and Widrick 1981)
Due to the scarcity of positive product definition, this research also tries to define it in another possible way. According to “Measuring Consumer Involvement Profiles,” the involvement profile contains five components—personal importance, negative consequence importance, subjective probability of mis-purchase, pleasure value, and sigh value. This
research uses pleasure value as the positive product indicator. The involvement profile result are as follows:
Table 2.4 Measuring Consumer Involvement Profiles
Importance of Negative Consequences Subjective Probability of Mispurchase
Pleasure Value Sign Value
Dresses 121 112 147 181 Bras 117 115 106 130 Washing machines 118 109 106 111 TV sets 112 100 122 95 Vaccum cleaners 110 112 70 78 Irons 103 95 72 76 Champagne 109 120 125 125 Oil 89 97 65 92 Yogurt 86 83 106 78 Chocolate 80 89 123 75 Shampoo 96 103 90 81 Toothpaste 95 95 94 105 Facial soap 82 90 114 118 Detergents 79 82 56 63
Average product score=100
Note the first two antecedents of personal importance and importance of negative consequences are combined in these data.
Source:(Laurent and Kapferer 1985)
2.2.2 Definition of negative products
Negative products/services are regarded by the consumer as an unlikable, necessary purchase to avoid problems or reduce disutility now or in the future. (Fram and Widrick 1981; Widrick and Fram 1984) “Negative products are products that the consumer does not enjoy purchasing, e.g., toilet paper, automotive replacement parts, etc”. Another relevant concept is Negative Demand (Fram and Vogler 1990), in which consumers will pay money to avoid
tasks.
However, some items that are negative at purchasing time can be positive at the using time, and vice versa (Widrick and Fram 1984). For instance, a customer may feel embarrassed buying a bottle of anti-sweat spray, but feel excited using it to solve his/her problem. Moreover, a customer who cheerfully bought a high-tech PDA (Personal Digital Assistant) may feel frustrated when unfamiliar with it. For this reason, negative products selected in the research will be negative for the majority of recipients.
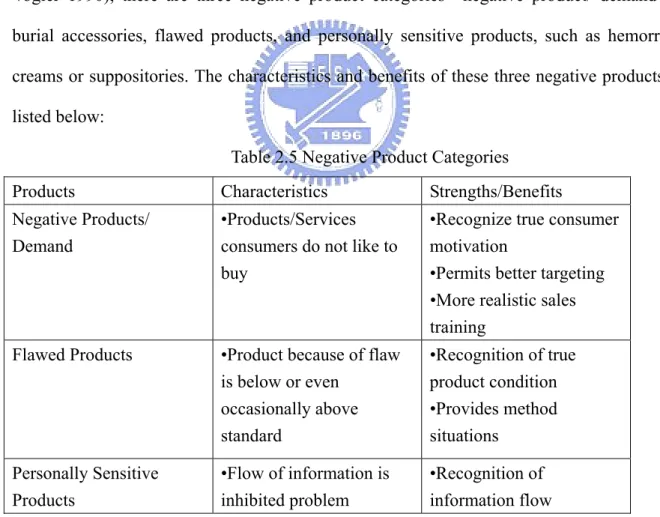
From “Identifying Negative Products (Widrick and Fram 1984),” results show that the greatest four negative purchase responses are auto repairs (59%), extermination service (47%), birth control product (41%), and groceries (35%). According to Negative Appeals (Fram and Vogler 1990), there are three negative product categories—negative product/ demand like burial accessories, flawed products, and personally sensitive products, such as hemorrhoid creams or suppositories. The characteristics and benefits of these three negative products are listed below:
Table 2.5 Negative Product Categories
Products Characteristics Strengths/Benefits Negative Products/
Demand
•Products/Services consumers do not like to buy
•Recognize true consumer motivation
•Permits better targeting •More realistic sales training
Flawed Products •Product because of flaw is below or even occasionally above standard •Recognition of true product condition •Provides method situations Personally Sensitive Products •Flow of information is inhibited problem •Recognition of information flow Source: (Fram and Vogler 1990)
(Fram and Widrick 1981). Table 2.6 instantiates some negative products that differ from consumers’ involvement.
Table 2.6 Negative Products Based on Different Involvement Involvement Level Negative Motivation
High Nursing Home / Home Insurance Replacement / Life Insurance /Dentist Visit
Low Garbage Bag / Light Bulbs / Gasoline / Bank Transaction Source: (Fram and Widrick 1981)
2.3 Dependent Variables-- Cad、Cb、Aad、Ab、PI
2.3.1 Cad (Advertisement cognition) and Cb (Brand cognition)
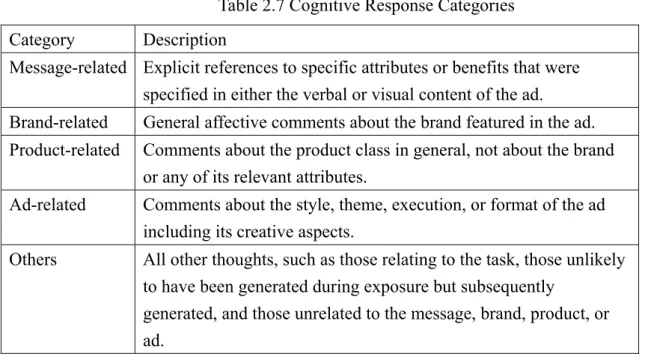
Cognitive response toward the advertisement is what subjects think about during advertising exposure. That is, individuals elaborate different issue-relevant thinking when their attitudes are formed(Chen 2002). These thoughts can generally fall into five categories(Chen 2002):Message-related, Brand-related, Product-related, Ad-related, and Others (see Table 2.7).
Table 2.7 Cognitive Response Categories Category Description
Message-related Explicit references to specific attributes or benefits that were specified in either the verbal or visual content of the ad.
Brand-related General affective comments about the brand featured in the ad. Product-related Comments about the product class in general, not about the brand
or any of its relevant attributes.
Ad-related Comments about the style, theme, execution, or format of the ad including its creative aspects.
Others All other thoughts, such as those relating to the task, those unlikely to have been generated during exposure but subsequently
generated, and those unrelated to the message, brand, product, or ad.
2.3.2 Aad (Attitude toward the advertisement)
Attitude toward the advertisement (Aad) is defined here as a “tendency to respond in a favorable or unfavorable manner to a particular advertising stimulus during a particular exposure occasion (Chen 2002).” The general definition of attitude toward the advertisement is shown in the following:
Table 2.8 The Definition of Aad Researchers Definition
Lutz (1985) Mehta (2000)
A learned predisposition to respond in the consistently favorable or unfavorable manner to a particular
advertising stimulus during a particular exposure occasion.
Berger and Mitchell (1989)
Evaluations of an advertisement. Mackenzie and Lutz
(1989)
A particular exposure to a particular ad and not to consumers’ attitudes toward advertising in general or even their attitudes toward the ad stimulus of interest at another point in time.
Source: (Chen 2002)
2.3.3 Ab (Attitude toward the brand)
According to Lutz’s definition, attitude toward the brand means “Under certain situations, the tendency of liking or disliking responded to certain advertising stimulus.” (MacKenzie, Lutz et al. 1986) Or, attitude toward the brand was measured as, “When consumers are exposed to advertising messages, their continuous level of like or dislike toward the brand (Huang 2001).”
2.3.4 PI (Purchase Intention)
Purchase intention refers to, “After stimulated by advertising, consumers generate the possibility of purchasing toward the advertised product or brand (Huang 2001).” Purchase intention is regarded as “Toward the brand, individual takes certain action or tends towards
certain action, usually indicating consumer’s possible purchasing behavior.” (MacKenzie, Lutz et al. 1986)
2.4 The ELM Model, the DMH Model, and the Kano Concept
The following is a brief introduction of how the ELM Model, the DMH Model, and the Kano Concept can be used in this research.
2.4.1 The ELM Model
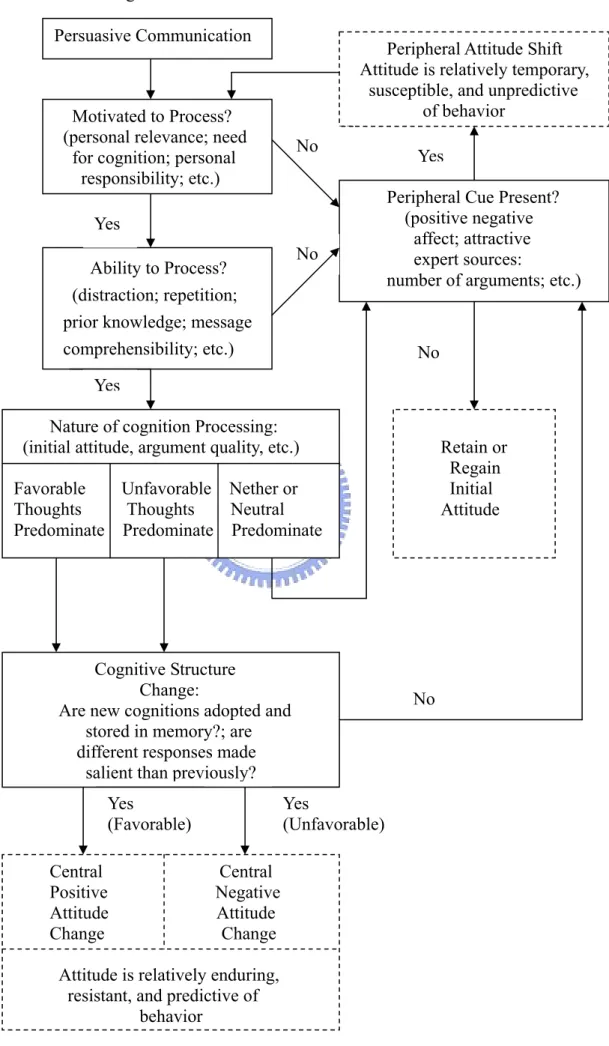
The ELM (Elaboration Likelihood Model of Persuasion) integrated many variables found in the persuasion literatures (Petty, Unnava et al.). In the ELM, there are many variables that can affect elaboration and the route of persuasion—like motivation, ability, situation, individual, objective, and subjective. The two major variables are: (1) motivation—a person’s willingness to process the information, such as personal relevance, need for cognition, personal responsibility, etc. (2) ability —a person’s knowledge to process the information, such as distraction, repetition, prior knowledge, message comprehensibility, etc. These two major variables play a big part in what kind of processing a consumer might take.
Both motivation and ability will lead to the central route. When the central route is taken, the consumer will focus on information about the central merits of the object. Attitudes formed or changed by the central route tend to be relatively more persistent, predictive of behavior, and resistant to change (Flora Kokkinaki 1999). Absence of either motivation or ability will lead to the peripheral route. When the peripheral route is taken, the consumer will evaluate the object depending on other peripheral cues. Attitudes formed or changed by the peripheral route tend to be relatively less persistent, resistant, and predictive of long-term behavior. Previous literatures of the two routes are as follows: (Figure 2.1)
Figure 2.1 Elaboration Likelihood Model of Persuasion Persuasive Communication
Motivated to Process? (personal relevance; need
for cognition; personal responsibility; etc.)
Ability to Process? (distraction; repetition; prior knowledge; message comprehensibility; etc.)
Cognitive Structure Change:
Are new cognitions adopted and stored in memory?; are different responses made
salient than previously?
Central Central Positive Negative Attitude Attitude Change Change
Attitude is relatively enduring, resistant, and predictive of
behavior
Peripheral Attitude Shift Attitude is relatively temporary, susceptible, and unpredictive
of behavior
Peripheral Cue Present? (positive negative
affect; attractive expert sources:
number of arguments; etc.)
Retain or Regain Initial Attitude Yes
Nature of cognition Processing: (initial attitude, argument quality, etc.) Favorable Unfavorable Nether or Thoughts Thoughts Neutral Predominate Predominate Predominate
Yes No Yes No No No Yes
2.4.2 The DMH (Dual Mediation Hypothesis)
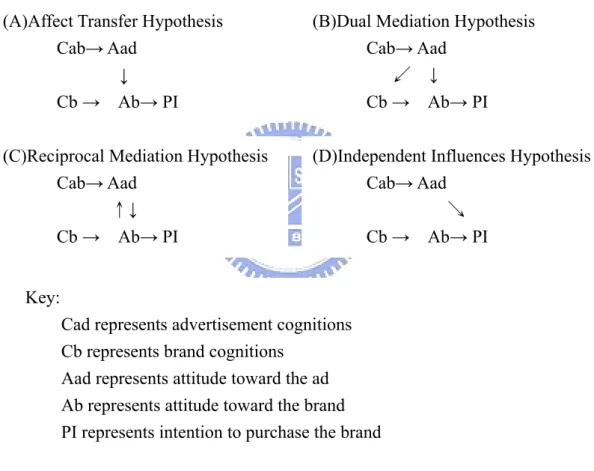
In “The Role of Attitude towards the Ad as a Mediator of Advertising Effectiveness (MacKenzie, Lutz et al. 1986),” four competing explanations of the causal role are examined. These four models have a general hierarchy-of-effects framework, with cognition prior to affect, which in turn is prior to conation (i.e., purchase intention), but the role of Aad as mediator differs. The structural of the four models are as follows:
Figure 2.2 Attitude towards the Ad as a Mediator ediator
Source: (MacKenzie, Lutz et al. 1986)
The DMH (Dual Mediation Hypotheses) turned out to be the best of the four theoretical explanations. It specifies an indirect flow of causation from Aad (attitude toward the advertisement) through Cb (brand cognitions) to Ab (attitude toward the brand), in addition to the direct effect assumed by the ATH. That is, consumers’ affective response to an ad influenced their tendency to accept the messages made in the ad on behalf of the brand.
(A)Affect Transfer Hypothesis Cab→ Aad
↓
Cb → Ab→ PI
(B)Dual Mediation Hypothesis Cab→ Aad
↙ ↓
Cb → Ab→ PI (C)Reciprocal Mediation Hypothesis
Cab→ Aad ↑↓
Cb → Ab→ PI
(D)Independent Influences Hypothesis Cab→ Aad
↘ Cb → Ab→ PI Key:
Cad represents advertisement cognitions Cb represents brand cognitions
Aad represents attitude toward the ad Ab represents attitude toward the brand PI represents intention to purchase the brand
According to this research, this thesis chooses Cad, Cb, Aad, Ab, and PI to be the dependent variables (MacKenzie, Lutz et al. 1986; Biehal, tephens et al. 1992).
2.4.3 The Kano Concept
The Kano Concept was published in 1984 by Kano, Noriaki, Shinchi Tsuji, Nobuhiko Seraku, and Fumio Takerhashi (Jakki Nohr, Sanjit Sengupta et al. 2005). It provides a graphical relationship between the presence of certain product attributes and customer satisfaction or dissatisfaction. There are three attribute types of this graph—one-dimensional quality attribute, must-be quality attribute, and attractive quality attribute. The graph is as the following:
Figure 2.3 Kano Concept
Source: (Jakki Nohr, Sanjit Sengupta et al. 2005)
One-dimensional quality attribute is linearly related to customer satisfaction. Increased performance of these attributes can increase customer satisfaction linearly. Customers know
Dissatisfied Attractive Quality Attribute
Must-be Quality Attribute
One-dimensional Quality Attribute Insufficient Sufficient Physical Consumer Satisfied
and ask for these attributes. For example, the notebook battery belongs to the one-dimensional quality attribute, and lengthening the life of the battery would probably increase customer satisfaction.
Must-be quality attribute is exponentially related to customer dissatisfaction. Increased level of these attributes will not increase customer satisfaction, but the absence of them will lead to customer product dissatisfaction. Customers take these attributes for granted and may not ask for them. For example, the notebook screen belongs to must-be quality attributes, and lack of the screen will make the notebook useless.
Attractive quality attribute is exponentially related to customer satisfaction. The presence of these attributes will delight customers, but a lack of them will not lead to customer dissatisfaction. Customers often don’t notice the needs of these attributes, and thus, these attributes must be discovered by some special techniques (e.g. empathic design and lead users). For example, the notebook camera belongs to attractive quality attributes, and the presence of this attribute will make this notebook stand out above the rest.
2.5 Hypotheses
There is lots of research about how different product types moderate the relationship between advertisement appeals and advertisement effectiveness. But none of them try to separate the product into positive or negative types. This research attempts to test whether there is compatibility between advertising appeals (positive / negative) and product types (positive / negative).
Negative appeals signal to message recipients that their current situation requires a problem-solving response, and therefore triggers central processing. When central processing, message recipients actively think about the advertisement and attempt to understand it. Because they are concentrating on the message and trying to evaluate it, they may be likely to
either (1) produce more cognitions about the ad than people who are not concentrating on the message and/or (2) give greater weight to those cognitions when forming an overall judgment of the ad(Aylesworth and MacKenzie 1998).
Another research summarized the cognitive processing from previous literatures and showed that negative appeal will elicit more cognition than positive appeal (Reeves, Newhagen et al. 1991). Also, in “Context Is Key,” hypotheses have been supported that people in a context-induced negative mood produce more positive and negative cognitions about the program than those in a context-induced positive mood (Aylesworth and MacKenzie 1998). Thus, we could infer that negative appeals usually induce people’s negative mood and then induce more positive and negative cognitions about the advertising than positive appeals.
Finally, a research indicated that negative appeals in advertisement elicit more advertisement cognition, which generates more brand cognition (Homor and Yoon 1992). It also found that brand-related cognitions are more influential when induced by a negatively framed versus a positively framed appeal.
H1a: For positive products, negative appeals will elicit more Cad (advertisement cognition) and Cb (brand cognition) than positive appeals.
H1b: For negative products, negative appeals will elicit more Cad (advertisement cognition) and Cb (brand cognition) than positive appeals.
According to “The Role of Product category as a Moderator of Consumer Attitude,” different advertising appeals do influence consumers’ Aad (attitude toward the advertisement), and positive appeals produce better Aad (attitude toward the advertisement) than negative or neutral appeals. It showed that consumers prefer appeals combining product information and positive feelings, rather than threatening or stressful appeals(Ho 2002).
Another research found that positive advertising appeals lead to more positive Aad (attitude toward the advertisement), which generates more positive Ab (attitude toward the
brand) (Homor and Yoon 1992). It claimed that attitude is based on people’s emotional feelings toward the object. Positive appeals evoke people’s positive feelings, and positive feelings make people process messages in the peripheral route. When peripheral processing, people tend to take simple cues as clues, which strengthens the relationship between positive appeals and positive feelings.
Finally, a research summarized past research and showed that negative feelings decrease one’s favorability toward the ad execution and depress one’s attitude toward brands (Bargozzi and Moore 1994). The mediating role of Aad between feelings and Ab was supported at lower exposure level to advertisement (Stayman and Aaker 1988).
H2a: For positive products, positive appeals will elicit more Aad (attitude toward the advertisement) and Ab (attitude toward the brand) than negative appeals.
H2b: For negative products, positive appeals will elicit more Aad (attitude toward the advertisement) and Ab (attitude toward the brand) than negative appeals.
It is long believed that positive appeals are more effective than negative appeals in purchase intention. But recently, there are some research found that negative appeals are more effective than positive or neutral appeals in purchase intention (King and Reid, 1990; Ho 2002). In “The Role of Product category as a Moderator of Consumer Attitude”, no matter what kinds of categories—convenient or shopping goods—the product belongs to, the negative appeals elicit higher purchase intention. In some instances, negative feelings, like fear, can have a positive effect on attitude and behavior (Burke and Edell 1989).
Because the inconsistency results found by researchers, we could infer that there may be some moderating variables that were missing. So, this research suppose that product types—positive and negative products— would serve as the moderators (Baron and Kenny 1986), which would interact with the independent variables—positive and negative appeals. Only when the most effective compatibility—positive products with positive appeals and
negative products with negative appeals—occurs, the more purchase intention will be aroused.
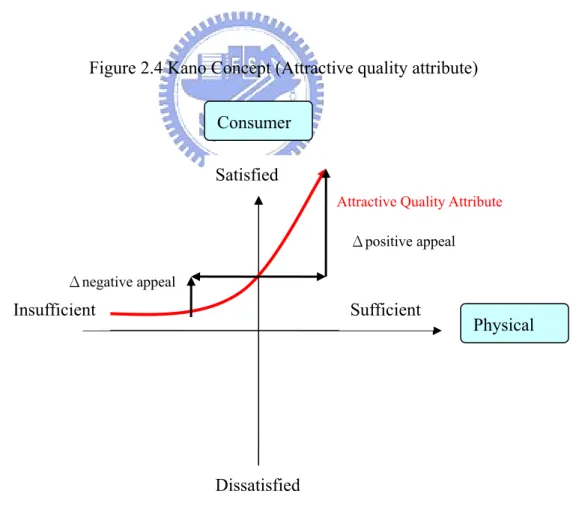
According to Maslow’s Hierarchy, positive products belong to the three upper levels—emotion demand, respect demand, and self-esteem demand. Positive products are used to make ourselves satisfied, not to guarantee our basic needs. So, inferred to Kano concept, the main attributes of positive products belong to attractive quality attributes.
On the advertisement of positive product, positive appeals stress on the benefit by using this product, while negative appeals stress on the disutility of not using this product. So, in the Kano Concept, along the attractive quality attribute line, positive appeals (Δ positive) could increase more satisfaction than negative appeals (Δ negative)(Figure 2.4). Thus, for positive products, positive appeals will elicit more purchase intention than negative appeals.
Figure 2.4 Kano Concept (Attractive quality attribute)
Source: (Jakki Nohr, Sanjit Sengupta et al. 2005) Dissatisfied
Attractive Quality Attribute
Insufficient Sufficient Physical Consumer Satisfied Δpositive appeal Δnegative appeal
Another explanation may be when consumers see the positive appeals of positive product on the advertisement, their positive feelings will be elicited. So they will take the peripheral route to process the information. According to Attribution Theory, they may (1) attribute their positive feelings to “I must like this product”, or/and (2) attribute the positive outcome in the advertisement to using this particular product, and these kind of peripheral processing will boost their purchase intention.
When consumers see the negative appeals of positive product on the advertisement, their negative feeling will be elicited. So they will take the central route to process the information. But, there are not enough central arguments found in the advertisement. Consumers will find it hard to convince themselves with the information provided.
H3a:For positive products, positive appeals will elicit more PI (purchase intention) than negative appeals
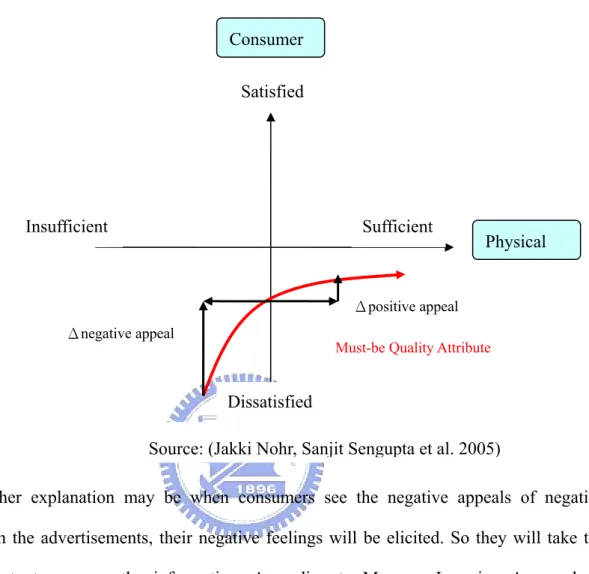
In Maslow’ Hierarchy, negative products belong to the two lower levels—physical demand and safety demand. Negative products are used to guarantee our basic needs, not to make ourselves satisfied. Therefore, inferred to Kano concept, the main attributes of negative products belong to must-be quality attributes.
On the advertisement of negative product, negative appeals stress on the disutility of not using this product, while positive appeals stress on the benefit by using this product. So, in the Kano Concept, along the must-be quality attribute line, negative appeals (Δ negative)could decrease more dissatisfaction than positive appeals(Δ positive) (Figure 2.5). Thus, for negative products, negative appeals will elicit more purchase intention than positive appeals.
Figure 2.5 Kano Concept (Must-be quality attribute)
Another explanation may be when consumers see the negative appeals of negative product on the advertisements, their negative feelings will be elicited. So they will take the central route to process the information. According to Message Learning Approach & Self-Persuasion Approaches, they may (1) learn that the attributes of this product could solve their problem, or/and (2) generate explanation for themselves “I could use this product to solve my problem!”, and these kind of central processing will boost their purchase intention.
When consumers see the positive appeals of negative product on the advertisement, their positive feeling will be elicited. So they will take the peripheral route to process the information. But, there are not enough peripheral cues found in the advertisement. Consumers will find it hard to convince themselves with the information provided.
H3b:For negative products, negative appeals will elicit more PI (purchase intention) than positive appeals.
Dissatisfied
Must-be Quality Attribute Insufficient Sufficient Physical Consumer Satisfied Δpositive appeal Δnegative appeal
Chapter 3 Research Methodology
3.1 Conceptual Research Framework
Figure 3.1 Conceptual Research Frameworks
3.2 Sampling plan
In the sampling plan, 25 students were asked to evaluate a single-print advertisement independently. In this research, totally 8 advertisements were selected, which means that the sample number would be 200 (8 x 25 = 200).
Students were told that it was a study about consumer behavior and were given a Select eight positive and eight negative products from the previous research. Select four positive and four negative products with the same product strength. Design advertisements for the above products.
Select two positive and two negative products with the same appeal strength. Select homogeneous sample from students
Sample size would be 8(advertisements) x 25 (participants)
Randomly assign each sample to each cell. Select positive and negative products
Manipulation check 1: Product strength
Manipulation check 2: Appeal Strength Design advertisements
Select a sampling technique
Determine the sample size
Execute the sampling process
questionnaire. The questionnaire contained six parts—Cad (advertisement cognition), Cb (brand cognition), Aad (attitude toward the advertisement), Ab (attitude toward the brand), PI (purchase intention), and demographic information
3.3 Data collection
The investigation method is a survey conducted by an experimental advertisement with a questionnaire, which the results are easily measured and is often used in quantitative studies. The data was gathered from 40 graduate students in the pilot study and 200 participants in official survey.
The eight advertisements were mixed and were given to students randomly. A cover letter disclosured research purpose of realizing consumer behavior. Participants were instructed not to talk and look at other participants’ advertisement. After the experiment, participants were debriefed and thanked.
3.4 Measures
3.4.1 Cad (Advertisement cognition) and Cb (Brand cognition)
Participants were given four blank lines to write down their thoughts in accord with the following instruction:
In the space bellow, please write down the thoughts that went through your mind while looking at the advertisement. Please list the thoughts that occurred to you about the product, the brand, and your reaction to what was being said about the product by the advertiser. Also, feel free to mention any other thoughts that you had while viewing the advertisement.
These cognition responses were independently coded by two judges into 6 categories: ad-related thoughts (positive, negative, or neutral) (77% agreement), and brand-related thoughts (positive, negative, or neutral) (46% agreement) (Homor and Yoon 1992).
3.4.2 Aad (Attitude toward the advertisement)
Instead of asking the overall evaluation (such as good/bad, like/ dislike) toward the advertisement, this research adapts the questionnaire from (Chen 2002). It combined the “hedonic”, “utilitarian”, and “interestingness” found by recent researches to provide a multidimensional structure.
(1) I like the ad very much (2) I feel this ad very appealing (3) I feel this ad very readable (4) I feel this ad very outstanding (5) I feel this ad very innovative (6) I feel this ad very impressive (7) I feel this ad very convincing (8) I feel this ad very important (9) I feel this ad very helpful
3.4.3 Ab (Attitude toward the Brand)
These four seven-point items were adopted from Shiv (Shiv, Britton et al. 2004). They were used to measure the attitude toward the brand.
(1) I feel this brand good (2) I feel this brand likeable (3) I feel this brand desirable (4) I feel this brand useful
3.4.3 Anticipated satisfaction
Anticipated satisfaction was measure to test if it could explain prepurchase satisafaction and purchase intention. Anticipated satisfaction is the cognitive evaluation of a planned
purchase which will result in satisfaction. Antonis et al.(1997) measured anticipated satisfaction on an single item anchored at 1=“think I will be not at all satisfied”, and 7= “think I will be very satisfied” (Antonis Simintiras, Adamantios Diamantopoulos et al. 1997). To increase its reliability, this research modified the scale by adding three items— “happy,” “pleased,” and “the product work out as well as I thought it would.” These three items are from the scale of satisfaction which measures a consumer’s degree of satisfaction with some stimulus (Gordon C. Bruner II, Karen E. James et al. 2001). Also, to unite the form of the questionnaire, the scale were modified to anchor at 1=“strongly disagree”, and 7=“strongly agree”. The instruction was also adopted from Antonis et al.(1997), as following. (Antonis Simintiras, Adamantios Diamantopoulos et al. 1997)
“please indicate the extent to which you anticipate being satisfied after purchasing the product in the advertisement”
(1) think I will be happy (2) think I will be pleased
(3) think the product work out as well as I thought it would (4) think I will be very satisfied
3.4.4 Prepurchase Satisfaction
Prepurchase satisfaction was measure to test if it could explain purchase intention. Prepurchase satisfaction refers to the affective feelings resulted by the anticipated satisfaction. This research modified the prepurchase satisfaction, anchored at 1=“strongly disagree”, and 7=“strongly agree”(Antonis Simintiras, Adamantios Diamantopoulos et al. 1997). The 7 items and instruction were adopted, as following.
“indicate the extent to which each of the following adjectives describes how you feel about your planned purchase”
(2) contented (3) pleased (4) satisfied (5) excited
3.4.5 PI (Purchase Intention)
The willingness to buy on seven-point scales was adopted from Bodds (William B. Doods 1991). This scale was developed from Bodds’ previous research and purified during the pretest of “Effects of Price, Brand, and Store Information on Buyers' Product Evaluations.”
(1)The likelihood of purchasing this product is: very high/ very low
(2)The probability that I would consider buying the product is: very high/ very low (3)My willingness to buy the product is: very high/very low
3.5 Data Analysis Method
First, to purify the measurement scales and to identify their dimensionality, reliability and factor analysis was conducted. Second, to recognize the relationships between research variables, correlation analysis was employed. Third, to ensure the relationship between anticipated satisfaction, prepurchase satisfaction, and purchase intention, regression analysis was adopted. Forth, to understand the compatibility between product categories and advertising appeals, MANOVA (multivariate analysis of variance) and ANOVA were used to test the interaction. The experiment is a 2 (appeal: positive vs. negative) x 2 (product: positive vs. negative) between-subjects design. Then, Independent-Sample T Test was employed to compare positive and negative appeals of each product type and each product.
Two manipulation checks— product strength and appeal strength—were conducted to eliminate the disturbance from non-manipulation variables.
3.6.1 Product strength
According to previous research, eight positive products (champagne, perfume, stereo, cakes, chocolate, MP3 player, ring, and roses) and eight negative products (toilet cleanser, ointments for athlete’s foot, garbage bags, medicines, ointment for curing zits, anti-perspirants, washing detergent, and toilet paper) were surveyed to understand consumer’s perceived product-strength. Eight dimensions for each product category are shown as follows. It was measured by a seven-point scale to show the level of agreement (where 1=strongly disagree and 7=strongly agree). The level of agreement implies the product strength; the higher the score of agreement, the stronger the product is.
A. Positive product:
(1)I feel delight when I buy this product (2)I feel pleasant when I use this product (3)I expect the outcome after using this product (4)I use this product to to make myself happy (5)I use this product to make me feel better
(6)I use this product because I “want” not I “have to” (7)I do not mind others know that I use this product (8)I do not mind shopping this product with others
B. Negative product:
(1)I do not feel delight when I buy this product (2)I do not feel pleasant when I use this product (3)I use this product to avoid unwanted consequence
(4)I use this product to avoid troubles (5)I use this product to solve problems
(6)I use this product because I “have to” not I “want” (7)I do not like others know that I use this product (8)I do not like shopping this product with others
3.6.2 Results of Product strength
For the positive products, the reliability is 0.914. But for the negative products, the reliability is 0.662. To reach the reliability threshold (Cronbach’s Alpha > 0.7), the reliability for each product was examined separately. Only four of them reach the acceptable level: the ointment for athlete’s foot, the ointment for curing zits, anti-perspirant, and the toilet paper. It might because people perceive negative products inconsistently, which makes the reliability distributed diversely.
Thus, these four negative products were picked to continue with the comparison of product strength. After comparing their means through Independent-Sample T Test (Appendix Ⅵ), it is found that there is no significant difference between the following products: perfume, stereo, MP3 player, ring, roses, ointments for athlete’s foot, ointment for curing zits, and anti-perspirants.
Putting advertising appeals into consideration, it seems that utilitarian products would be easier to come up with negative appeals. So, two positive products (stereo and MP3 player) and two negative products (ointment for athlete’s foot and ointment for curing zits) were chosen to be continued in manipulation check 2.
3.6.3 Appeal Strength
To ensure the appeal manipulation is perceived right and equal loading, perception of positive and negative appeal of each product was examined. Four dimensions are shown as
follows. It used 7 bipolar adjective pairs to (where 1= most suitable for the left-hand description and 7= most suitable for the right-hand description).
A. Questionnaire for stereo
(1) I feel that the advertising message stresses on “the benefit from the high-quality stereo” / I feel that the advertising message stresses on the “the loss from the low-quality stereo” (2) I feel that the advertising picture stresses on “the benefit from the high-quality stereo” /
“I feel that the advertising picture stresses on “the loss from the low-quality stereo” (3) From the advertising message, I realized “the benefit from the high-quality stereo” /
From the advertising message, I realized “the loss from the low-quality stereo” (4) From the advertising picture, I realized “the benefit from the high-quality stereo” /
From the advertising picture, I realized “the loss from the high-quality stereo”
B. Questionnaire for MP3 player
(1) I feel that the advertising message stresses on “the benefit from the high-quality MP3 player” / I feel that the advertising message stresses on the “the loss from the low-quality MP3 player”
(2) I feel that the advertising picture stresses on “the benefit from the high-quality MP3
player” / “I feel that the advertising picture stresses on “the loss from the low-quality MP3 player”
(3) From the advertising message, I realized “the benefit from the high-quality MP3 player” / From the advertising message, I realized “the loss from the low-quality MP3 player” (4) From the advertising picture, I realized “the benefit from the high-quality MP3 player” /
From the advertising picture, I realized “the loss from the high-quality MP3 player”
C. Questionnaire for athlete’s foot
feel that the advertising message stresses on “the consequence from not treating Athlete’s foot”
(2) I feel that the advertising picture stresses on “the benefit from treating Athlete’s foot” / I feel that the advertising picture stresses on “the consequence from not treating Athlete’s foot”
(3) From the advertising message, I realized “the benefit from treating Athlete’s foot” / From the advertising message, I realized “the consequence from not treating Athlete’s foot” (4) From the advertising picture, I realized “the benefit from treating Athlete’s foot” / From
the advertising message, I realized “the consequence from not treating Athlete’s foot”
D. Questionnaire for zit
(1) I feel that the advertising message stresses on “the benefit from treating zits” / I feel that the advertising message stresses on “the consequence from not treating zits” (2) I feel that the advertising picture stresses on “the benefit from treating zits” / I
feel that the advertising picture stresses on “the consequence from not treating zits” (3) From the advertising message, I realized “the benefit from treating zits” / From
the advertising message, I realized “the consequence from not treating zits” (4) From the advertising picture, I realized “the benefit from treating zits” / From
the advertising message, I realized “the consequence from not treating zits”
3.6.4 Results of Appeal Strength
For reliability, the Cronbach alpha is 0.725, which is accepted as reliable. Appeal strength of each product was compared by Independent-Sample T Test. The results show that there is no significant difference between positive and negative appeals of each product (Appendix Ⅶ).
3.7 Pretest
To reduce the uncertainty in the survey, a pilot survey was conducted to discover any problems or misunderstanding of the questions and the design of the questionnaire. The pretest was made by giving 40 NCTU (National Chiao Tung University) students the questionnaire, debriefing the research purpose, and welcoming any feedbacks. The results from the pretest showed low uncertainties (alpha=0.966).
Chapter 4 Research Analysis and Results
This chapter demonstrates the analyses and results of this research, including background of respondents, reliability and validity of the results, and a series of data analyses techniques like correlation analysis, regression analysis, MANOVA, ANOVA, and Independent-Sample T Test were utilized in this research. Results of tested hypotheses were presented at last.
4.1 Background of Respondents
The total sample is 240 participants. 51.3% are female, 96.7% are single, 63.8% live in Hsinchu, 78.8% ages 21-30 years old, 93.3% are students, 54.2% have College/Bachelor degree, and 75% have disposable income below NT10,000. (Table 4.1)
4.2 Reliability and Validity of the Results
Five constructs were examined in the research—attitude toward the advertisement, attitude toward the brand, anticipated satisfaction, prepurchase satisfaction, and purchase intention. Reliability was tested with Cronbach’s α, factor analysis was conducted with varimax rotation, and CFA analysis was also conducted.
4.2.1 Reliability Analysis
The reliability of the data is tested with Cronbach’s α. If Cronbach’s α is above 0.7, the study is accepted as reliable. Table 4.2 demonstrates the values from reliability tests of five constructs. The result of the reliability test indicates that the survey is reliable (all above 0.7). Table 4.2 illustrates the values from reliability tests of five constructs.
4.2.2 Validity Analysis
4.3, four factors were formed. The loading score of each item is higher than 0.5. Because factor 1 consists of two constructs—anticipated and prepurchase satisfaction, CFA was conducted to test the model. Plot, goodness-of-fit, factor loadings are also shown (Table 4.4, Table 4.5, and Figure 4.1).
Table 4.1 Demographics of Respondents Category (Demographics) respondents Percentage(%) Gender Male Female Total 117 123 240 48.8% 51.3% 100% Marriage Married 8 3.3% Single 232 96.7% Total 240 100% City Taipei 65 27.1% Hsinchu 153 63.8% Taichung 18 7.5% Tainan 4 1.7% Total 240 100% Age Below 20 44 18.3% 21-30 189 78.8% Others 7 2.9% Total 240 100% Occupation Students 224 93.3% Others 16 6.7% Total 240 100%
Education Degree College / Bachelor 130 54.2%
Master’s degree 107 44.6% Doctor’s degree 3 1.3% Total 240 100% Income Below NT 10,000 180 75% NT10,001~20,000 43 17.9% Others 17 7.1% Total 240 100%
Table 4.2 Reliability analysis for 5 constructs
Construct / Items Cronbach Alpha
Item deleted
Cronbach alpha after item deleted
Attitude toward the Advertisement
1. I like the ad very much 2. I feel this ad very appealing 3. I feel this ad very readable 4. I feel this ad very outstanding 5. I feel this ad very innovative 6. I feel this ad very impressive 7. I feel this ad very convincing 8. I feel this ad very important 9. I feel this ad very helpful
0.909 3 0.934
Attitude toward the Brand
1. I feel this brand good 2. I feel this brand likeable 3. I feel this brand desirable 4. I feel this brand useful
0.929 --- ---
Anticipated Satisfaction
1. think I will be happy 2. think I will be pleased
3. think the product work out as well as I thought it would
4. think I will be very satisfied
0.922 (1,2) (0.915) Prepurchase Satisfaction 1. happy 2. contented 3. pleased 4. satisfied 5. excited 0.929 --- --- Purchase Intention
1. The likelihood of purchasing this product is: very high/ very low
2. The probability that I would consider buying the product is: very high/ very low
3. My willingness to buy the product is: very high/very low
0.952 --- ---
Table 4.3 Factor Analysis
Component Factor loading
Items 1 2 3 4 5
Attitude toward the Advertisement
1. I like the ad very much 2. I feel this ad very appealing 3. I feel this ad very readable 4. I feel this ad very outstanding 5. I feel this ad very innovative 6. I feel this ad very impressive 7. I feel this ad very convincing 8. I feel this ad very important 9. I feel this ad very helpful
.617 .734 .525 .785 .875 .856 .738 .680 .691
Attitude toward the Brand
1. I feel this brand good 2. I feel this brand likeable 3. I feel this brand desirable 4. I feel this brand useful
.753 .805 .736 .683
Anticipated Satisfaction
1. think I will be happy 2. think I will be pleased
3. think the product work out as well as I thought it would 4. think I will be very satisfied
.732 .662 Prepurchase Satisfaction 1. happy 2. contented 3. pleased 4. satisfied 5. excited .789 .794 .834 .743 .842 Purchase Intention
1. The likelihood of purchasing this product is: very high/ very low
2. The probability that I would consider buying the product is: very high/ very low
3. My willingness to buy the product is: very high/very low
.850 .840 .869
Table 4.4 Goodness-of-fit index of CFA
Goodness-of-fit index Value
χ2 χ2 (210)=323.91 (p=0.00000) NCI=χ2/d.f. NCI=323.91 / 210 =1.5424 GFI 0.89 RMSEA 0.048 AGFI 0.86 RMR 0.046 CFI 0.99
Table 4.5 Loading of CFA
Latent Variable Items Standardized λ t value 1. I like the ad very much 0.79 14.27
2.Very appealing 0.83 15.34 3.Very readable 0.57 9.30 4.Very outstanding 0.81 14.54 5.Very innovative 0.69 11.76 6.Very impressive 0.74 12.78 7.Very convincing 0.84 15.59 8.Very important 0.72 12.40 Attitude toward the Advertisement 9.Very helpful 0.82 15.02 1. good 0.86 16.09 2. likeable 0.83 15.04 3. desirable 0.77 13.59 Attitude toward the Brand 4. useful 0.84 15.49
1. think the product work out as well as I thought it would 0.89 17.02 Anticipated
Satisfaction 2. think I will be very satisfied 0.95 18.64
1. happy 0.79 14.39 2. contented 0.90 17.80 3. pleased 0.85 15.99 4. satisfied 0.88 17.00 Prepurchase Satisfaction 5. excited 0.78 14.21 1. likelihood of purchasing 0.92 18.67 2. probability of purchasing 0.93 18.79 Purchase Intention 3. willingness to buy 0.95 19.52
4.3 Analysis of Results
After assuring the reliability and validity of the analyzed data, the study proceeded to conduct correlation analysis, regression analysis, MANOVA, ANOVA, Independent-Sample T Test to test the hypotheses.
4.3.1 Correlation Analysis between Different Construct
Correlation analysis was conducted to recognize the correlation between every two out of five dependent variables. Pearson correlation coefficient was used to tell whether the relationship between two variables is positive or negative. If the p value of Pearson correlation coefficient is less than 0.05, the correlation between two variables is significant.
Table 4.6 Pearson Correlation Coefficient (Five Dependent Variables)
Variable (Y1) (Y2) (Y3) (Y4) (Y5) Attitude toward the
advertisement (Y1) 1
Attitude toward the brand (Y2) 0.618 (0.000**) 1 Anticipated Satisfaction (Y3) 0.483 (0.000**) 0.640 (0.000**) 1 Prepurchase Satisfaction (Y4) 0.429 (0.000**) 0.568 (0.000**) 0.711 (0.000**) 1 Purchase Intention (Y5) 0.572 (0.000**) 0.552 (0.000**) 0.466 (0.000**) 0.596 (0.000**) 1
From Table 4.6, the correlation between every two variable is significantly positive. For this reason, these five dependent variables would be tested by MANOVA, considering the covariance between these five dependent variables.
4.3.2 Regression Analysis
To ensure that prepurchase satisfaction will mediate the relationship between anticipated satisfaction and purchase intention, regression analysis was conducted. From Table 4.7, both
anticipated satisfaction and prepurchase satisfaction have significantly positive influence on purchase intention. It is supported that prepurchase satisfaction will mediate the relationship between anticipated satisfaction and purchase intention. (VIF=1.699 < 10)
Table 4.7 Regression of Purchase Intention
Independent Variables-- Purchase Intention Adjusted R square β t Significant (Constant) -.262 .794 Anticipated Satisfaction .206 .141 2.072 .039 Prepurchase Satisfaction .347 .493 7.235 .000 4.3.3 Chi-square Analysis
Cad and Cb was investigated by open questions that judged by two graduate students who had taken the consumer behavior course. Both Cad and Cb were grouped into three categories (positive, neutral, and negative). To test the relationships between appeal types and cognitions, Chi-square analysis was employed.
For positive product, there is no difference between positive and negative appeals for Cad (χ2=3.1291<χ2(0.95;2)=5.99) and Cb(χ2=0.32<χ2(0.95;2)=5.99). (Table 4.8 and Table 4.9)
Table 4.8 Cad for positive product
Judged Advertisement Cognition (Expected value)
Positive Neutral Negative Total
Positive Appeal 0 (0.921348) 7 (5.067416) 34 (35.01124) 41 Negative Appeal 2 (1.078652) 4 (5.932584) 42 (40.98876) 48 Total 2 11 76 89
Table 4.9 Cb for positive product
Judged Brand Cognition (Expected value)
Positive Neutral Negative Total
Positive Appeal 1 (1.25) 1 (1.25) 13 (12.5) 15 Negative Appeal 1 (0.75) 1 (0.75) 7 (7.5) 9 Total 2 2 20 24
For negative product, there is no difference between positive and negative appeals for Cad (χ2=1.5833<χ2 (0.95;2)=5.99) and Cb(χ2=2.5083<χ2 (0.95;2)=5.99). (Table 4.10 and Table
4.11)
Table 4.10 Cad for negative product
Judged Advertisement Cognition (Expected value)
Positive Neutral Negative Total
Positive Appeal 7 (7.2027) 8 (6.0946) 26 (27.7027) 41 Negative Appeal 6 (5.7973) 3 (4.9054) 24 (22.2973) 33 Total 13 11 50 74
Table 4.11 Cb for negative product
Judged Brand Cognition (Expected value)
Positive Neutral Negative Total
Positive Appeal 1 (2.1429) 3 (2.8571) 11 (10) 15 Negative Appeal 2 (0.8571) 1 (1.1429) 3 (4) 6 Total 3 4 14 21