評估模式對負面來源國效應之調節效果
69
0
0
全文
(2) 國立交通大學 管理科學系 博 士 論 文 N0.041 評估模式對負面來源國效應之調節效果 Countering Negative Country-of-origin Effect: The Role of Evaluation Mode. 研 究 生:陳佳誼 研究指導委員會:朱博湧. 教授. 王耀德. 教授. 張家齊. 教授. 黃仁宏. 教授. 指導教授:朱博湧. 教授. 中 華 民 國 九十八 年 一 月.
(3) 評估模式對負面來源國效應之調節效果 Countering Negative Country-of-origin Effect: The Role of Evaluation Mode. 研 究 生:陳佳誼. Student:Chia-Yi Chen. 指導教授:朱博湧. Advisor:Po-Young Chu. 國 立 交 通 大 學 管 理 科 學 系 博 士 論 文. A Thesis Submitted to Department of Management Science College of Management National Chiao Tung University in Partial Fulfillment of the Requirements for the Degree of Doctor of Philosophy in Management January 2009 Hsin-Chu, Taiwan, Republic of China. 中華民國九十八年一月.
(4) 評估模式對負面來源國效應之調節效果. 研究生:陳佳誼. 指導教授:朱博湧. 國立交通大學管理科學系博士班 摘. 要 當廠商試圖透過全球外包策略以尋求成本優勢的同時,如何發展有效的策略以降低 來源國效應所可能帶來的負面影響,是相當重要的課題。本研究旨在探討品牌形象與評 估模式是否能夠調節負面來源國效應。本研究透過一個 2(來源國)×2(品牌)×2(評估模式) 的實驗設計,藉以驗證在不同的評估模式下,品牌與來源國效應的影響力是否有所差 異,研究資料利用重複測量的多變量變異數分析法予以分析。研究結果顯示,來自正面 來源國的產品,在共同評估的模式下,相對於在分別評估的模式下,可以得到較高的產 品評價;相反的,來自負面來源國的產品,則在分別評估的模式下,相對於在共同評估 的模式下,可以得到較高的產品評價;此外,本研究結果則並不支持優勢的品牌形象可 以降低負面來源國效應的主張。據此,本研究建議,無論廠商具有高品牌形象或低品牌 形象,來源國效應對其產品評價具有同等的影響力;換言之,即便產品來自高品牌形象 的廠商,來源國效應所可能帶來的負面影響並不會因此而消除;另一方面,為了降低負 面的來源國效應,無論品牌形象的高低,廠商應當避免讓來自負面來源國的產品,與來 自正面來源國的產品進行直接比較。據此,當行銷生產自負面來源國的產品時,行銷人 員應當創造一個誘導消費者使用個別評估模式的銷售環境;相反的,對於來自正面來源 國的產品,廠商則應當主動將其產品與來自負面來源國的產品共同展示,藉以進一步提 升消費者的品質知覺。. 關鍵詞: 來源國效應、評估模式、可評估性假說. i.
(5) Countering Negative Country-of-origin Effect: The Role of Evaluation Mode Student:Chia-Yi Chen. Advisor:Dr. Po-Young Chu. Department of Management Science National Chiao Tung University. ABSTRACT As multinational firms seek to acquire competitive cost advantages through global sourcing, it is also important for them to develop effective strategies to reduce possible damage of negative country-of-origin (COO) effect. This study aims to examine whether brand image and evaluation mode could alleviate negative COO effect. A 2(COO)×2(brand)×2(evaluation mode) experimental design was employed in order to examine whether brand and COO effects on product evaluation vary under different evaluation modes. The data were analyzed by a repeated measure MANOVA. The results showed that products made in favourable countries were rated higher in joint evaluation mode than in separate evaluation mode. Conversely, products made in unfavourable countries were better evaluated in separate evaluation mode than in joint evaluation mode. The results of this study are not in favour of the notion that a strong brand image could overcome negative effect of COO. Conclusions of this study suggest that COO effect plays an equally important role in consumer product evaluation for both strong and weak brands. Thus, even for a product with strong brand image, the negative consequences of COO stemming from consumers’ unfavourable attitudes towards the manufacturing country is not likely to be completely eliminated. Moreover, to alleviate negative impact of unfavourable COO, marketers may want to avoid direct comparison between products made in unfavourable countries with those made in favourable countries regardless of their brand strength. Accordingly, when marketing a product made in an unfavourable country, marketers should manage to create a selling environment facilitating separate evaluation mode. In contrast, marketers should proactively manage to display products from favourable countries along with those from unfavourable countries in order to further enhance quality perceptions. Key words: Country-of-origin Effect, Evaluation Mode, Evaluability Hypothesis. ii.
(6) 誌. 謝. 這一篇誌謝辭,或許是我一生中最難下筆的文字,自己曾經謬稱,學位論文的價值 不在學術貢獻,而是在那一頁致謝辭中。然而在終於有機會提筆撰文時,才發現無論怎 樣地精雕細琢,要在短短數百字的篇幅內,為自己五年半的博士班生活留下記錄、為學 術心智的成長歷程刻下印證,並為未來的學者生涯許下承諾,竟是如此的艱難。或許, 與其刻意不落俗套,不如回歸自然,真誠的感恩,平實的陳述,才是展現誌謝辭背後那 份深刻意涵的最佳方式吧! 取得博士學位,首先要將這份榮耀獻給已不在人世奶奶,希望這份遲來的成就,能 告慰您的在天之靈;我也要拜謝父母親在漫長的求學期間,無怨無悔的給予支持,你們 對子女最單純的愛,卻是我最不平凡的幸福。求學期間,感謝指導教授朱博湧老師的教 誨,除了研究上的指引與督促,以及生涯規劃上的寶貴建議,從老師身上我更學習到諸 多實用的產業思維與觀念,與使我不僅在學術上得以不斷精進,亦有機會學習實務界策 略性與系統性思考的能力;此外,我亦要特別表達對張家齊老師的謝意,因為您的細心 指導,我才能夠順利完成論文,博士班期間,無論是思考邏輯、研究能力與學術熱誠, 我均受益良多,期許自己將來能向您看齊。 研究之路上雖孤單難免,但我有幸能有諸多朋友一路相伴,在我遭遇挫折而自我否 定時,總能得到你們的安慰與鼓勵,才能重拾信心與勇氣,繼續前行。首先是博士班的 同窗們,由於你們的提攜與砥礪,我才能順利走完這段漫長的求學生涯,期待在未來人 生的道路上,依舊能繼續彼此扶持;朱門的諸位博士班先進以及學弟妹們,謝謝你們總 是給予我鼓勵與支持,希望我們都能在各自的領域中,開創一片寬闊的藍海;此外,亦 要衷心感謝每一位曾在研究上攜手努力的碩、博士班同學,表面上雖是我引領各位,但 其實與你們共同學習的過程中,我獲得的反而更多,謝謝你們給了我這樣的機會;而在 生活中的好友們,雖然以我一向君子之交的個性,沒有與你們熱絡的往來,但我仍可感 受到你們的關心與祝福,在此也要獻上我的感激之意。 在碩士論文的誌謝辭中,我寫下了這樣一段話:「或許唯有更珍惜身邊關心、愛護 自己的人,更努力地把所學,實踐自己的理想與價值,才能確定這段時光、這一路無悔 的心情、和所有的經歷與情感,都是真的」。如今,在完成了生命中另一個重要的階段 後,終於將踏上實現理想的道路。我不確定未來的人生能有多真實,也不知道自己能夠 將所學發揮到什麼樣的境地,只希望多年後,每回拿起這篇論文時,都能重拾踏上學術 之路的初衷,且不悔自己所選擇的每一步。. 陳佳誼 謹誌 2009 年 1 月 于 新竹 交通大學管理科學系. iii.
(7) Table of Contents 摘. 要 .................................................................................................................................i. ABSTRACT ...............................................................................................................................ii 誌. 謝 ...............................................................................................................................iii. Table of Contents......................................................................................................................ivi List of Tables .............................................................................................................................vi List of Figures............................................................................................................................vi Chapter 1 Introduction ............................................................................................................1 1.1 Research background.................................................................................................................................... 1 1.2 Research objective ........................................................................................................................................ 1. Chapter 2 Literature Review...................................................................................................4 2.1 Country-of-origin effect ................................................................................................................................ 4 2.2 Factors moderating COO effect.................................................................................................................... 5 2.3 Brand as a moderator of COO ..................................................................................................................... 5 2.4 Effect of evaluation mode on product evaluation.......................................................................................... 7 2.5 Comparative evaluability of brand and COO............................................................................................... 8. Chapter 3 Research Method ..................................................................................................13 3.1 Pretests and manipulations......................................................................................................................... 13 3.2 Research design and procedures................................................................................................................. 17. Chapter 4 Results....................................................................................................................19 4.1 Reliability test ............................................................................................................................................. 19 4.2 Tests of Hypotheses..................................................................................................................................... 19 4.3 Discussions ................................................................................................................................................. 27. Chapter 5 Conclusions ...........................................................................................................31 5.1 Conclusions and Managerial implications ................................................................................................. 31 5.2 Limitations and future research .................................................................................................................. 32. References................................................................................................................................34 Appendix I: Example of preference reversal .......................................................................41 Appendix II: The perceived quality and perceived favourability scales ...........................42 Appendix III: Questionnaire for the pretest ........................................................................43 Appendix IV: Questionnaire for the main study (separate evaluation) ............................48 Appendix V: Questionnaire for the main study (joint evaluation) .................................... 54. iv.
(8) List of Tables Table I Perceived quality of brands in the pretest ....................................................................14 Table II Perceived quality of COOs in the pretest....................................................................14 Table III Summary of repeated measures ANOVA on perceived quality.................................22 Table IV Summary of repeated measures ANOVA on perceived favourability .......................23 Table V Mean scores (standard deviations) of main treatment ................................................23 Table VI Mean scores (standard deviations) of perceived quality and perceived favourability in each of the experimental conditions .......................................................................24. v.
(9) List of Figures Figure 1 Frameworks and hypotheses of current study............................................................12 Figure 2 COO by Evaluation Mode interaction on perceived quality......................................25 Figure 3 COO by Evaluation Mode interaction on perceived favourability ............................26. vi.
(10) Chapter 1 Introduction 1.1 Research background. In today’s globalized competition, many multinational companies have moved or outsourced their production to low-cost locations, usually in developing countries. Although manufacturing in developing countries can assist corporations in enhancing their cost advantages (Cho and Kang, 2001; Trent and Monczka, 2005), corporations also face the risk of potential loss due to negative country-of-origin (COO) effect. It has long been evident that where a product is made can have an impact on consumer product evaluation and purchase decision (Bilkey and Nes, 1982; Gaedeke, 1973; Han and Terpstra, 1988; Okechuku, 1994). Many studies have also concluded that consumers typically view products made in developing countries less favourably (Cordell, 1992; Wang and Lamb, 1980). Therefore, as multinational firms seek to acquire competitive cost advantages through global manufacturing or global sourcing, it is also important for them to develop effective strategies to reduce possible damage of negative COO (Cordell, 1992; Li et al., 2000).. 1.2 Research objective. As consumers’ sensitivity to COO has become a critical issue for marketers, many researchers focused their attention on the relative importance of COO information and other. 1.
(11) product cues (e.g., price, store name). Prior studies have found that the information value of COO might depend upon the availability of other information (Johansson, 1989; Lim et al., 1994; Peterson and Jolibert, 1995). In the plethora of aggressively marketed brands, some scholars have proposed that COO of a product may not be an important determinant for well-established brands (Cordell, 1992; Han and Terpstra, 1988; Tse and Gorn, 1993). Under those circumstances, managers of strong brands will have a wider choice of outsourcing locations than those of weak brands (Jo et al., 2003). However, inconsistent conclusions have emerged concerning whether brand information inhibits customer’s reliance on COO in purchase decisions (Pharr, 2005; Tse and Gorn, 1993). This study attempts to explore this important issue from the perspective of evaluation mode. We propose that how products are evaluated (jointly or separately) may influence the effects of brand and COO on product evaluation. Customers are often presented with the options in either joint evaluation mode (JE) or in separate evaluation mode (SE). In JE, options are presented together and can be compared directly. In SE, options are presented one at a time and evaluated separately (Bazerman et al., 1999; Hsee, 1996). Researchers have found that customers may exhibit incongruent preference in JE and in SE (Hsee, 1996; Hsee et al., 1999; Hsee and Leclerc, 1998; Mellers and Cooke, 1996). This phenomenon has provided many practical implications for merchandising and advertising strategies. For example, Hsee and Leclerc (1998) suggested. 2.
(12) that superior products (e.g. luxury cars) will be evaluated higher when presented individually (e.g. using own store) than when presented jointly (e.g. through dealers) with lesser products (e.g. low-end cars). Conversely, lesser products will receive higher evaluation when exhibited along with superior products than when presented in isolation. In this research, we propose that creating an environment facilitating a certain evaluation mode may assist to counter negative COO effect. We will examine whether the effects of brand and COO are contingent upon evaluation modes. The results could help marketers employ advantageous merchandizing or advertising strategies to lessen negative effect of COO. The remainder of this dissertation is organized as follows. In chapter 2, we review germane literature and formulate hypotheses. Then, we illustrate research design and procedures in chapter 3. In chapter 4, we present our results and test the hypotheses. Last, we discuss managerial implications and limitations of this study in Chapter 5.. 3.
(13) Chapter 2 Literature Review 2.1 Country-of-origin effect COO effect refers to how customers perceive products made in a particular country (Roth and Romeo, 1992). It has long been evident that COO has an impact on product evaluation and purchase decision (Bilkey and Nes, 1982; Han and Terpstra, 1988; Johansson et al., 1985). Several explanations have been proposed to interpret how consumers react to COO information. Among them, the “halo effect” and “summary effect” are two of the most common ones. According to “halo effect” model, COO serves as a cognitive cue for consumers to infer their beliefs regarding other attributes of a product and thus overall product evaluation (Erickson et al., 1984; Han, 1989; Johansson et al., 1985), especially when consumers are not capable of detecting the true quality (Hong and Wyer, 1989). On the other hand, the “summary effect” model suggested that consumers recode and abstract their knowledge about a country’s products into their image of the country (Johansson, 1989; Maheswaran, 1994). Both explanations suggested that a country’s image serves as a hint to infer quality of products from that country. Among many determinants of a country’s image, stage of economic development of a country has been the most commonly cited one (Roth and Romeo, 1992; Samiee, 1994; Wang and Lamb, 1980). Hence, customers typically hold unfavourable attitudes and have lower quality perceptions toward products made in less developed countries (Cordell, 1993; Kaynak and Cavusgil, 1983). 4.
(14) 2.2 Factors moderating COO effect In past research, many factors have been revealed to impact consumers’ reliance on COO, such as consumer expertise (Chiou, 2003; Maheswaran, 1994; Schaefer, 1997), product category (Eroglu and Machleit, 1989; Kaynak and Cavusgil, 1983; Roth and Romeo, 1992), product familiarity (Johansson et al., 1985; Lee and Ganesh, 1999), and product experience (Tse and Gorn, 1993). Other studies also suggested that COO effect could be weaker if other information or extrinsic cues are available (Hastak and Hong, 1991; Hong and Wyer, 1989; Johansson, 1989; Kaynak and Cavusgil, 1983; Lim et al., 1994). For example, COO effect can be contingent upon the availability of brand (Han and Terpstra, 1988; Tse and Lee, 1993), price (Cordell, 1991; Speece and Nguyen, 2005), and store name (Chao, 1989; Lin and Sternquist, 1994) information. Among all these moderating factors, brand has been one of the most intensively researched (Pharr, 2005). Hence, we will discuss how brand influences COO effect in great depth in the following section.. 2.3 Brand as a moderator of COO The importance of brand in product evaluation process has long been acknowledged in consumer behaviour literature (Jacoby et al., 1971; Robertson, 1987). Conceivably, when. 5.
(15) information about brands is present, customers would tend to rely less on COO when evaluating a product. Numerous studies have examined whether brand could moderate the COO effect on product evaluation; however, the results were inconsistent. Some studies have suggested that a highly regarded brand name can help alleviate negative COO effects (d’Astous and Ahmed, 1992; Han and Terpstra, 1988; Kim and Pysarchik, 2000; Lee and Ganesh, 1999; Tse and Lee, 1993). On the contrary, other studies have reported that brand could not override negative impact of COO (Ahmed and d’Astous, 1996; Cordell, 1992; Gaedeke, 1973; Teas and Agarwal, 2000; Tse and Gorn, 1993; Wall et al., 1991). In order to solve this inconsistence, recent studies have more closely explored how brand influenced COO effect by examining several brand-related constructs. For example, Hui and Zhou (2003) reported that negative COO effect is significantly weaker for high equity brands than for low equity brands when there is incongruence between brand origin and country of manufacture. Based on accessibility- diagnosticity theories, Jo (2005) and Jo et al. (2003) found the COO effect is stronger for low diagnostic brands than for highly diagnostic brands. They therefore suggested that managers of strong brands could have a wider selection of manufacturing countries than those of weak brands in order to achieve cost advantages. Pharr (2005) reviewed empirical studies of COO conducted from 1995 to 2005, and concluded that holistic brand constructs (such as brand image or brand equity) could moderate the COO effect on product evaluation and purchase intention. Thus, we hypothesize that. 6.
(16) H1: The effect of COO on product evaluation will be weaker for products of a strong brand than those of a weak brand.. 2.4 Effect of evaluation mode on product evaluation The joint-separate preference reversal has been a widely observed phenomenon in psychology research (Bazerman et al., 1999; Hsee, 1996; Hsee et al., 1999; Hsee and Leclerc, 1998; Mellers and Cooke, 1996). Researchers in this area suggested that people may exhibit different or even reverse preference for the same options under different evaluation modes (“joint evaluation mode” vs. “separate evaluation mode”). In joint evaluation mode (JE), the options are presented together so that decision makers can make direct comparisons. In separate evaluation mode (SE), each option is presented one at a time and evaluated independently. Under these two different circumstances, the weighting of product attributes shifts, resulting in preference change. One prevailing theory that helps explain why joint-separate preference reversal occurs is the evaluability hypothesis (Gonzalez-Vallejo and Moran, 2001; Hsee, 1996; Hsee et al., 1999; Hsee and Leclerc, 1998). The evaluability hypothesis can be stated as follows: “if two options involve a trade-off between two attributes and one of the attributes is hard to evaluate independently and the other is easy, then the former attribute will have a lower weight in the separate evaluation than in the joint evaluation” (Hsee, 1996 pp. 250) (For an example, see Appendix I). In this hypothesis, an 7.
(17) attribute is defined as an easy-to-evaluate one when it has well-developed distributional characteristics and consumers have formed their standard in evaluating the attribute. Therefore, consumers can judge the quality level of this attribute without any anchor or reference point. On the contrary, to say an attribute is hard-to-evaluate means evaluators have little knowledge about prototypical values of this attribute so that they cannot judge how good a given value is without comparison (Hsee, 2000; Willemsen and Keren, 2004). According to the foregoing discussion, we propose that consumers’ preference for products might shift under different evaluation modes when options involving a trade-off between brands and COOs. The evaluability of brand compared to that of COO would have an impact on consumer product evaluation under different evaluation modes (JE vs. SE). Thus, we hypothesize: H2: Evaluation mode (joint versus separate) will moderate consumers’ product evaluation.. 2.5 Comparative evaluability of brand and COO The impact of evaluation mode on the strength of brand and COO effect conceivably depends upon the comparative evaluability of brand name and COO. This study proposed that the evaluability of brand name is higher than COO in general. Although no existing study has examined the relative evaluability of brand and COO, evidence from related studies may 8.
(18) provide some support of this assumption. The information integration theory proposed that consumers evaluate a product by assigning weight and value to each piece of information, and then multiplying the weight by the value to form an overall product evaluation (Anderson, 1971, 1981; Fishbein and Ajzen, 1975). In addition, prior research has demonstrated that decision makers may anchor on the most important piece of information and then make adjustments on the pallid background information (Tversky and Kahneman 1974). On the basis of the anchoring and adjustment heuristic (Lopes 1982), the weight given to each piece of information is commensurate with its creditability and reliability (Anderson, 1971). In other words, people generally rely more on valuable and diagnostic information when making a judgment. Conceivably, if an attribute of a product is weighted more heavily in decision making process, it suggests its higher evaluability. According to the above arguments, exploring the influence of COO relative to brand on product evaluation might help to infer the evaluability of brand and COO. Although COO stereotypes has been found to affect how customers perceive product quality (e.g., Heslop and Papadopoulos 1993; Janda and Rao 1997; Darling and Kraft 1977), results of meta-analysis (Peterson and Jolibert, 1995) indicated that COO effect on product evaluation became weaker when incorporating with other variables (e.g. brand name, price). From the perspective of information integration, the lesser weight assigned to COO relative to other cues implied the. 9.
(19) comparatively lower evaluability of COO for customers. Therefore, COO is seemingly a harder-to-evaluate attribute than brand. In real life, customers may find it more difficult to infer the quality of a product if the COO information is present in isolation (Nowlis and Simonson, 1997). For instance, most consumers may have difficulty assessing a television set with a tag “Made in Indonesia” if no other products are available for comparison since customers are usually less knowledgeable with COO information. In this situation, the negative impact of unfavourable COO tends to be less salient. However, if this television set is displayed along with another “Made in Japan” television set, customers would find the television set made in Indonesia less attractive than that made in Japan. They may dramatically downgrade their quality perception of the television set made in Indonesia. Thus, the negative COO effect on product evaluation becomes stronger. Conversely, brand is likely an easier-to-evaluate attribute than COO. Consumers usually have formed their attitudes towards established brands because people have received large amounts of information about brands through mass media (Friedman, 1990; Holt et al., 2004). Thus, some scholars proposed that the effects of branding on product beliefs and evaluations should be more pronounced than COO effects (Leclerc et al., 1994; Thakor and Pachetu, 1997). In addition, Janda and Rao (1997) suggested that a person’s stereotype of brand name is more specific and that of COO is more general. Because a specific stereotype is more effective compared to a general stereotype, brand name may influence product evaluation. 10.
(20) more than a COO. Additionally, it has been proposed that consumers are more likely to use brand name than other extrinsic cues such as price or COO, because the information “chunked” or retrieved in the familiar brand name is more useful for product evaluation (Monroe and Krishnan, 1985; Olson, 1977). Past empirical results have also supported that brand name is weighted more heavily than COO when they are evaluated jointly. For example, Mazursky and Jacoby (1985) reported that consumers prefer to know brand name more than any other cues when assessing quality. Holt et al. (2004) investigated six product categories, and found that COO effect on consumers’ perceptions of product quality was only one-third as strong as those driven by brand name. Moreover, Ozretic-Dosen, et al., (2007) also found that, with a few exceptions, brand name has greater influence than COO in evaluating food product. According to information integration theory, brand is highly weighted in product evaluation process, and therefore appear to be an easier-to-evaluate attribute in most conditions. In most purchase situations, even if a brand name is present by itself, consumers are capable of judging the product quality of that brand without much difficulty. For instance, customers can easily judge that cars of Toyota are more reliable and high-performing without comparison with competing brands. Based on the foregoing discussion, we proposed that COO would be a relatively harder-to-evaluate attribute than brand. According to evaluability hypothesis, COO (the. 11.
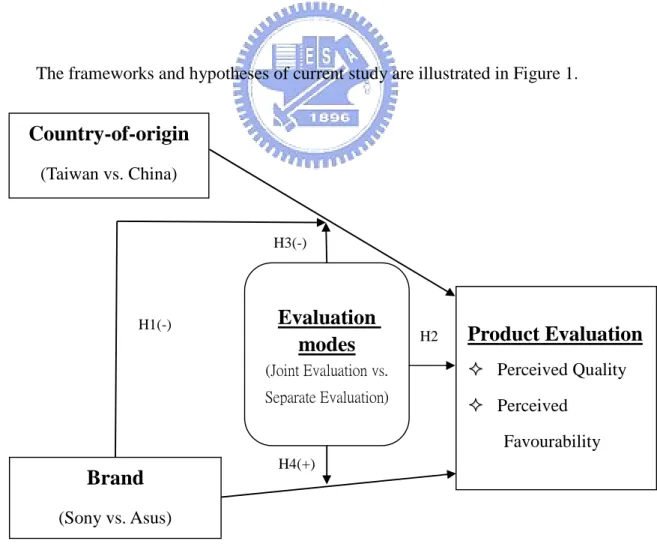
(21) hard-to-evaluate attribute) would have a lower weight in SE than in JE, and brand (the easy-to-evaluate attribute) would have a higher weight in JE than in SE (Hsee, 1996; Hsee et al., 1999). Therefore, the effect COO would be weaker in SE than in JE, and the effect of brand would be stronger in SE than in the JE. The following hypotheses are thus formulated: H3: The effect of COO on product evaluation will be stronger in joint evaluation mode than in separate evaluation mode. H4: The effect of brand on product evaluation will be weaker in joint evaluation mode than in separate evaluation mode.. The frameworks and hypotheses of current study are illustrated in Figure 1.. Country-of-origin (Taiwan vs. China). H3(-). H1(-). Evaluation modes. H2. Product Evaluation. (Joint Evaluation vs.. Perceived Quality. Separate Evaluation). Perceived Favourability. H4(+). Brand (Sony vs. Asus). Figure 1 Frameworks and hypotheses of current study. 12.
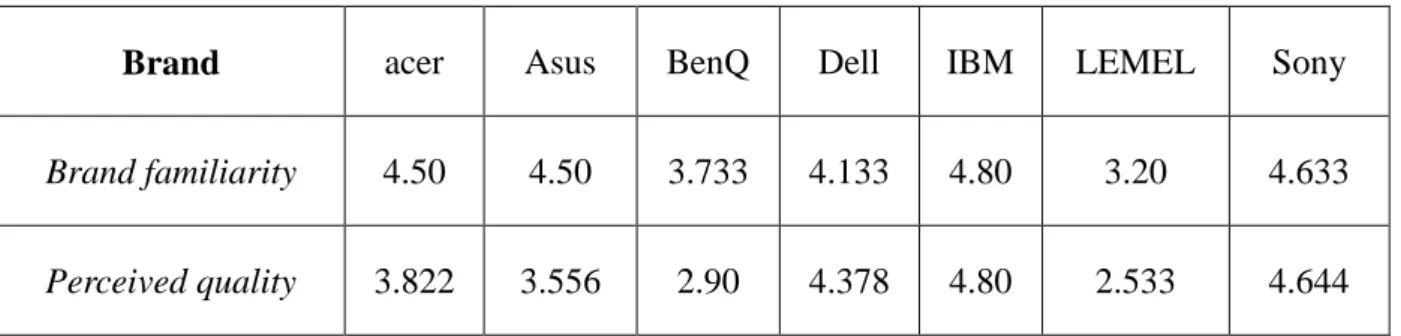
(22) Chapter 3 Research Method 3.1 Pretests and manipulations Prior studies have maintained that brand familiarity may contribute to reduce the effect of COO on product evaluation (Johansson et al., 1985; Lee and Ganesh, 1999). In order to manipulate brand strength while controlling the impact of brand familiarity, we aimed to select brands of equal familiarity but different strength for this experiment. Besides, in order to ascertain that evaluability of brands and countries in this study is not a reflection of participants’ familiarity with cues (Bazerman et al., 1999; Hsee and Leclerc, 1998), we selected products of high customer familiarity. According to the foregoing discussion, laptop computers were chosen as target stimuli for this experiment since most participants are familiar with this product category which makes it easier to find two brands of equal familiarity but of different strength. A pretest was conducted to determine appropriate brands and countries in our experiment. In this pretest, 30 laptop computer owners were asked to rate their perceived quality towards laptop computer brands marketed in Taiwan. In addition, using three items derived from previous COO research (Teas and Agarwal, 2000), COO perceptions of seven laptop computer producing countries were measured. Respondents’ familiarity with these brands and countries was also investigated. The results were illustrated in Table I and Table II.. 13.
(23) Table I Perceived quality of brands in the pretest Brand. acer. Asus. BenQ. Dell. IBM. LEMEL. Sony. Brand familiarity. 4.50. 4.50. 3.733. 4.133. 4.80. 3.20. 4.633. Perceived quality. 3.822. 3.556. 2.90. 4.378. 4.80. 2.533. 4.644. Table II Perceived quality of COOs in the pretest Country. China. Germany. Japan. Korea. Malaysia. Taiwan. US. COO scone. 2.033. 3.85. 4.833. 3.317. 2.217. 4.117. 4.183. According the results of this pretest, one strong brand (Sony, M=4.64) and one weak brand (Asus, M=3.56) were chosen to manipulate brand effect. The familiarity scores of Sony and Asus were both at fairly high level. An examination of brand familiarity between Sony (M=4.63) and Asus (M=4.50) revealed insignificant result (t29=0.779, p=0.442), so that the impact of brand familiarity on COO effect was controlled. To select COO manipulations, countries representing unrealistic scenarios were excluded. For example, an Asus (a local laptop computer brand in Taiwan) computer made in Japan is unrealistic for Taiwanese customers and may cause biased judgment. After considering consumers’ country familiarity along with the reality of scenarios, Taiwan (M=4.12) was chosen to represent the favourable COO, and China (M=2.03) was selected to represent the unfavourable COO.. 14.
(24) Since the study was conducted in Taiwan, and the favorable COO used in the experiment is also Taiwan, consumer ethnocentrism might play a role in influencing COO effect. In order to rule out the potential effect of consumer ethnocentrism, a preliminary survey has been conducted. Seventy participants were asked to rate their COO perceptions towards laptop computers made in seven countries, including China, Germany, Japan, Korea, Malaysia, Taiwan, and USA, by using the scale of COO effect modified from Teas and Agarwal (2000). The level of consumer ethnocentrism of the participants was also measured by using the CETSCALE developed by Shimp and Sharma (1987). The participants were then divided into two groups based on the mean score of CETSCALE. One group is composed of high ethnocentric participants (N=32), and the other included low ethnocentric participants (N=38). A comparison of the ratings on COO perception between these two groups revealed no significant difference for all these seven countries (For China, F1,68=0.232, p=0.632; for Germany, F1,68=0.371, p=0.545; for Japan, F1,68=0.00, p=0.985; for Korea, F1,68=0.150, p=0.700; for Malaysia, F1,68=0.00, p=0.996; for Taiwan, F1,68=0.598, p=0.442; and for USA, F1,68=0.453, p=0.503). Most notably, the results suggested that high ethnocentric customers did not rate laptop computers made in Taiwan more favourably than low ethnocentric customers. Accordingly, the impact of consumer ethnocentrism on COO effect has been found insignificant for Taiwanese customers when evaluating laptop computers. In order to understand the evaluability of brand and COO, another pretest was conducted.. 15.
(25) 30 laptop computer owners were recruited to rate the following items on seven-point Likert scale: “When ‘Made in Taiwan (China)’ information is present, could you judge the product quality of a laptop computer?” and “When the ‘Made by Sony (Asus)’ information is present, could you judge the product quality of a laptop computer?” The results showed that the mean evaluability scores in Sony and Asus conditions were 5.80 and 5.67, respectively, and in Taiwan and China conditions were 4.83 and 4.43. The results suggest that brand was a more evaluable attribute than COO for laptop computer buyers. In the pretest we presented above, we asked the questions of evaluability of brand and COO directly. One might raise a concern about possible experimenter demand effects. Therefore, we conducted another test to rule out this possibility. In this test, forty participants were shown a picture of a laptop computer (without any logo or brand name on it) along with either a brand name (“Sony” or “Asus”) or a COO (“Made in Taiwan” or “Made in China”). The evaluability of brand names and COOs were measured by using the following questions: “According to the information presented, could you judge the quality of this laptop computer?” and ‘‘Do you have any idea how good this laptop computer is?’’ These items were modified from Hsee (1996). The results showed that the mean evaluability scores of brand name were 5.16, respectively, and those of COO were 3.97. Specifically, the mean evaluability scores in Sony and Asus conditions were 5.45 and 4.87, and in Taiwan and China conditions were 4.38 and 3.55. This revealed that the evaluability scores of two brand names. 16.
(26) (Sony and Asus) were both higher than those of two COOs (Taiwan and China), again corroborating that brand name was an easier-to-evaluate attribute than COO for laptop computer consumers.. 3.2 Research design and procedures This study employed a 2(COO: Taiwan vs. China)×2(Brand: Sony vs. Asus)× 2(Evaluation Mode: joint evaluation vs. separate evaluation) design in which each respondents was asked to evaluate four different laptop computers (Sony/made in Taiwan, Sony/made in China, Asus/made in Taiwan, Asus/made in China) either in joint evaluation mode or in separate evaluation mode. The sample was consisted of 232 students from three colleges in Taiwan (59 MBAs and 173 undergraduates; 104 males and 128 females) who volunteered to participate in this experiment. The students were randomly assigned in two groups. Students in one group were exposed to joint evaluation mode, and those in other group were exposed to separate evaluation mode. In joint evaluation condition, respondents saw four laptop computers printed on the same page. They were informed that they had to compare these computers first, and then rate these four computers jointly. In separate evaluation condition, four laptop computers were listed on separate pages and shown to respondents sequentially. Respondents rated each of the computers one after one. To ensure no direct comparison, respondents did not get the next page of the questionnaire until they turned in previous page. In both conditions, the order 17.
(27) of these four computers was counterbalanced to prevent biases due to the sequences. The questionnaire was written in Chinese. In the first section of the questionnaire, participants were asked to imagine that they were shopping for a laptop computer. Four different laptop computers (Sony/made in Taiwan, Sony/made in China, Asus/made in Taiwan, Asus/made in China) were the available options. The product specifications of these four computers were identical (Intel Pentium M Processor 1.73GHz; 14.1" monitor; 512MB Memory; 60GB Hard drive). To increase participants’ attention, the brand name and COO information were printed in boldface type and larger font size. Next, participants evaluated these four laptop computers by rating their perceived quality and perceived favourability of these four laptop computers. A four-item scale, modified from scales of Dodds et al. (1991) and Erevelles et al. (1999), was used to measure subjects’ perceived quality. Participants’ perceived favourability was measured by three questions proposed by Lui (2001) (see Appendix 2 for details). These items were all rated on seven-point Likert scale. The last section included questions investigating the respondents’ knowledge of laptop computers and demographic variables.. 18.
(28) Chapter 4 Results 4.1 Reliability test Prior to testing the hypotheses, the influence of respondents’ demographic characteristics (e.g. age, gender, product knowledge level) on product evaluation was analyzed. Among the demographic variables, none had a significant effect on product evaluation. The internal consistency of both scales (perceived quality and perceived favourability) had satisfactory Cronbach alphas (0.92 and 0.88). To test our hypotheses, the data were analyzed by a repeated measure MANOVA. Brand (Sony vs. Asus) and COO (Taiwan vs. China) were designed as within subjects factors, and Evaluation Mode (joint evaluation vs. separate evaluation) was a between subjects factor. The two dependent variables were perceived quality and perceived favourability.. 4.2 Tests of Hypotheses The results of MANOVA revealed significant main effects of Brand, COO, and Evaluation Mode on both perceived quality and perceived favourability. For interaction effects, only one interaction (COO×Evaluation Mode) was significant on both dependent variables. Since the MANOVA results were significant, separate repeated measure ANOVAs were performed on each of the dependent variables to identify potential differences (see Table. 19.
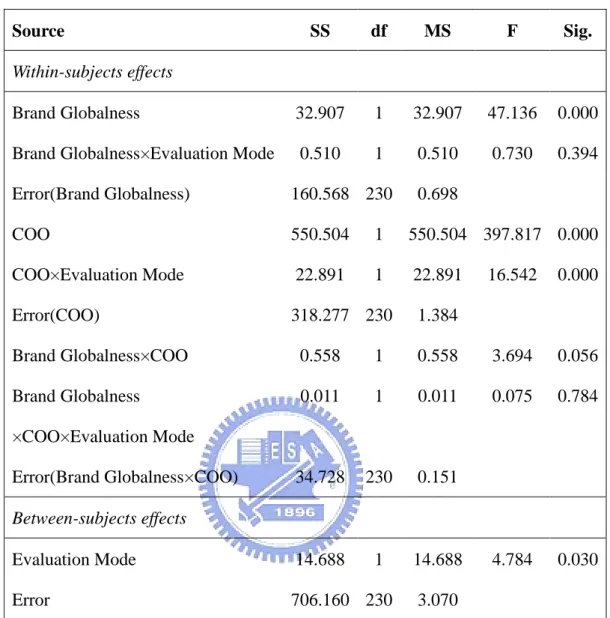
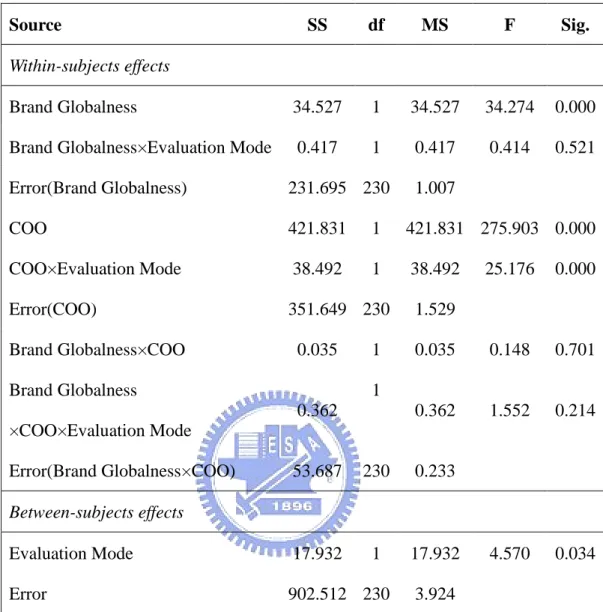
(29) III and Table IV). Significant main effect of Brand revealed that consumer product evaluations for Sony and Asus were significantly different (for perceived quality, F1, 230 = 47.136, p < 0.001; for perceived favourability, F1,. 230. =34.274, p <0.001). An examination of the mean scores. (contained in Table V) suggested respondents’ evaluations of Sony (for perceived quality, M=4.685; for perceived favourability, M=4.568) were significantly higher than those for Asus (for perceived quality, M=4.308; for perceived favourability, M=4.182). Moreover, significant main effect of COO indicated that respondents differ in their evaluations for product made in Taiwan and made in China (for perceived quality, F1, 230 = 397.817, p < 0.001; for perceived favourability, F1, 230 = 275.903, p < 0.001). Average scores revealed in Table V also showed that laptop computers made in Taiwan (for perceived quality, M=5.267; for perceived favourability, M=3.726) were evaluated better than those made in China (for perceived quality, M=5.050; for perceived favourability, M=3.701) on both perceived quality and perceived favourability. These results echoed those of our pretest. H1 predicts that COO effect on product evaluation will be weaker for products of a strong brand than for weak brand. Specifically, the effect of COO (Taiwan vs. China) on product evaluation should be stronger for laptop computers of Asus than those of Sony. However, ANOVA results on perceived quality and perceived favourability both revealed insignificant interaction effect between Brand and COO (for perceived quality, F1, 230 = 3.694,. 20.
(30) p=0.056; for perceived favourability, F1, 230 = 0.148, p=0.701). These results indicated that strong brand image did not reduce the negative COO effect on product evaluation. Therefore, H1 was not supported. H4 states that product evaluations of respondents who are exposed to JE condition will be different from those are exposed to SE condition. The ANOVA results revealed a significant main effect of Evaluation Mode on product evaluation (for perceived quality F=4.784, p<0.05; for perceived favourability F=4.570, p<0.05). The average scores revealed in Table III indicated that product evaluations of laptop computers presented in JE were higher than those presented in SE. These results supported H4. H2 states that evaluation mode (joint versus separate) will moderate consumers’ product evaluation. The ANOVA results revealed a significant main effect of Evaluation Mode on product evaluation (for perceived quality F1, 230=4.784, p<0.05; for perceived favourability F1, 230=4.570,. p<0.05). The average scores revealed in Table V indicated that product evaluations. of laptop computers presented in JE (for perceived quality, M=4.622; for perceived favourability, M=4.514) were higher than those presented in SE (for perceived quality, M=4.317; for perceived favourability, M=4.236). These results supported H2.. 21.
(31) Table III Summary of repeated measures ANOVA on perceived quality Source. SS. df. MS. F. Sig.. Brand Globalness. 32.907. 1. 32.907. 47.136. 0.000. Brand Globalness×Evaluation Mode. 0.510. 1. 0.510. 0.730. 0.394. Within-subjects effects. Error(Brand Globalness). 160.568 230. 0.698. COO. 550.504. 1. 550.504 397.817 0.000. COO×Evaluation Mode. 22.891. 1. 22.891. Error(COO). 318.277 230. 16.542. 0.000. 1.384. Brand Globalness×COO. 0.558. 1. 0.558. 3.694. 0.056. Brand Globalness. 0.011. 1. 0.011. 0.075. 0.784. 34.728. 230. 0.151. Evaluation Mode. 14.688. 1. 14.688. 4.784. 0.030. Error. 706.160 230. ×COO×Evaluation Mode Error(Brand Globalness×COO) Between-subjects effects. 22. 3.070.
(32) Table IV Summary of repeated measures ANOVA on perceived favourability Source. SS. df. MS. F. Sig.. Brand Globalness. 34.527. 1. 34.527. 34.274. 0.000. Brand Globalness×Evaluation Mode. 0.417. 1. 0.417. 0.414. 0.521. Within-subjects effects. Error(Brand Globalness). 231.695 230. COO. 421.831. 1. 421.831 275.903 0.000. COO×Evaluation Mode. 38.492. 1. 38.492. Error(COO). 351.649 230. Brand Globalness×COO. 0.035. 1. Brand Globalness. 1.007. 25.176. 0.000. 0.035. 0.148. 0.701. 0.362. 1.552. 0.214. 4.570. 0.034. 1.529. 1 0.362. ×COO×Evaluation Mode Error(Brand Globalness×COO). 53.687. 230. 0.233. Evaluation Mode. 17.932. 1. 17.932. Error. 902.512 230. Between-subjects effects. 3.924. Table V Mean scores (standard deviations) of main treatment Brand Globalness Country-of-origin Evaluation Mode. Perceived Quality. Degree of Favourability. Sony. Asus. Taiwan. China. Joint. Separate. 4.685. 4.308. 5.267. 3.726. 4.622. 4.317. (.061). (.066). (.059). (.078). (.081). (.081). 4.568. 4.182. 5.050. 3.701. 4.514. 4.236. (.073). (.073). (.070). (.083). (.092). (.092). 23.
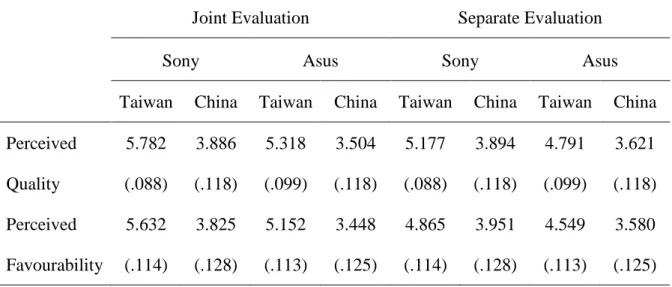
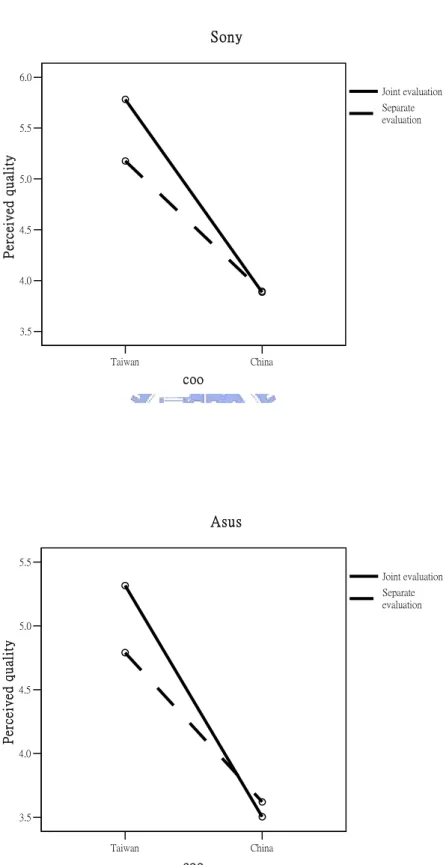
(33) H3 predicts that COO effect on product evaluation will be stronger in JE than in SE. Specifically, the difference of product evaluations between Taiwan and China conditions will be smaller in SE than in JE. The ANOVA results revealed significant interaction effect between COO and Evaluation Mode on both perceived quality and perceived favourability (for perceived quality, F1, 230=16.542, p<0.001; for perceived favourability, F1, 230=25.176, p<0.001). The means and standard deviations in each of the experimental conditions are presented in Table VI. Figure 2 depicts the interaction effect between COO and Evaluation Mode on perceived quality, and Figure 3 depicts that on perceived favourability. A similar patterns of both figures indicated that the enhanced product evaluation due to a favourable country image (Taiwan) is significantly larger when products are presented jointly than presented separately. This suggested that COO effect was stronger in JE than in SE – supporting H3.. Table VI Mean scores (standard deviations) of perceived quality and perceived favourability in each of the experimental conditions Joint Evaluation Sony. Separate Evaluation. Asus. Sony. Asus. Taiwan. China. Taiwan. China. Taiwan. China. Taiwan. China. Perceived. 5.782. 3.886. 5.318. 3.504. 5.177. 3.894. 4.791. 3.621. Quality. (.088). (.118). (.099). (.118). (.088). (.118). (.099). (.118). Perceived. 5.632. 3.825. 5.152. 3.448. 4.865. 3.951. 4.549. 3.580. Favourability. (.114). (.128). (.113). (.125). (.114). (.128). (.113). (.125). 24.
(34) Sony 6.0 Joint evaluation Separate evaluation. Perceived quality. 5.5. 5.0. 4.5. 4.0. 3.5 Taiwan. China. coo. Asus 5.5 Joint evaluation Separate evaluation. Perceived quality. 5.0. 4.5. 4.0. 3.5 Taiwan. China. coo. Figure 2 COO by Evaluation Mode interaction on perceived quality. 25.
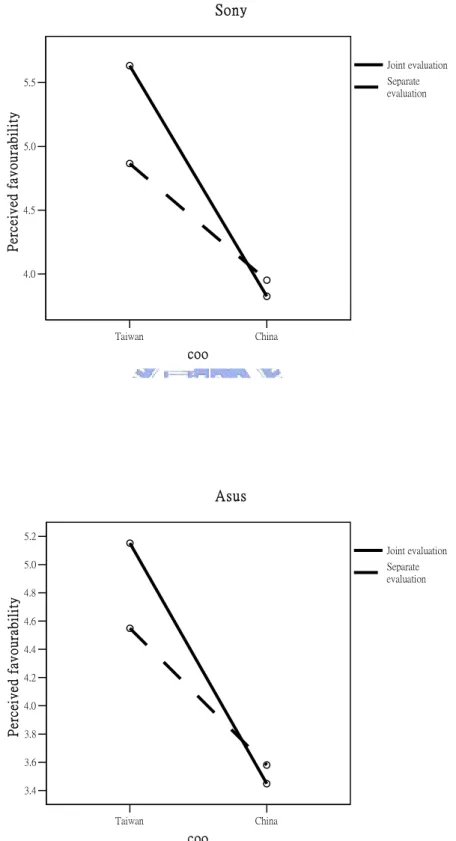
(35) Sony. Joint evaluation Separate evaluation. Perceived favourability. 5.5. 5.0. 4.5. 4.0. Taiwan. China. coo. Asus 5.2 Joint evaluation. Perceived favourability. 5.0. Separate evaluation. 4.8 4.6 4.4 4.2 4.0 3.8 3.6 3.4 Taiwan. China. coo. Figure 3 COO by Evaluation Mode interaction on perceived favourability. 26.
(36) Moreover, H4 states the brand effect on product evaluation will be weaker in JE than in SE. That is to say, the difference of product evaluations between Sony and Asus conditions should be larger in SE than in JE. However, the Brand by Evaluation Mode interaction was not significant in either ANOVA results. These results indicated that brand effect on product evaluation in JE was not significantly different from that in SE. These results did not support H4.. 4.3 Discussions The fact that main effects of Brand and COO of the study are significant suggests that both brand and COO are important determinants of consumers’ perceptions of quality and favourability. However, not supporting H1, the results indicated that brand did not interact with COO to affect perceived quality and perceived favourability. This suggests that for products of both strong brands and weak brands, COO plays an equally important role in influencing consumer product evaluation. This finding is consistent with the results reported by Cordell (1992), Tse and Gorn (1993) and Wall et al., (1991). In the globalized world today, some studies indicated that the brand name could moderate COO effects on product evaluation (Han and Terpstra, 1988; Kim and Pysarchik, 2000; Lee and Ganesh, 1999; Tse and Lee, 1993). The results of this study, however, suggest that customers’ reliance on COO information when evaluating a product did not change according to brand image. Therefore,. 27.
(37) even for a product of strong brands, the consequences caused by negative COO are still unlikely to be eliminated. In other words, producing in or sourcing to less developed countries is equally harmful to strong brands and weak brands. This conclusion is inconsistent with the results of Jo (2005) and Jo et al. (2003), which they suggested that managers of a strong brand have more options when choosing manufacturing locations. According to the foregoing discussion, managers of both strong and weak brands should take COO effect into account when formulating global sourcing strategies (Chao, 1993; Li et al., 2000). If producing in developing countries is unavoidable to achieve a cost advantage, designing adequate marketing programs to alleviate the negative impact of unfavourable manufacturing countries is imperative for marketing managers. The results of this study supported H2, indicating that consumer product evaluation changes across different evaluation modes. On average, products were judged of higher quality and viewed more favourably in JE than in SE. Significant COO by Evaluation Mode interaction in ANOVA results revealed H3 was supported. It suggests that the strength of COO effect varies under different evaluation modes. Specifically, The COO effect was stronger when consumers were exposed to JE than when they were exposed to SE. It is possible that customers are generally unable to retrieve a reference target of COO to compare with. Customers therefore have difficulty determining the product quality if COO information is present independently. In contrast, when options are presented simultaneously, consumers are. 28.
(38) able to directly compare the COO of products. A favourable COO is highlighted when compared with an unfavourable COO. The evaluation of products made in favourable COO therefore shows significant improvement in JE compared to in SE. We further analyze the effect of evaluation mode on product evaluation under different COO conditions. Figure 2 and Figure 3 reveals that a product made in a favourable country (Taiwan) can be higher rated in JE than in SE. In contrast, a product made in an unfavourable country (China) will receive a higher evaluation in SE mode than in JE mode. Further observations of Figure 2 and Figure 3 show that the difference of product evaluation between in JE and in SE is significantly larger in Taiwan condition than in China condition. In other words, the impact of evaluation mode on product evaluation is stronger for products from favourable countries than those from unfavourable countries. This suggests that marketing activities facilitating advantageous evaluation mode (JE for advanced countries; SE for developing countries) in order to enhance product evaluation are especially effective for products made in advanced countries. At the same time, empirical evidence of this study revealed that the evaluation mode did not interact with brand to influence consumers’ perceived quality and favourability of products. Thus, H4 was not supported. This could be attributed to consumers’ absorption of large amounts of brand information every day through mass media (Holt et al., 2004), and therefore they have already arrived at an opinion for many established brands. Even if there is. 29.
(39) no reference target available for comparison, customers are still capable of judging the product quality of a brand by retrieving a nature reference. As a result, different evaluation modes did not result in significant variations on brand effect.. 30.
(40) Chapter 5 Conclusions 5.1 Conclusions and Managerial implications For marketers in a multi-national enterprise, formulating an effective strategy to deal with the potential negative COO effect on consumer product evaluation is a critical issue. The results of this study could help marketers develop more effective marketing campaigns to alleviate the negative impact of COO. In practical terms, the conclusions of this study suggest that marketers should avoid having products made in less developed countries be compared directly with those made in more advanced countries. When displaying a product with an unfavourable COO, marketers should create an environment facilitating separate evaluation mode if possible. For example, for companies that have moved most of their production to developing countries (e.g. refrigerators from General Electric), they can set up dedicated counters exhibiting their products in order to prevent comparison with products from competing brands that made in advanced countries (e.g. some refrigerators from Whirlpool still made in USA). This will help improve consumers’ evaluation on quality and favourability of products from developing countries. Conversely, products made in countries with positive image should emphasize their favourable COO characteristics in marketing activities (e.g. electronic products may promote themselves as being 100% Made in Japan) and proactively provide consumers with targets (similar products with an unfavourable COO) for comparison (e.g. use comparative advertising) in order to enhance consumers’ perception of product. 31.
(41) quality (Maronick, 1995; Okechuku, 1994). For weak brands in advanced countries, a positive COO attribute could serve as a point of differentiation and source of competitive advantage when competing with the strong brands (Agrawal and Kamakura, 1999). For example, a recent survey in US indicates consumers are willing to pay a 19% premium for a steak carrying the “Guaranteed USA” label (Umberger et al., 2003). Food brands in US market that manufacturing locally could take this advantage in order to compete with strong brands.. 5.2 Limitations and future research Several limitations of the present work should be noted. First, the conclusions of current study may not be generalized to all product categories or purchase situations. This may due to the fact that some countries have acquired strong images in specific product categories (e.g. France in wines; Switzerland in watches) (Han and Terpstra, 1988; Kaynak and Cavusgil, 1983; Roth and Romeo, 1992). In another situation, certain COO labels (e.g., developing nations) are associated with high risk perception (Hampton, 1977). When evaluating products of safety concerns (e.g. foods or medicines) made in such countries, individuals are likely to rely more on COO information (Alden, et al, 1993; Bilkey and Nes, 1982) and avoid products from these countries. Under those circumstances, facilitating certain evaluation mode (joint or separate evaluation) might have less influence in countering the negative impact of COO. Furthermore, in order to have a rigorous experiment design, we controlled many variables (e.g. 32.
(42) brand familiarity, product specifications). This might reduce the external validity of the study. Therefore the findings should be interpreted with caution. Finally, this study deliberately emphasized brand and COO information. In the real world, the effect discovered by this study may not be as accentuated. Further research is needed to explore the relationships among brand, COO and evaluation mode. Future studies may wish to examine whether other factors (such as consumer knowledge, consumer ethnocentrism) will influence how evaluation mode interact with the brand and COO effects. Additionally, when other information (such as store name, price) and reference points are available, whether these factors influence the COO effect under different evaluation modes also warrants future research.. 33.
(43) References Agrawal, J. and Kamakura, W. A. (1999), "Country of origin: A competitive advantage?" International Journal of Research in Marketing, Vol. 16 No. 4, pp. 255-67. Ahmed, S. A. and d’Astous, A. (1996), "Country-of-origin and brand effects: A multi-dimensional and multi-attribute study," Journal of International Consumer Marketing, Vol. 9 No. 2, pp. 93-115. Alden, D. L., Hoyer, W. D., and Crowley, A. E. (1993), "Country-of-origin, perceived risk and evaluation strategy," in Advances in Consumer Research, McAlister, L and Rothschild M. L. (Eds.) Vol. 20. Provo, UT, Association for Consumer Research. Anderson, N. H. (1971), "Integration theory and attitude change," Psychological Review, Vol. 78 No. 3, pp. 171-206. Anderson, N. H. (1981), Foundations of information integration theory, Academic Press, New York. Bazerman, M. H., Moore, D. A., Tenbrunsel, A. E., Wade-Benzoni, K. A., and Blount, S.(1999), “Explaining how preferences change across joint versus separate evaluation,” Journal of Economic Behavior & Organization, Vol. 39 No. 1, pp. 41-58. Bilkey, W. J. and Nes, E. (1982), "Country-of-origin effects on product evaluations," Journal of International Business Studies, Vol. 13 No. 1, pp. 89-99. Chao, P. (1989), "Export and reverse investment: Strategic implications for newly industrialized countries," Journal of International Business Studies, Vol. 20 No. 1, pp. 75-91. Chao, P. (1993), "Partitioning country of origin effects: Consumer evaluations of a hybrid product," Journal of International Business Studies, Vol. 24 No. 2, pp. 291-306. Chiou, J. S. (2003), "The impact of country of origin on pretrial and posttrial product evaluations: The moderating effect of consumer expertise," Psychology & Marketing, Vol. 20 No. 10, pp. 935-54. Cho, J. and Kang, J. (2001), "Benefits and challenges of global sourcing: Perceptions of us apparel retail firms," International Marketing Review, Vol. 18 No. 5, pp. 542-61. Cordell, V. V. (1991), "Competitive context and price as moderators of country of origin preferences," Journal of the Academy of Marketing Science, Vol. 19 No. 2, pp. 123-28. Cordell, V. V. (1992), "Effects of consumer preferences for foreign sourced products," Journal 34.
(44) of International Business Studies, Vol. 23 No. 2, pp. 251-69. Cordell, V. V. (1993), "Interaction effects of country of origin with branding, price, and perceived performance risk," Journal of International Consumer Marketing, Vol. 5 No. 2, pp. 5-20. Darling, J. R. and Kraft, F. B. (1977), "A competitive profile of products and associated marketing practices of selected European and non-European countries," European Journal of Marketing, Vol. 11 No. 7, pp. 519-31. d’Astous, A. and Ahmed, S. A. (1992), "Multi-cue evaluation of made-in concept: A conjoint analysis study in Belgium," Journal of Euromarketing, Vol. 2 No. 1, pp. 9-29. Dodds, W. B., Monroe, K. B., and Grewal, D. (1991), "Effects of price, brand, and store information on buyers' product evaluations," Journal of Marketing Research, Vol. 28 No. 3, pp. 307-19. Erevelles, S., Roy, A., and Vargo, S. L. (1999), "The use of price and warranty cues in product evaluation: A comparison of us and Hong Kong consumers," Journal of International Consumer Marketing, Vol. 11 No. 3, pp. 67-91. Erickson, G. M., Johansson, J. K., and Chao, P. (1984), "Image variables in multi-attribute product evaluations: Country-of-origin effects," Journal of Consumer Research, Vol. 11 No. 2, pp. 694-99. Eroglu, S. A. and Machleit, K. A. (1989), "Effects of individual and product-specific variables on utilizing country of origin as a product quality cue," International Marketing Review, Vol. 6 No. 6, pp. 27-41. Fishbein, M. and Ajzen, I. (1975), Belief, attitude, intention, and behavior: An introduction to theory and research, Addison-Wesley, MA. Friedman, J. (1990), "Being in the world: Globalization and localization," in Featherstone, M., (Ed.), Global culture: Nationalism, globalization and modernity, Sage, London. Gaedeke, R. (1973), "Consumer attitudes toward products 'made-in' developing countries," Journal of Retailing, Vol. 49 No. 2, pp. 13-24. Gonzalez-Vallejo, C. and Moran, E. (2001), "The evaluability hypothesis revisited: Joint and separate evaluation preference reversal as a function of attribute importance," Organizational Behavior and Human Decision Processes, Vol. 86 No. 2, pp. 216-33. Hampton, G. M. (1977), "Perceived risk in buying products made abroad by American firms " Baylor Business Studies, Vol. 8 No., pp. 53-64.. 35.
(45) Han, C. M. (1989), "Country image: Halo or summary construct?" Journal of Marketing Research, Vol. 26 No. 2, pp. 222-29. Han, C. M. and Terpstra, V. (1988), "Country-of-origin effects for uni-national and bi-national," Journal of International Business Studies, Vol. 19 No. 2, pp. 235-55. Hastak, M. and Hong, S. T. (1991), "Country-of-origin effects on product quality judgments: An information integration perspective," Psychology & Marketing, Vol. 8 No. 2, pp. 129-43. Heslop, L. A. and Papadopoulos, N. (1993), "But who knows where or when: Reflections on the images of countries and their products," in Papadopoulos, N. and Heslop, L. (Eds.), Product-country images: Impact and role in international marketing, International Business Press, New York. Holt, D. B., Quelch, J. A., and Taylor, E. L. (2004), "How global brands compete," Harvard Business Review, Vol. 82 No. 9, pp. 68-75. Hong, S. T. and Wyer, R. S. (1989), "Effects of country-of-origin and product-attribute informat," Journal of Consumer Research, Vol. 16 No. 2, pp. 175-87. Hsee, C. K. (2000), "Attribute evaluability and its implications for joint-separate evaluation reversals and beyond," in Kahneman, D. and Tversky, A., (Eds.), Choices, values, and frames, Cambridge University Press, Cambridge. Hsee, C. K. (1996), "The evaluability hypothesis: An explanation for preference reversals between joint and separate evaluations of alternatives," Organizational Behavior and Human Decision Processes, Vol. 67 No. 3, pp. 247-57. Hsee, C. K., Blount, S., Loewenstein, G. F., and Bazerman, M. H. (1999), "Preference reversals between joint and separate evaluations of options: A review and theoretical analysis," Psychological Bulletin, Vol. 125 No. 5, pp. 576-90. Hsee, C. K. and Leclerc, F. (1998), "Will products look more attractive when presented separately or together?" Journal of Consumer Research, Vol. 25 No. 2, pp. 175-86. Hui, M. K. and Zhou, L. (2003), "Country-of-manufacture effects for known brands," European Journal of Marketing, Vol. 37 No. 1/2, pp. 133-53. Jacoby, J., Olson, J. C., and Haddock, R. A. (1971), "Price, brand name, and product composition characteristics as determinants of perceived quality," Journal of Applied Psychology, Vol. 55 No. 6, pp. 570-79. Janda, S. and Rao, C. P. (1997), "The effect of country-of-origin related stereotypes and personal beliefs on product evaluation," Psychology and Marketing, Vol. 14 No. 7, pp. 36.
(46) 689-702. Jo, M. S. (2005), "Why country-of-origin effects vary in consumers' quality evaluation: A theoretical explanation and implications for country-of-origin management," Journal of Global Marketing, Vol. 19 No. 1, pp. 5-25. Jo, M. S., Nakamoto, K., and Nelson, J. E. (2003), "The shielding effects of brand image against lower quality countries-of-origin in global manufacturing," Journal of Business Research, Vol. 56 No. 8, pp. 637-46. Johansson, J. K. (1989), "Determinants and effects of the use of 'made in' labels," International Marketing Review, Vol. 6 No. 1, pp. 47-58. Johansson, J. K., Douglas, S. P., and Nonaka, I. (1985), "Assessing the impact of country of origin on product evaluations: A new methodological perspective," Journal of Marketing Research, Vol. 22 No. 4, pp. 388-96. Kaynak, E. and Cavusgil, S. T. (1983), "Consumer attitudes towards products of foreign origin: Do they vary across product classes?" International Journal of Advertising, Vol. 2 No. 2, pp. 147-57. Kim, S. and Pysarchik, D. T. (2000), "Predicting purchase intentions for uni-national and bi-national products," International Journal of Retail & Distribution Management, Vol. 28 No. 6, pp. 280-91. Leclerc, F., Schmitt, B. H., and Dube, L. (1994), "Foreign branding and its effects on product perceptions and attitudes," Journal of Marketing Research, Vol. 31 No. 2, pp. 263-70. Lee, D. and Ganesh, G. (1999), "Effects of partitioned country image in the context of brand image and familiarity," International Marketing Review, Vol. 16 No. 1, pp. 18-39. Li, Z. G., Murray, L. W., and Scott, D. (2000), "Global sourcing, multiple country-of-origin facets, and consumer reactions," Journal of Business Research, Vol. 47 No. 2, pp. 121-33. Lim, J. S., Darley, W. K., and Summers, J. O. (1994), "An assessment of country of origin effects under alternative presentation formats," Journal of the Academy of Marketing Science, Vol. 22 No. 3, pp. 274-82. Lin, L. W. and Sternquist, B. (1994), "Taiwanese consumers’ perceptions of product information cues: Country of origin and store prestige," European Journal of Marketing, Vol. 28 No. 1, pp. 5-18. Liu, Y. W. (2001), "The effect of providing the compared country in the marketing mix," Unpublished Master Thesis, National Chengchi University. 37.
(47) Lopes, L. L. (1982), "Toward a procedural theory of judgment," in Tech. Rep. No. 17. Madison: Wisconsin Human Information Processing Program. Maheswaran, D. (1994), "Country of origin as a stereotype: Effects of consumer expertise and attribute strength on product evaluations," Journal of Consumer Research, Vol. 21 No. 2, pp. 354-65. Maronick, T. J. (1995), "An empirical investigation of consumer perceptions of 'made in USA' claims," International Marketing Review, Vol. 12 No. 3, pp. 15-30. Mazursky, D. and Jacoby, J. (1985), "Forming impressions of merchandise and service quality," in Jacoby, J and Olson, J. C., (Eds.), Perceived quality: How consumers view stores and merchandise, Lexington Books, MA. Mellers, B. A. and Cooke, A. D. J. (1996), "The role of task and context in preference measurement," Psychological Science, Vol. 7 No. 2, pp. 76-82. Monroe, K. B. and Krishnan, R. (1985), "The effect of price on subjective product evaluations," in Jacoby, J. and Olson, J.G., (Eds.), Perceived quality: How consumers view stores and merchandise, Lexington Books, MA. Nowlis, S. M. and Simonson, I. (1997), "Attribute-task compatibility as a determinant of consumer preference reversals," Journal of Marketing Research, Vol. 34 No. 2, pp. 205-18. Okechuku, C. (1994), "The importance of product country of origin: A conjoint analysis of the United States, Canada, Germany, and the Netherlands," European Journal of Marketing, Vol. 28 No. 4, pp. 5-19. Olson, J. C. and Jacoby, J. (1977), "Price as an informational cue: Effects on product evaluations," in Woodside, A.G. et al., (Eds.), Consumer and industrial buying behavior, North-Holland, New York. Ozretic-Dosen, D., Skare, V., and Krupka, Z. (2007), "Assessments of country of origin and brand cues in evaluating a Croatian, Western and Eastern European food product," Journal of Business Research, Vol. 60 No. 2, pp. 130-36. Peterson, R. A. and Jolibert, A. J. P. (1995), "A meta-analysis of country-of-origin effects," Journal of International Business Studies, Vol. 26 No. 4, pp. 883-96. Pharr, J. M. (2005), "Synthesizing country-of-origin research from the last decade: Is the concept still salient in an era of global brands?" Journal of Marketing Theory and Practice, Vol. 13 No. 4, pp. 34-45. Robertson, K. R. (1987), "Recall and recognition effects of brand name imagery," Psychology 38.
(48) & Marketing, Vol. 4 No. 1, pp. 3-15. Roth, M. S. and Romeo, J. B. (1992), "Matching product category and country image perceptions: A framework for managing country-of-origin effects," Journal of International Business Studies, Vol. 23 No. 3, pp. 477-97. Samiee, S. (1994), "Customer evaluation of products in a global market," Journal of International Business Studies, Vol. 25 No. 3, pp. 579-604. Schaefer, A. (1997), "Consumer knowledge and country of origin effects," European Journal of Marketing, Vol. 31 No. 1, pp. 56-72. Shimp, T. A. and Sharma, S. (1987), "Consumer ethnocentrism: Construction and validation of the CETSCALE," Journal of Marketing Research, Vol. 24 No. 3, pp. 280-89. Speece, M. and Nguyen, D. P. (2005), "Countering negative country-of-origin with low prices: A conjoint study in Vietnam," Journal of Product and Brand Management, Vol. 14 No. 1, pp. 39-48. Teas, R. K. and Agarwal, S. (2000), "The effects of extrinsic product cues on consumers' perceptions of quality, sacrifice, and value," Journal of the Academy of Marketing Science, Vol. 28 No. 2, pp. 278-90. Thakor, M. V. and Pacheco, B. G. (1997), "Foreign branding and its effects on product perceptions and attitudes: A replication and extension in a multicultural setting," Journal of Marketing Theory and Practice, Vol. 5 No. 1, pp. 15-30. Trent, R. J. and Monczka, R. M. (2005), "Achieving excellence in global sourcing," MIT Sloan Management Review, Vol. 47 No. 1, pp. 24-32. Tse, D. K. and Gorn, G. J. (1993), "An experiment on the salience of country-of-origin in the era of global brands," Journal of International Marketing, Vol. 1 No. 1, pp. 57-76. Tse, D. K. and Lee, W. N. (1993), "Removing negative country images: Effects of decomposition, branding, and product experience," Journal of International Marketing, Vol. 1 No. 4, pp. 25-48. Tversky, A. and Kahneman, D. (1974), "Judgment under uncertainty: Heuristics and biases," Science, Vol. 185 No. 4157, pp. 1124-31. Umberger, W. J., Feuz, D. M., Calkins, C. R., and Sitz, B. M. (2003), "Country-of-origin labeling of beef products: US consumers’ perceptions," Journal of Food Distribution Research, Vol. 34 No. 3, pp. 103-16. Wall, M., Liefeld, J., and Heslop, L. A. (1991), "Impact of country-of-origin cues on 39.
(49) consumer judgments in multi-cue situations: A covariance analysis," Journal of the Academy of Marketing Science, Vol. 19 No. 2, pp. 105-13. Wang, C. K. and Lamb, C. W. (1980), "Foreign environmental factors influencing American consumers' predispositions toward European products," Journal of the Academy of Marketing Science, Vol. 8 No. 4, pp. 345-56. Willemsen, M. C. and Keren, G. (2004), "The role of negative features in joint and separate evaluation," Journal of Behavioral Decision Making, Vol. 17 No. 4, pp. 313-29.. 40.
(50) Appendix I: Example of preference reversal1 Two dictionaries were interpreted as follows: Entries. Defects. Dictionary A:. 10,000. no. Dictionary B:. 20,000. yes. The Entries attribute was hard to evaluate independently. Without something to compare with, most people would not know how good a dictionary with 10,000 entries (or with 20,000 entries) is. On the other hand, the Defects attribute was relatively easy to evaluate independently even without a direct comparison. According to the evaluability hypothesis, in the joint evaluation condition, respondents would recognize that a dictionary B with 20,000 entries was relatively good and dictionary A with only 10,000 entries not as good. In the separate evaluation condition, conversely, the Defects attributes had larger impact, so that most people would find dictionary A more attractive than dictionary B.. 1. Source: Hsee, C.K. (1996), “The evaluability hypothesis: an explanation for preference reversals between joint and separate evaluations of alternatives,” Organizational Behavior and Human Decision Processes, Vol 67 No 3, pp. 247-57. 41.
(51) Appendix II: The perceived quality and perceived favourability scales. Perceived Quality (Dodds et al., 1991; Erevelles et al., 1999) 1. This laptop computer should be of : (very good quality to very poor quality) 2. This laptop computer would seem to be durable (strongly agree to strongly disagree) 3. The likelihood that this laptop computer would be reliable is (very high to very low) 4. The workmanship of this laptop computer would be (very high to very low). Perceived favourability (Lui, 2001) 1. I like this laptop computer (strongly agree to strongly disagree) 2. This laptop computer seems great (strongly agree to strongly disagree) 3. This laptop computer attracts me (strongly agree to strongly disagree). 42.
(52) Appendix III: Questionnaire for the pretest 您好: 我是交通大學管理科學研究系博士研究生,目前正在進行一項『品牌對來源國效 果的影響』之研究,本問卷旨在了解消費者對現存筆記型電腦品牌之品質知覺與來源 國形象的認知程度,以作為未來進一步研究的依據,因此需要您提供寶貴的意見。 本問卷採無記名方式,資料僅供學術研究使用,請安心作答,謝謝!! 國立交通大學管理科學研究所 指導老師: 朱博湧 博士 博士生: 陳佳誼 敬上. 第一部分: 請針對以下數個『筆記型電腦』品牌,依您個人的看法,對下述問題在適當的□內打勾。 1 代表程度愈低;5 代表程度愈高。. ★ 對我而言,這個品牌的知名度很高: 非 常 不 同 意. 不 同 意. Apple(蘋果). 1 □. 2 □. 3 □. 4 □. 5 □. Acer(宏碁). □. □. □. □. □. ASUS(華碩). □. □. □. □. □. BenQ(明基). □. □. □. □. □. Dell(戴爾). □. □. □. □. □. HP(惠普). □. □. □. □. □. IBM LEMEL(聯強). □. □. □. □. □. □. □. □. □. □. SONY(索尼). □. □. □. □. □. TOSHIBA. □. □. □. □. □. 筆記型電腦. 43. 無 意 見. 同 意. 非 常 同 意.
(53) ★ 我覺得這個品牌的筆記型電腦的品質很好: 非 常 不 同 意. 不 同 意. Apple(蘋果). 1 □. 2 □. 3 □. 4 □. 5 □. Acer(宏碁). □. □. □. □. □. ASUS(華碩). □. □. □. □. □. BenQ(明基). □. □. □. □. □. Dell(戴爾). □. □. □. □. □. HP(惠普). □. □. □. □. □. IBM LEMEL(聯強). □. □. □. □. □. □. □. □. □. □. SONY(索尼). □. □. □. □. □. TOSHIBA. □. □. □. □. □. 筆記型電腦. 無 意 見. 同 意. 非 常 同 意. ★ 我覺得這個品牌的筆記型電腦很耐用: 非 常 不 同 意. 不 同 意. Apple(蘋果). 1 □. 2 □. 3 □. 4 □. 5 □. Acer(宏碁). □. □. □. □. □. ASUS(華碩). □. □. □. □. □. BenQ(明基). □. □. □. □. □. Dell(戴爾). □. □. □. □. □. HP(惠普). □. □. □. □. □. IBM LEMEL(聯強). □. □. □. □. □. □. □. □. □. □. SONY(索尼). □. □. □. □. □. TOSHIBA. □. □. □. □. □. 筆記型電腦. 44. 無 意 見. 同 意. 非 常 同 意.
數據
+4
相關文件
• Information retrieval : Implementing and Evaluating Search Engines, by Stefan Büttcher, Charles L.A.
資料來源 :Kotler, Philip and Armstrong, Gary (2006) “Consumer Markets and Consumer Buyer Behaviour”, Principles of Marketing, 11 th ed., ch. 5, Pearson Prentice Hall, Upper
Peppard, J., “Customer Relationship Management (CRM) in Financial Services”, European Management Journal, Vol. H., "An Empirical Investigation of the Factors Influencing the
“ Consumer choice behavior in online and traditional supermarkets: the effects of brand name, price, and other search attributes”, International Journal of Research in Marketing,
and Kasper, H.D.P., “The impact of Satisfaction on Brand Loyalty: Urging on Classifying Satisfaction and Brand Loyalty,” Journal of Consumer Satisfaction, Dissatisfaction
(1982), “An Investigation into the Determinants of Customer Satisfaction,” Journal of Marketing Research, Vol. 1996), “Relationship Marketing in Consumer Markets,” Journal
(2000), “Assessing the Effects of Quality, Value, and Customer Satisfaction on Consumer Behavioral Intentions in Service Environments,” Journal of Retailing, Vol. (2001),
Thus, the purpose of this study is to determine the segments for wine consumers in Taiwan by product, brand decision, and purchasing involvement, and then determine the
