國立交通大學
材料科學與工程學系
博 士 論 文
雙效型氣體擴散電極與高表面積碳凝膠製備
及電化學分析
Material Synthesis, Characterization, and
Electrochemical Analysis for Bi-functional Gas Diffusion
Electrodes and Carbon Ambient Gels
研 究 生:張雲閔
指導教授:吳樸偉 教授
雙效型氣體擴散電極與高表面積碳凝膠製備
及電化學分析
Material Synthesis, Characterization, and Electrochemical
Analysis for Bi-functional Gas Diffusion Electrodes and Carbon
Ambient Gels
研 究 生:張雲閔 Student: Yun-Min Chang
指導教授:吳樸偉 教授 Advisor: Professor Pu-Wei Wu
國 立 交 通 大 學
材料科學與工程學系
博 士 論 文
A Thesis
Submitted to Department of Materials Science and Engineering College of Engineering
National Chiao Tung University in Partial Fulfillment of the Requirements
for the Degree of Doctor of Philosophy in
Materials Science and Engineering July 2012
Hsinchu, Taiwan, Republic of China
i
雙效型氣體擴散電極與高表面積碳凝膠製備及電化學分析
研究生:張雲閔 指導教授:吳樸偉 教授
國立交通大學 材料科學與工程學系摘要
本 研 究 利 用 檸 檬 酸 鹽 法 (amorphous citrate precursor) 合 成 化 學 劑 量 比 為 La0.6Ca0.4Co0.8Ru0.2O3 粉 末 。 此 外 , 利 用 固 態 燒 結 法 (solid-state reaction) 合 成 La0.6Ca0.4CoxRu1-xO3的鈣鈦礦氧化物(x = 0、0.2、0.4、0.6、0.8 及 1)粉末。由 X 光粉末繞射(XRD)可觀察到主相為鈣鈦礦的 La0.6Ca0.4CoO3,表示成功的將 Ru4+ 插層入 La0.6Ca0.4CoO3 相中,元素組成(EDX)分析結果亦與合成時比例一致。在 鹼性 KOH 溶液中,利用 H2O2分解反應測試其催化效能,La0.6Ca0.4Co0.8Ru0.2O3 展現出優於 La0.6Ca0.4CoO3之催化活性,推測在氧氣還原反應中,Ru 摻雜後催化 活性被提升。類似的情形可利用氧氣還原極化曲線佐證,實驗中以 Black Pearl 2000 (BP2000)當作氣體擴散層的觸媒載體。在恆定電流長時間放電評估, La0.6Ca0.4Co0.8Ru0.2O3/BP2000 皆 有穩定的 電流輸出。另一方 面,在氫 氣氧化 (hydrogen evolution reaction)與氧氣還原(oxygen reduction reaction)極化曲線反應 中,La0.6Ca0.4CoxRu1-xO3/BP2000 相較於 La0.6Ca0.4CoO3/BP2000 皆表現出較佳的 雙 效 催 化 活 性 , 在 SSR 法 La0.6Ca0.4CoxRu1-xO3/BP2000 系 統 中 , La0.6Ca0.4Co0.4Ru0.6O3/BP2000 具有最佳的雙功能催化活性。
研究中,採用機械研磨法研磨 La0.6Ca0.4CoO3 與 IrO2 粉末,成功的製備出 La0.6Ca0.4CoIr0.25O3.5-δ觸媒。另一方面,利用檸檬酸鹽法合成在鹼性電解液下具有
ii 氧還原與氧生成的 La0.6Ca0.4Co0.8Ir0.2O3 雙效觸媒。粉末 XRD 圖中展現出以 La0.6Ca0.4CoO3為主相,表示 Ir4+成功進入鈣鈦礦 Co 的位置。在電化學分析中, La0.6Ca0.4CoIr0.25O3.5-δ/CNCs 與 La0.6Ca0.4Co0.8Ir0.2O3/CNCs 觸 媒 相 對 於 La0.6Ca0.4CoO3/CNCs,不論是放電或充電電流對電壓極化曲線皆有較優越的性能 表現,比較 Ru 與 Ir 摻雜入 La0.6Ca0.4CoO3中,兩者的還原反應電催化性能相近。 此外,以表面電位(Zeta Potential)測量表面電位,La0.6Ca0.4Co0.8Ir0.2O3 相對於 La0.6Ca0.4Co0.8Ir0.2O3有顯著變化。最後,以連續 3 小時為一循環重複氧還原反應/ 靜置/氧氧化反應,La0.6Ca0.4Co0.8Ir0.2O3/CNCs 觸媒呈現穩定與持續耐久度。 對於提升電化學活性,除了合成適當的觸媒,開發適當的觸媒載體是另一關 鍵議題,因此,本研究利用間苯二酚-甲醛(resorcinol-formaldehyde)的縮合反應合 成碳常壓凝膠,做為電化學電雙層電容探討研究,其中反應中選擇醋酸為催化劑, 樣品濃度 R:F 為 1:2,R:C 比例控制為 5:1 與 10:1,接下來經過溶劑交換、熱裂 解與二氧化碳活化。在溶劑的交換過程可避免乾燥過程中結構收縮,再經過二氧 化碳活化後,我們能到得到多孔性的碳結構,其表面積達到 3419 m2 g-1。由 SEM 觀察到相互交連的泡沫狀結構,由 BET 證實有大量的微孔與中孔。電容特性與 動力學探討部分,使用鈦孔穴電極做電化學分析量測,所使用的技術有定電流充 放 電 法 (Current Reversal Chronopotentiometry, CRC) , 循 環 伏 安 法 (Cyclic Voltammetry, CV), 以及交流阻抗法(Electrochemical Impedance Spectroscopy, EIS) 法。由 CV 與 CRC 結果得知,我們所合成出的碳常壓空氣凝膠相對於市售的 BP2000 具有較佳的比電容與持續耐久度。舉例來說,在電位區間為 0-1 V,1 Ag-1 得充放電條件下,比電容值為 324.8 Fg-1,相對來說,沒有經過活化處理的樣品, 雖然有類似的相型態,但表面積與比電容大幅降低至 449 m2
iii
Material Synthesis, Characterization, and Electrochemical
Analysis for Bi-functional Gas Diffusion Electrodes
and Carbon Ambient Gels
Student: Yun-Min Chang Advisor: Professor Pu-Wei Wu
Department of Materials Science and Engineering National Chiao Tung University
Abstract
We employed an amorphous citrate precursor (ACP) method to synthesize stoichiometric La0.6Ca0.4Co0.8Ru0.2O3 powders. Besides, a variety of La0.6Ca0.4CoxRu1-xO3 perovskite oxide (x=0, 0.2, 0.4, 0.6, 0.8, and 1) were fabricated by solid-state reaction (SSR) method to form oxide powder with various ruthenium (Ru) ratios. X-ray diffraction profiles (XRD) of the as-synthesized powders exhibited the major phase identical is La0.6Ca0.4CoO3, indicating successful incorporation of Ru4+ at the Co cation sites. ACP-derived La0.6Ca0.4Co0.8Ru0.2O3 exhibited a higher H2O2 decomposition rate in KOH solution as opposed to that of ACP-derived La0.6Ca0.4CoO3, which suggested an improved catalytic ability for the oxygen reduction reaction (ORR). In ORR and hydrogen evolution reaction (HER) I-V polarization curves, the SSR-derived La0.6Ca0.4CoxRu1-xO3/BP2000 revealed an enhanced bi-functional catalytic ability in comparison with those of La0.6Ca0.4CoO3/BP2000. La0.6Ca0.4CoIr0.25O3.5-δ was prepared by a mechanical alloying process from mixtures of La0.6Ca0.4CoO3 and IrO2. The ACP method was
iv
employed to prepare perovskite La0.6Ca0.4Co0.8Ir0.2O3 as a bi-functional electrocatalyst for ORR and HER in an alkaline electrolyte. The XRD pattern of the as-synthesized powders exhibited the major phase is La0.6Ca0.4CoO3, indicating successful incorporation of Ir4+ at the Co cation sites. Supported on carbon Nanocapsules (CNCs), the La0.6Ca0.4CoIr0.25O3.5-δ and La0.6Ca0.4Co0.8Ir0.2O3 particles demonstrated superior performances than those of La0.6Ca0.4CoO3 in both charging and discharging I-V polarizations. For Ru and Ir doped into La0.6Ca0.4CoO3, the electrochemical capabilities displayed similar performance for the ORR. In life time determinations, La0.6Ca0.4Co0.8Ir0.2O3/CNCs delivered a stable and sustainable behavior with moderate degradation.
In addition to synthesis of suitable electrocatalyst, the other critical issue is to identify appropriate material as electrocatalyst support. Therefore, a resorcinol–formaldehyde (R-F) condensation reaction catalyzed by acetic acid (C) is employed to prepare the carbon ambient gels for electrochemical double layer capacitors. The samples was fabricated with a R:F ratio of 1:2 and R:C ratios of 5:1 and 10:1, followed by solvent exchange, pyrolysis, and CO2 activation. The solvent exchange allowed negligible structure contraction upon drying, and after CO2 treatment, we were able to produce porous carbons with a surface area of 3419 m2g-1. Electrochemical analysis including cyclic voltammetry (CV), current reversal chronopotentiometry (CRC), and impedance spectroscopy are conducted using a titanium cavity electrode so relevant capacitive characteristics and kinetic parameters could be determined. Both CV and CRC results indicate specific capacitances and life time behaviors are comparable or even better than those of BP 2000.
v
Acknowledgement
六年,是可以從小養成小孩品格的教育期間,也是學生我完成交大博士的一 段重要歷程;在這段可以創造、探索、自我充實與學習的階段,除了完成這份成 果報告-博士論文之外,也讓我獲得許多不同經歷與收穫。 首先,感謝吳樸偉教授的細心教導;在他身上,讓我除了獲得專業的研究知 識外,也體驗到許多做人處事道理;另外,感謝王禎翰、葉宗洸、張淑閔、陳錦 毅、謝宗雍等五位教授,不辭辛勞前往交大材料系,指導學生論文與提醒修正, 讓學生的論文更趨於完備。 在研究的過程中,特別感謝吳成有博士,因為吳博士不嫌麻煩的分享了他對 於學生研究上的建議與經費上的支持,才能夠讓學生無後顧之憂的完成研究;然 而,研究的過程中總是會遭遇許多瓶頸與挫折,但幸好有俊翰學弟分享天馬行空 的想法,讓我透過多角度的層面,讓實驗過程中增添更多可能性與研究成果;另 外還有育淇學弟,因為有你的共同打拼精神,讓冗長的實驗過程,不會因為等待 結果而顯得枯燥乏味。 團結力量大,這句話已是老生常談,但也是不可挑戰的真理;學生在研究期 間,所發表的多篇期刊、完成的多項計畫與多場次研討會的共同參與,著實讓學 生的研究生活充實與獲得,但是,學生了解,這樣的經歷,透過學生一個人是沒 有辦法完成的,因此再次感謝吳樸偉教授的細心指導,以及-瀠方、儷曄、致源、 映眉、柏均、于凡、茹夢、庭瑜與哲瑋學弟妹的幫忙,還有英文能力比美國人還 棒立忠學弟給予英文上的協助,也要感謝生活中給予實質或精神支持的同學朋友 -勝結、逸凡、玉塵、兆玲、境妤、議文、儷尹、冠傑、尊偉、孟翰、意德、世 儒、毓真、致芳、欣君、晨宏、咏錚、和成、耕余、佑慈、佳勳、筱琳、詠策、 陳琪、婉瑩、亮余、柏翰、欣儀、依叡、建程、雁汝、韋霖、宥閔、華真與喬君vi 們實驗上的協助,因為有你們,讓我六年的博士生生活,多采多姿與樂趣。 最後,特別感謝在背後默默給予我支援的爸媽和老婆靈意,因為有你們的支 持得以讓我心無旁鶩,專心致力於課業及研究上。本研究能夠進行得如此順遂, 以及論文能如期完成,不只是我個人的努力還要承蒙大家不吝相助,僅此榮耀獻 給大家。
vii
Contents
摘要... i Abstract ... iii Acknowledgement ... v Contents ... vii List of Tables ... xiList of Figures ... xii
List of Symbols ... xviii
Chapter 1 Introduction ... 1
1.1 Background ... 1
1.2 Motivations ... 2
Chapter 2 Literature Review ... 5
2.1 Alkaline fuel cells ... 5
2.2 Perovskite structure ... 6
2.3 Oxygen reduction reaction ... 8
2.4 Bi-functional electrocacatlysts ... 9
viii
2.6 Supercapacitors ... 12
2.7 Resorcinol-formaldehyde carbon gels ... 14
Chapter 3 Experimental ... 16
3.1 Materials ... 16
3.2 Experimental flowchart ... 17
3.2.1 Flowchart for preparation of perovskite catalysts ... 17
3.2.2 Flowchart for preparation of carbon ambient gels ... 18
3.3 Synthesis of ACP-derived La0.6Ca0.4Co0.8Ru0.2O3 and La0.6Ca0.4Co0.8Ir0.2O3 ... 18
3.4 Synthesis of SSR-derived La0.6Ca0.4CoxRu1-xO3 ... 19
3.5 Synthesis of La0.6Ca0.4CoIr0.25O3.5-δ ... 19
3.6 Fabrication of gas diffusion electrodes ... 20
3.7 Synthesis of carbon ambient gels ... 20
3.8 Material characterization ... 22
3.8.1 X-ray diffraction (XRD) ... 22
3.8.2 Scanning electron microscope (SEM) ... 22
3.8.3 Brunauer, Emmett, and Teller (BET) ... 23
ix
3.8.5 zeta potential ... 23
3.8.6 Raman spectroscopy ... 23
3.8.7 H2O2 decomposition measurement ... 23
3.9 Electrochemical measurements ... 24
3.9.1 Gas diffusion electrode (GDE) ... 24
3.9.2 Titanium Cavity Electrode (TCE) ... 25
Chapter 4 Synthesis and Characterization of La0.6Ca0.4CoxRu1-xO3 for Bi-functional Electrodes ... 26 4.1 Physico-chemical characterizations ... 26 4.1.1 ACP-derived La0.6Ca0.4Co0.8Ru0.2O3 ... 26 4.1.2 SSR-derived La0.6Ca0.4Co0.4Ru0.6O3 ... 37 4.2 Electrochemical characterizations ... 44 4.2.1 ACP-derived La0.6Ca0.4Co0.8Ru0.2O3 ... 44 4.2.2 SSR-derived La0.6Ca0.4Co0.4Ru0.6O3 ... 53
Chapter 5 Synthesis and Characterization of La0.6Ca0.4CoIr0.25O3.5-δ and La0.6Ca0.4Co0.8Ir0.2O3 for Bi-functional Electrodes ... 63
5.1 Physico-chemical characterizations ... 63
x
Chapter 6 Synthesis of Large Surface Area Carbon Ambient Gels for
Electrochemical Double Layer Capacitors ... 86
6.1 Structural characterizations ... 86
6.2 Electrochemical characterizations ... 92
Chapter 7 Conclusions and Future Work ... 105
7.1 Conclusions ... 105
7.2 Future works ... 107
References ... 109
Vita ... 130
xi
List of Tables
Table 3.1 Precursors and catalyst used for the synthesis of carbon ambient gels. ... 22
Table 4.1 The decomposition rate for La0.6Ca0.4Co0.8Ru0.2O3 and La0.6Ca0.4CoO3. ... 34
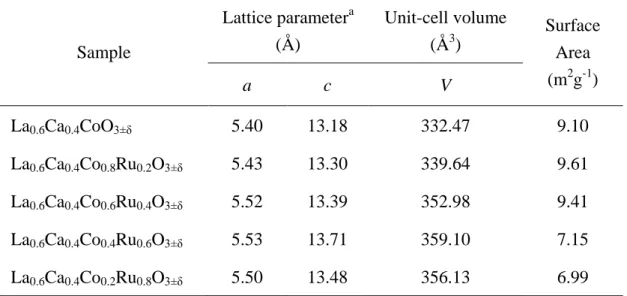
Table 4.2 The summary of physical behavior for La0.6Ca0.4Co1-xRuxO3. ... 39
Table 4.3 EDX results of La0.6Ca0.4Co1-xRuxO3. ... 44
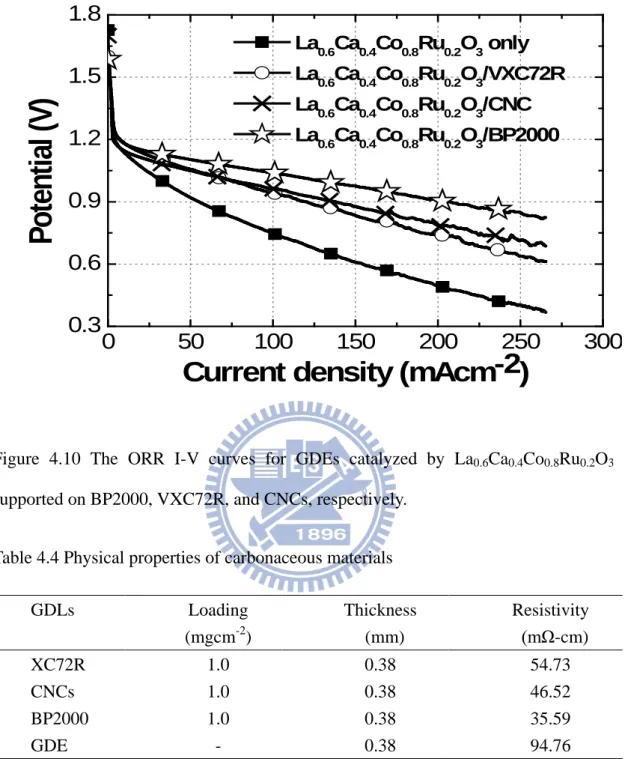
Table 4.4 Physical properties of carbonaceous materials ... 45
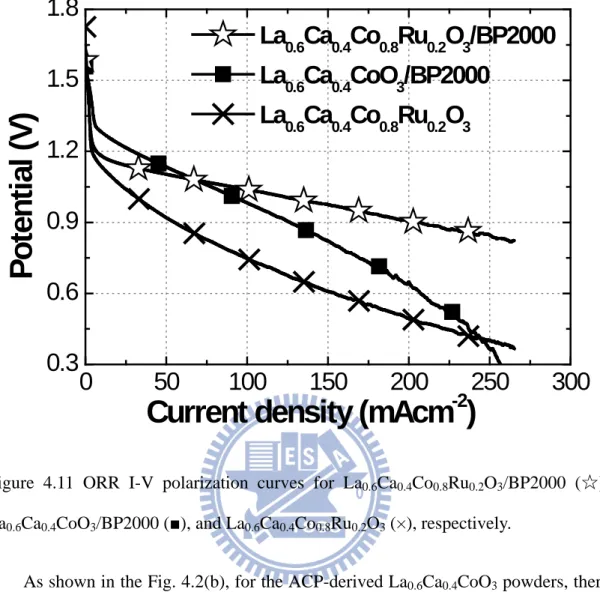
Table 4.5 Voltages at selective current densities in unit of mAcm-2 in the ORR I-V curves for La0.6Ca0.4Co0.8Ru0.2O3/BP2000, La0.6Ca0.4CoO3/BP2000, and La0.6Ca0.4Co0.8Ru0.2O3. ... 46
Table 6.1 Relevant parameters for the pore properties determined by nitrogen adsorption and desorption isotherms from GA, GB, GC, and GD, respectively. ... 90
Table 6.2 Values of specific capacitance (Fg-1) calculated from CV profiles in various potential windows at 20 mVs-1 scan rate. ... 94
Table 6.3 Values of specific capacitance (Fg-1) calculated from CV profiles at various scan rates in potential window of 0-1 V. ... 96
Table 6.4 Relevant parameters determined from the CRC measurements at ±1 Ag-1 in potential window of 0-1 V. ... 99
Table 6.5 Parameters from fitting impedance spectra obtained at the open circuit voltage ... 102
xii
List of Figures
Figure 2.1 The structure of an alkaline fuel cell. ... 6 Figure 2.2 The structure of perovskite with a chemical formula ABO3. ... 7 Figure 4.1 A representative TGA profile for the polymeric precursor of
La0.6Ca0.4Co0.8Ru0.2O3 ... 27 Figure 4.2 XRD for the as-synthesized (a) La0.6Ca0.4Co0.8Ru0.2O3 and (b)
La0.6Ca0.4CoO3. Also shown is the standard pattern of La0.6Ca0.4CoO3 from JCPDS 35.1389. ... 29 Figure 4.3 SEM images for the as-synthesized (a) La0.6Ca0.4Co0.8Ru0.2O3 and (b)
La0.6Ca0.4CoO3. ... 30 Figure 4.4 Plots of ln([H2O2]0/[H2O2]t) as a function of time for (a)
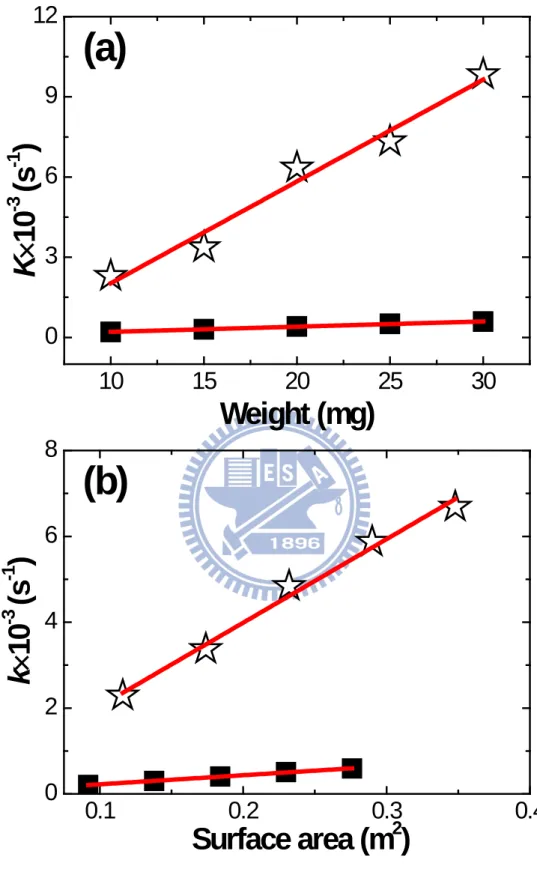
La0.6Ca0.4Co0.8Ru0.2O3 and (b) La0.6Ca0.4CoO3 at 0.01 (■), 0.015 (○), 0.02 (▲), 0.025 (×), and 0.03 g (☆), respectively. ... 33 Figure 4.5 Plot of k as a function of actual surface area for La0.6Ca0.4Co0.8Ru0.2O3
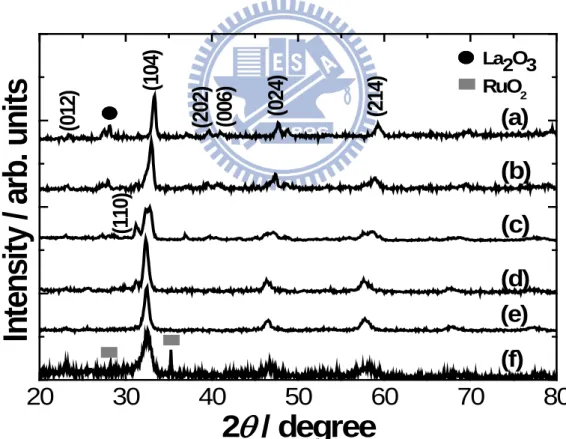
(☆) and La0.6Ca0.4CoO3 (■). ... 36 Figure 4.6 The XRD pattern of the La0.6Ca0.4Co1-xRuxO3 with x=(a) 0, (b) 0.2, (c)
0.4, (d) 0.6, (e) 0.8, and (f) 1. ... 37 Figure 4.7 The unit cell volume versus the stoichmetric Ru. ... 38 Figure 4.8 SEM images of (a) La0.6Ca0.4CoO3 (b) La0.6Ca0.4Co0.8Ru0.2O3 (c)
xiii
La0.6Ca0.4Co0.6Ru0.4O3 (d) La0.6Ca0.4Co0.4Ru0.6O3 (e) La0.6Ca0.4Co0.2Ru0.8O3. (— scale bar 1μm) ... 41
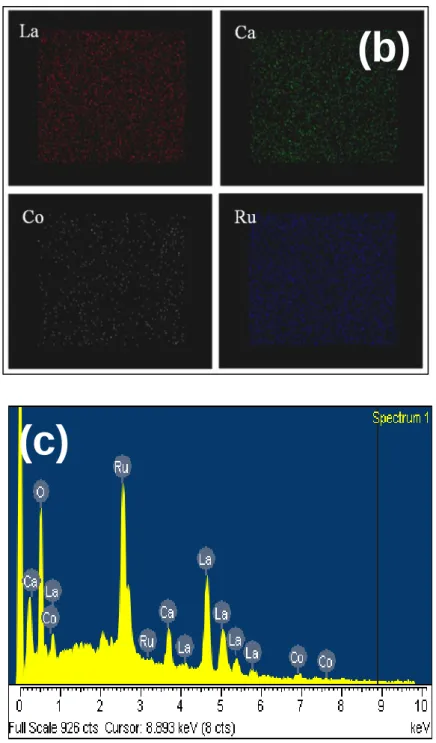
Figure 4.9 SEM of La0.6Ca0.4Co0.2Ru0.8O3 in (a) image, (b) mapping, (c) and EDX. .. 43 Figure 4.10 The ORR I-V curves for GDEs catalyzed by La0.6Ca0.4Co0.8Ru0.2O3
supported on BP2000, VXC72R, and CNCs, respectively. ... 45 Figure 4.11 ORR I-V polarization curves for La0.6Ca0.4Co0.8Ru0.2O3/BP2000 (☆),
La0.6Ca0.4CoO3/BP2000 ( ■ ), and La0.6Ca0.4Co0.8Ru0.2O3 (×), respectively. ... 47 Figure 4.12 The ORR I-V curves for the GDEs catalyzed by
La0.6Ca0.4Co0.8Ru0.2O3/BP2000, Co3O4/BP2000, and La2O3/BP2000, respectively. Also shown is the noncatalyzed GDE for comparison purpose ... 48 Figure 4.13 Impedance spectra for the (a) La0.6Ca0.4Co0.8Ru0.2O3/BP2000 and (b)
La0.6Ca0.4CoO3/BP2000 at open-circuit voltage (□), and overpotentials of −100 mV (○), −200 mV (×), and −300 mV (☆), respectively. (c) is the equivalent circuit model used to fit the impedance spectra. ... 51 Figure 4.14 Galvanostatic ORR profiles for La0.6Ca0.4Co0.8Ru0.2O3/BP2000 at
current densities of 10 (■), 50 (○), 100 (×), and 200 (☆) mAcm-2 ... 52 Figure 4.15 Life time performance for La0.6Ca0.4Co0.8Ru0.2O3/BP2000 (☆) at
current density of 10 mAcm-2. ... 53 Figure 4.16 The discharging I-V polarization curves of
xiv
La0.6Ca0.4Co1-xRuxO3/BP2000 ... 54 Figure 4.17 The galvanostatic discharge curves for the (a)
La0.6Ca0.4Co0.8Ru0.2O3/BP2000 (b) La0.6Ca0.4Co0.6Ru0.4O3/BP2000 (c) La0.6Ca0.4Co0.2Ru0.8O3/BP2000 at current densities of 10 mAcm-2 (■), 50 mAcm-2 (△), 100 mAcm-2 (●), 150 mAcm-2 (×), and 200 mAcm-2 (☆) ... 56 Figure 4.18 The I-V polarization curves of the La0.6Ca0.4Co0.4Ru0.6O3/BP2000
GDE and the catalyzed GDEs with electrocatalysts of Ag/CNC, commercial EVT-Mn, and commercial EVT-MnCo ... 57 Figure 4.19 The charging I-V polarization curves of La0.6Ca0.4Co1-xRuxO3/BP2000 .. 58 Figure 4.20 The galvanostatic charge curves for the (a) La0.6Ca0.4CoO3/BP2000(b)
La0.6Ca0.4Co0.8Ru0.2O3/BP2000 (c) La0.6Ca0.4Co0.4Ru0.6O3/BP2000 at current densities of 10 mAcm-2 (■), 50 mAcm-2 (△), 100 mAcm-2 (●), 150 mAcm-2 (×), and 200 mAcm-2 (☆). ... 60 Figure 4.21 The life time testing of the La0.6Ca0.4Co0.4Ru0.6O3/BP2000 GDE for
100 h discharge followed by 100 h charge at a constant current density of 30 mAcm-2 ... 61 Figure 4.22 The SEM images of La0.6Ca0.4Co0.4Ru0.6O3/BP2000 GDE (a) before
and (b) after life time testing ... 62 Figure 5.1 X-ray results of (a) IrO2, (b) ACP-derived La0.6Ca0.4CoO3, (c)
La0.6Ca0.4CoIr0.25O3.5-δ from the mechanical alloying process, and (d) ACP-derived La0.6Ca0.4Co0.8Ir0.2O3 ... 65
xv
Figure 5.2 The XRD profile of the SSR-derived La0.6Ca0.4CoO3 from SSR route. ... 67 Figure 5.3 The SEM image of (a) La0.6Ca0.4CoIr0.25O3.5-δ after the mechanical
alloying process, (b) La0.6Ca0.4CoO3, and (c) ACP-derived La0.6Ca0.4Co0.8Ir0.2O3 ... 69 Figure 5.4 The EDX mapping of La0.6Ca0.4CoIr0.25O3.5-δ ... 70 Figure 5.5 Images for CNCs from TEM ... 71 Figure 5.6 The discharging I-V polarization curves of the noncatalyzed GDE, and
catalyzed GDEs with electrocatalysts of IrO2/CNCs, La0.6Ca0.4CoO3, La0.6Ca0.4CoO3/CNCs, and La0.6Ca0.4CoIr0.25O3.5-δ/CNCs ... 73 Figure 5.7 The charging I-V polarization curves of the noncatalyzed GDE and
catalyzed GDEs with electrocatalysts of IrO2/CNCs, La0.6Ca0.4CoO3/CNCs, and La0.6Ca0.4CoIr0.25O3.5-δ/CNCs ... 74 Figure 5.8 La0.6Ca0.4CoO3/CNCsgalvanostatic discharging curves at (a) 25 and
(b) ● 100 mAcm-2 and charging curves at (c) ◆ 25 and (d) ★ 100 mAcm-2. La0.6Ca0.4CoIr0.25O3.5-δ/CNCs galvanostatic discharging curves at (a) ╳ 25 and (b) 100 mAcm-2 and charging curves at (c) 25 and (d) ○ 100 mAcm-2
. ... 75 Figure 5.9 Oxygen reduction I-V polarization curves of MnOx, noncatalyzed GDE,
and catalyzed GDEs with La0.6Ca0.4Co0.8Ir0.2O3 only, La0.6Ca0.4CoO3/CNCs, and ACP-derived La0.6Ca0.4Co0.8Ir0.2O3/CNCs. .... 77 Figure 5.10 Oxygen evolution I-V polarization curves of noncatalyzed GDE and
xvi
catalyzed GDEs with ACP-derived La0.6Ca0.4Co0.8Ir0.2O3/CNCs, La0.6Ca0.4CoO3/CNCs, and IrO2/CNCs ... 78 Figure 5.11 Oxygen reduction I-V polarization curves of noncatalyzed GDE and
catalyzed GDEs with La0.6Ca0.4CoIr0.25O3.5-δ/CNCs and ACP-derived La0.6Ca0.4Co0.8Ir0.2O3/CNCs ... 79 Figure 5.12 Oxygen reduction I-V polarization curves of ACP-derived
La0.6Ca0.4Co0.8Ru0.2O3/CNCs and ACP-derived La0.6Ca0.4Co0.8Ir0.2O3/CNCs ... 80 Figure 5.13 Zeta potential responses for ACP-derived La0.6Ca0.4Co0.8Ir0.2O3 and
La0.6Ca0.4CoO3. ... 81 Figure 5.14 Oxygen reduction galvanostatic curves for the ACP-derived
La0.6Ca0.4Co0.8Ir0.2O3/CNCs at current densities of 50 mAcm-2 (☆) and 100 mAcm-2 (○), as well as La0.6Ca0.4CoO3/CNCs at current densities of 50 mAcm-2 (▲) and 100 mAcm-2 (×) ... 82 Figure 5.15 Oxygen evolution galvanostatic curves for ACP-derived
La0.6Ca0.4Co0.8Ir0.2O3/CNCs at current densities of 50 mAcm-2 (☆) and 100 mAcm-2 (○), as well as La0.6Ca0.4CoO3/CNCs at current densities of 50 mAcm-2 (▲) and 100 mAcm-2 (×) ... 84 Figure 5.16 The cycle life performance for the ACP-derived
La0.6Ca0.4Co0.8Ir0.2O3/CNCs-catalyzed GDE. ... 85 Figure 6.1 SEM images for sample (a) GA, (b) GB, (b) GC, and (d) GD ... 89
xvii
Figure 6.2 N2 adsorption/desorption isotherms of sample GA (□), GB (●), GC (☆), and GD (╳). ... 91 Figure 6.3 Raman spectra for sample GA, GB, GC, and GD ... 92 Figure 6.4 CV profiles at 20 mVs-1 from sample GC in potential windows of (a)
0-0.6 V, (b) 0-0.8 V, (c) 0-1 V, and (d) empty TCE of 0-1 V, respectively. ... 94 Figure 6.5 CV profiles for sample GC in potential window of 0-1 V at scan rates
of 5, 10, 20, and 50 mVs−1, respectively ... 97 Figure 6.6 CRC cruves at ±1Ag-1 in potential window of 0-1 V for sample GA,
GB, GC, and GD, respectively. ... 98 Figure 6.7 Variation of specific capacitance for sample GA(□), GB(●), GC(☆),
GD(╳), and BP2000 (▲) obtained from CRC measurements in potential window of 0-1 V at ±1Ag−1 for 3000 cycles ... 100 Figure 6.8 (a) Nyquist plots for sample GA, GB, and GC at the open circuit
voltage in frequency range of 0.1-20 kHz, as well as (b) the enlarged spectra at high frequency regime. (c) is the equivalent circuit model used to fit the impedance spectra ... 104
xviii
List of Symbols
I Current
V Potential
RCT Resistance from faradaic charge transfer reaction CPEp
Capacitance of constant phase element for faradaic charge transfer reaction
Rs
Ohmic resistance from electrolyte, carbon particles, and electrode
SBET BET surface area
SMicro Micropore surface area SExt External surface area Dp Average pore diameter VMicro Micropore volume VPore Total pore volume
CS The specific capacitance
Q Coulombs of discharge
W Sample weight
△E, CV potential window
ic Cathodic current density
v Scan rate
Rs Electrolyte resistance
T Time
Cd Capacitance
d𝐸
d𝑡 Slope for discharging curve
W Warburg impedance
CPEEDL
Capacitance of constant phase element for Electrochemical double layer
Z Impedance
Y0 Capacitance of associated element
J Imaginary unit
Ω Angular frequency of the AC signal
Α A dimensionless parameter for fitting purpose ,
1
Chapter 1 Introduction
1.1 Background
Shortage of oil supply amid insatiable demands from developing countries has engendered recent escalation of oil price and accompanying commodity inflation in the market. In addition, excess accumulations of CO2 in the atmosphere from irresponsible consumption of petroleum and coal in the past century inevitably results in rising ambient temperature, a fact known as “greenhouse effect”. Recently, R. K. Pachauri, chairman of the Intergovernmental Panel on Climate Change (IPCC) and A. A. Gore Jr. (the former U.S. Vice President) were awarded the Nobel Peace Prize on December 2007 at the Oslo City Hall due to the research of climatic change and counteraction of the global warming. Hence, the development of renewable energy has attracted considerable interests in exploring sustainable energy sources as well as green and possibly carbon-free [1].
Energy crisis is one of the most critical issues and everyone try to find the alternatives of clean energy. The renewable energy comes from natural resources including sunlight, wind, tides, rain, and geothermal heat. During past decade, worldwide renewable energy has attracted a great deal of attention on the technologies such as wind power, hydropower, solar energy, biomass, biofuel, and geothermal energy. For this purpose, numerous investigations have focused on the preparation of advanced materials followed by improving energy conversion efficiency as well as low polluting systems to be utilized in the future.
2
1.2 Motivations
Among many technologies proposed, solar cells, wind power, and fuel cells are recognized as the key technologies that enable a fossil-independent scenario [2-4]. Solar cells are photovoltaic devices in which photon energy from sun light is converted directly into electricity. Development of solar cells dates back to 1970s with the aim to provide electricity for space mission. Present solar cells employ Si-based designs which are robust and can sustain extended usages. However, their photovoltaic efficiencies are rather limited at ~ 43.5 % [5]. Wind energy is friendly to the surrounding environment, as no fossil fuels are burnt to generate electricity from wind energy. However, the wind power is uncontrollable and it varies from zero to storm force. Therefore, wind turbines do not produce the same amount of electricity all the time. Furthermore, it should be built in the countryside due to the noisy of the wind turbines.
Fuel cells, on the other hand, the mechanism run on direct chemical energy conversion to produce electricity through chemical reaction. The operation efficiency for a fuel cell can be as high as ~ 70 %. The source of fuel cell is hydrogen and the hydrogen is reduced at the anode followed by positivity charged ion travel through the electrolyte to the cathode Meanwhile, the oxygen reduction reaction occurs at the cathode and the final product is clear water. There are many type of fuel cell such as proton exchange membrane fuel cell (PEMFC), direct methanol fuel cell (DMFC), solid state fuel cell (SOFC), Molten carbon fuel cell (MCFC), phosphoric acid (PAFC), and alkaline fuel cell (AFC). In AFC system, the non-platinum catalyst can be use due to the alkaline electrolyte. Hence, first of all, this work focuses on alkaline
3
fuel cell technology.
In chapter 4, we employed an amorphous citrate precursor (ACP) method to synthesize the perovskite of La0.6Ca0.4Co0.8Ru0.2O3 and evaluated its catalytic abilities for the ORR in an alkaline electrolyte. Material characterization, H2O2 decomposition, and electrochemical analysis were carried out to determine relevant properties. Furthermore, we synthesized the perovskite of La0.6Ca0.4Co1-xRuxO3 (x=0, 0.2, 0.4, 0.6, 0.8, and 1) by a solid-state reaction (SSR) method and determined La0.6Ca0.4Co0.4Ru0.6O3 to possess superior bi-functional catalytic activity for the oxygen reduction and evolution. In this chapter 5, we reported the synthesis of La0.6Ca0.4CoIr0.25O3.5-δ and La0.6Ca0.4Co0.8Ir0.2O3, as well as the evaluation on their performances as bi-functional electrocatalysts in alkaline electrolyte using carbon nanocapsules (CNCs) as the catalyst support. In addition, electrochemical characterizations were carried out on La0.6Ca0.4CoO3 serving as the reference.
On the other hand, how to storage energy for renewable system is an interesting issue. For energy storage, the supercapacitor is one of the most promising systems due to their numerous features such as high power, high energy density, and long cycle life time [6,7]. It is well know that desirable EDLCs require large surface areas with appropriate pore sizes for facile access of ions from the electrolyte during capacitive charging and discharging. This can be realized by fabricating suitable carbon skeletons followed by a deliberate activation step to remove atomic carbon selectively. In the chapter 6, we explore the preparation of RF-derived ambient gels in conjunction with CO2 treatment for surface activation so an excessive surface area and suitable pore size can be obtained. The resulting materials are subjected to electrochemical measurements using a titanium cavity electrode (TCE) to determine
4
5
Chapter 2 Literature Review
2.1 Alkaline fuel cells
Alkaline fuel cells are regarded as desirable clean energy alternatives to traditional fuels, and they may serve as solutions to ameliorate worsening greenhouse effect [8,9]. The alkaline fuel cell is the first successfully developed fuel cells, whose use date back to 1960s in Apollo space shuttle. The structure of an alkaline fuel cell is shown in Fig. 2.1 [10]. The electrolytes used are alkaline solutions such as KOH or NaOH. Pure hydrogen as the fuel oxidizes at the anode, while air or pure oxygen as the oxidant reduces at the cathode. The fuel cell operates through a redox reaction between hydrogen and oxygen following the equations:
Anode:H2+2OH- →2H2O+O2 Eo= -0.83 V (2-1) Cathode:1/2O2+H2O+2e- →2OH- Eo= 0.40 V (2-2) Overall :1/2O2+H2 → H2O Eo= -1.23 V (2-3) The energy conversion efficiency of alkaline fuel cell is high, up to 70%, which is mainly because the oxygen reduction reaction rate is faster in the alkaline electrolyte than that in acidic electrolyte. Besides, the alkaline fuel has another advantage that non-platinum-group catalysts can be used in the system. However, the air is widely used as the oxidant in alkaline fuel cells, but aqueous alkaline solutions do not reject CO2. The fuel cells could become “poisoned” through the conversion of KOH to K2CO3, resulting in reduced lifetime and efficiency. There are several ways
6
to conquer CO2 poisoning problems such as adding filters before inputting air to the electrode, applying the electrochemical methods to eliminate CO2, cycle purification electrolyte, and using pure oxygen as the oxidant.
Figure 2.1 The structure of an alkaline fuel cell [10].
2.2 Perovskite structure
The perovskite structure is a compound with an ABO3 formula as shown in Fig. 2.2 [11]. In the structure, the oxygen ion and cation A form a close packed structure, while the cation B with a smaller size occupies the body-center position. Perovskites have many derivatives by substituting different atoms into A and B sites. For example, the A site can be alkaline earth metals such as La, Ca, and Sr. On the other hand, at the
7
B site transition metals such as Mn, Co, Ir, and Cu can be used. Therefore, Ca and Sr can be incorporated into perovskite occupying the A site forming La1-xCaxCoO3 and La1-xSrxCoO3 perovskite structures.
Figure 2.2 The structure of perovskite with a chemical formula ABO3 [11].
Nowadays, the Ca doped LaCoO3 perovskite has been exploited as the electrocatalyst in many researches. The La0.6Ca0.4CoO3 has also been exhibited as a bi-functional electrocatalyst with good performances. A wide variety of transition metal ions have been explored for partial replacements at the Co3+ sites to improve the oxygen reduction reaction (ORR) kinetics [12,13]. Recently, we synthesized the La0.6Ca0.4CoIr0.25O3.5-δ and La0.6Ca0.4Co0.8Ir0.2O3, which demonstrate improved performances for both the ORR and oxygen evolution reaction over those of La0.6Ca0.4CoO3 [14,15]. We realize that the successful incorporation of Ir4+ at the Co3+
8
sites is responsible for the catalytic enhancements. Because metallic Ru is known as an ORR electrocatalyst, a similar strategy can be employed to introduce Ru3+ at the Co3+ sites for possible catalytic reactions [16,17]. The perovskite lattice is expected to provide a stable platform for hosting Ru3+. As a result, a reduced amount of Ru is used as opposed to the metallic form.
2.3 Oxygen reduction reaction
ORR is a critical step in fuel cell electrochemistry because a significant overpotential is often required to activate the relatively stable oxygen molecules [18]. Conventional fuel cells involve an acidic electrolyte, noble metals and alloys such as Pt and Pt3Ni are selected for their chemical inertness [19,20]. However, to reduce the system cost it is necessary to adopt less-expensive materials with comparable performances [21,22]. The ORR in an alkaline electrolyte reveals less polarization loss, leading to a fuel cell with better efficiency [23]. In an alkaline solution, the ORR occurs via direct four-electron pathway or two electron peroxide route listed below [24];
O2+ 2H2O + 4e- 4OH- Eo = 0.401V (2-4) O2 + H2O + 2e- HO2- + OH- Eo = -0.065V (2-5) HO2- + H2O + 2e- 3OH- Eo = 0.867V (2-6) 2HO2- 2 OH- + O2 (2-7) The straightforward route is known as the four-electron pathway in which the
9
oxygen molecule reacts with water and four electrons in a single step to form hydroxyl ions directly (2-4). An alternative one is the peroxide pathway where the oxygen molecule accepts two electrons and water in the first step to convert to peroxide ions (2-5). Subsequently, the peroxide ions react with two more electrons and water leading to the formation of hydroxyl ions (2-6), or decomposition to form hydroxyl ion and oxygen (2-7). In addition, the electrocatalysts that reduce oxygen through the four electron pathway are preferred because less electrode polarization is expected. Many materials have been investigated as an electrocatalyst to enhance the ORR. They include metals (Pt, Ag) [25-30], metal oxides (RuO2, MnO2, CoO) [31-33], perovskites (LaCoO3, La0.6Ca0.4CoO3) [34-38], spinels (NixAl1-xMn2O4, Ni2Co2O4, Mn3xCo3-3xO4) [39-41], as well as pyrolyzed N-4 chelate compounds (CoTMPP) [42]. A thorough review was provided recently by Wang, discussing available non-platinum electrocatalysts [43]. Because perovskite is established as the two-electron catalyst, the decomposition of H2O2 can be selected as a litmus test for quick catalytic evaluations [44]. For example, Jiang et al. studied the ORR ability for cobalt oxide/graphite air electrodes by determining their homogeneous and heterogeneous rate constants for the H2O2 decomposition [45]. Because the transition metal ions are the active species for the ORR, Falcón et al. adopted a similar technique to correlate the oxidation states of Ni and Fe in LaFexNi1-xO3+δ [46]. Thus, the novel perovskites were chosen in this research work in alkaline fuel cells.
2.4 Bi-functional electrocacatlysts
Oxygen reduction and evolution are critical electrochemical reactions in many industrial applications [47,48]. For example, in solid oxide fuel cells cathode oxygen
10
reduction is the most energy-consuming step and responsible for the largest polarization loss [49]. Likewise, oxygen evolution poses serious challenges in chlor-alkali productions and water electrolysis cells [48,50]. To accelerate electrochemical reactions, electrocatalysts are used and they are typically designed and synthesized for single purpose only. However, in particular systems such as rechargeable metal-air, air-metal hydride, and regenerative fuel cell, bi-functional electrocatalysts are required [51-53]. An excellent review was provided recently by Jörissen detailing materials selection and construction principle of bi-functional oxygen-air electrodes [54]. Conventional fabrication methods for bi-functional gas diffusion electrodes (GDE) entail lamination of current collector, carbonaceous materials impregnated with suitable electrocatalysts, and polytetrafluorethylene (PTFE) resin.
Oxides including perovskites (ABO3), spinels (AB2O4), and pyrochlores (A2B2O7) have been investigated extensively for their bi-functional catalytic abilities in alkaline electrolyte [55,56]. Among them, the perovskites have received considerable attention because of reasonable electrical conductivity and corrosion resistance. Previously, Bockris and Otagawa had conducted comprehensive analysis on electrocatalysis in perovskites [38]. Among the plausible candidate materials, the lanthanum cobaltate (LaCoO3) was documented widely in literatures for its simple synthesis and incorporation of various dopants in a wide variety of compositions [57-60]. Tiwari et al. suggested that B site cation (i.e., Co3+) in LaCoO3 directly contributes to the catalytic performances [61]. As a result, many efforts including introduction of additional cations, as well as controlling the degree of oxygen vacancies were engaged to manipulate oxidation states of Co. To date, La0.6Ca0.4CoO3
11
has demonstrated impressive characteristics and thus can be found in many cell samples [62,63].
Iridium oxide (IrO2) is used as the dimensionally stable anode in chlor alkali cells [55]. It processes the rutile structure where the Ir4+ is coordinated by six neighboring oxygen atoms forming an octahedron. Surprisingly, the IrO2 exhibits excellent electrical conductivity and corrosion resistance, that are desirable for many catalytic reactions. For example, De Pauli and Trasatti prepared mixed oxides of IrO2 and SnO2 and reported impressive behaviors of oxygen evolution in acid electrolyte [64]. Unfortunately, implementation of IrO2 for oxygen evolution in alkaline electrolyte is less studied due to the concerns on possible dissolution [65]. Because of similar octahedral coordination of Ir4+ in IrO2 and Co3+ in LaCoO3, it would be interesting to explore possible replacements of Ir4+ at Co3+ sites in perovskite matrix. In this way, we expect the perovskite structure provides the necessary chemical stability in alkaline electrolyte while the Ir4+ contributes to the oxygen evolution.
2.5 Gas diffusion electrodes and electrocatalyst support
materials
A gas diffusion electrodes (GDE) is required for fuel cells and metal air batteries. The GDE is a porous platform incorporating current collector, hydrophobic polytetrafluoroethylene (PTFE) resin and carbonaceous material impregnated with catalytic nanoparticles [66,67]. The porosity, pore structure, and hydrophobicity of the GDE must be carefully designed to allow an extensive reaction interface between the gaseous oxygen and liquid electrolyte in the vicinity of the electrocatalyst. To date, it
12
is recognized that the GDE is the crucial component enabling successful implementation of fuel cells.
Many carbonaceous materials have been investigated as possible electrocatalyst supports [68-70]. They range from conventional carbon powders such as Vulcan XC72, Black Pearls, Shawiningan Blacks and active carbons, to less familiar ones including glassy carbons, carbon fibers and hard carbon spherules [71-73]. A detailed discussion was recently provided by Dicks [74]. With recent progress in the synthesis of nanostructured materials, exotic forms of carbon such as carbon nanotubes (CNTs) and carbon nanocapsules (CNCs) have been reported [75,76]. The CNTs exhibit extraordinary physical properties such as mechanical strength, excellent electronic and thermal conductivity, as well as chemical stability and high surface area. These are desirable physical properties for electrocatalyst supports. Hence, the CNTs’ applicability as an electrocatalyst support has received much attention recently. For example, Kongkanand et al. observed significant enhancements in the electrocatalytic activities of single-walled CNTs decorated with Pt nanoparticles [77]. A similar result was reported by Che et al. and they attributed the enhanced capabilities to the accessible inner surface of CNTs [78]. In addition, the strategy of hybrid carbonaceous materials has been explored. Huang et al. mixed active carbons with the CNTs and observed substantial improvements in electrocatalytic performance once Pt was loaded [79].
2.6 Supercapacitors
13
possess the advantages in power output, energy density, and cycle life compared with conventional rechargeable batteries, for the applications in electric vehicles, power tools and uninterrupted power systems [80-91]. From the standpoint of operation mechanism, there are two types of supercapacitors; EDLCs and pseudocapacitors. The EDLCs store charges via ions adsorption/desorption at the interface between the electrode and electrolyte [84-88, 92,93]. In contrast, the pseudocapacitors entail facile faradaic reactions occurring on the electrode material to store charges in different oxidation states such as hydrous RuO2, V2O5, NiO, and MnO2 [94-106]. For example the hydrous RuO2 exhibits the best performance resulting from its distinctive characteristics of highly reversible and fast faradaic reaction mechanism, high specific capacitance, and very good conductivity.
Among them, the pseudocapacitors are able to deliver larger capacitances but with cost premium and relatively short cycle life. Therefore, there have been considerable interests in exploring alternative electrode materials. Carbonaceous materials are the electrode materials used in the majority of commercially available EDLCs, possessing the advantages of low cost and long cycle life. Besides, specific capacitor of EDLC can be increased by using organic electrolytes [107-109]. Since the charge/discharge reaction on the electrode surface provides a shorter ions moving path without chemical reaction, the EDLC exhibits a low internal resistance through interactive-free electrodes. As a result, EDLC conducts non-faradaic process, which is completely reversible under a higher power density. Besides, material properties including surface area, pore sizes, pore size distribution, surface functional group and electrolyte window can be controlled to improve EDLC [110,111]. For the EDLCs, the capacitive responses are proportional to the effective surface area available for
14
ions adsorption/desorption so an excessive surface area with a desirable porosity for the electrode material is necessary. To date, considerable efforts have devoted to the carbon-based materials since their rich varieties exhibit a wide range of pore sizes, surface areas, electric conductivities, and surface properties. In literature, carbonaceous materials including active carbons, carbon blacks, glassy carbons, and nanostructured carbons (carbon nanotubes, nanocapsules, nanofibers, gels) have been investigated [112-119]. Among them, the carbon xerogels and aerogels possess unique properties of extremely low density and high porosity [120,121].
2.7 Resorcinol-formaldehyde carbon gels
The carbon xerogels and aerogels are synthesized via a sol-gel process in which precursors in liquid states are properly mixed, and condense to form continuous colloidal networks, followed by solvent removal and pyrolysis to obtain a porous carbon structure with interconnected channels. One of the sol-gel approaches that has been studied extensively is the polycondensation of resorcinol ® and formaldehyde (F) [120-122]. According to Elkhatat and Al-Muhtaseb [123], the concentrations of the precursors, catalysts, solvents, and pH value play important roles in determining the resulted morphologies and porosities of the gel structures. In addition, the solvent removal step for the wet gels is critical because the drag of surface tension induces contraction of the colloidal networks resulting in substantial reduction in the pore size. So far, many R-F derived porous carbons have been prepared and evaluated for possible applications in EDLCs, catalysis (as a catalyst support), filtration, gas separation, and adsorption [121, 123,124].
15
Previously, many RF-derived xerogels and aerogels have been synthesized and evaluated for capacitive behaviors [125,126]. The preparation of xerogels involves direct solvent evaporation that engenders notable structural contraction and possible collapse at the extreme case. As a result, after pyrolysis the carbon xerogels typically contain 25% porosity with reveal a moderate surface area (150-900 m2g-1) and small pores (1-10 nm) [127]. In contrast, the carbon aerogels experience a supercritical drying step that sublimates the solvents with negligible shrinkage of carbon networks. After pyrolysis, the carbon aerogels demonstrate a substantially larger surface area and pore volume, and consequently, a larger capacitance [127-129]. Despite of those merits, the carbon aerogels are of little commercial interest because the supercritical drying is energy-consuming and improper for production in large quantity. On the other hand, the carbon xerogels suffer from unnecessary structure alteration and hence, their pore size and pore volume are not adequate for EDLC applications. An alternative preparation route to minimize structure contraction during sol-gel transformation is via repeated solvent exchanges that reduce the surface tension of the solvent sequentially in the wet gels [126]. In this way, the solvent with reduced surface tension is able to evaporate slowly rendering a dried gel known as “ambient gel” whose structure is closely resemble to that of aerogel. This enables a large number of mesopores and macropores in the carbon skeleton. This ambient gel could be of potential interest because its desirable surface area and porosity, as well as the simple drying process.
16
Chapter 3 Experimental
3.1 Materials
Materials
Source
Purity
1. La(NO3)3・6H2O Alfa aesar 99.9 % 2. Ca(NO3)2・4H2O Showa 98 % 3. Co(NO3)3・6H2O Riedel-deHaen 99 % 4. RuCl3・nH2O Sigma-aldrich 99.99 %
5. RuO2 Alfa aesar 99.95%
6. IrCl3・nH2O Sigma-aldrich 99.98%
7. IrO2 Alfa aesar 99.99 %
8. Citric acid Sigma-aldrich 99.5 %
9. KOH Showa 85 %
10. H2O2 Riedel-deHaen 35 %
11. Vulcan XC-72 Cabot -
12 Black pearl 2000 Taipower - 13. Polytetrafluoroethylene (T-30) Dupont 60 % 14. Polyvinyl alcohol (Mw=2,000–12,000) Sigma-aldrich 99+ % 15. Gas diffusion electrode eVionyx Lic.
16. Zn rod 奇峰五金行 99.99 %
17
18. Formaldehyde J. B. Baker 37 % 19. Acetic acid Sigma-aldrich 99.7 % 20. Acetone Sigma-aldrich 99.9 % 21. Cyclohexane Sigma-aldrich 99.5 %
22 AC1100 Taipower
3.2 Experimental flowchart
3.2.1 Flowchart for preparation of perovskite catalysts
ACP method
(1) La(NO3)3.6H2O
(2) Ca(NO3)2.4H2O
(3)Co(NO3)2.6H2O
(4) RuCl3 (or IrCl3)
Drying to form gel
Sinter
Add Citric Acid
SSR method (1) La(NO3)3.6H2O (2) Ca(NO3)2.4H2O (3)Co(NO3)2.6H2O (4) RuO2 Sinter Mechanical alloying (1)LaCaCoO3 (2) IrO2 Ball mill Perovskite
18
3.2.2 Flowchart for preparation of carbon ambient gels
3.3 Synthesis of ACP-derived La
0.6Ca
0.4Co
0.8Ru
0.2O
3and
La
0.6Ca
0.4Co
0.8Ir
0.2O
3The ACP method was adopted to prepare stoichiometric La0.6Ca0.4Co0.8Ru0.2O3 (or La0.6Ca0.4Co0.8Ir0.2O3) perovskite in which La(NO3)3・6H2O, Ca(NO3)2・4H2O, Co(NO3)3・6H2O, and RuCl3・nH2O (or IrCl3·xH2O) were dissolved at a proper ratio in excess deionized water with citric acid. The molar ratio for the citric acid to the metal ions was 1:1. The mixture underwent moderate heating and stirring at 80˚C for 6 h to form a viscous gel, followed by oven drying for 24 h. Subsequently the dry gel was
(1) Resorcinol (2) Formaldehyde (3)Deionized water
Drying to form gel
Heat treatment
Add acetic acid
Solvent exchange
19
ignited in air to burn off polymeric precursors, forming a dark aggregate. Afterward, the sample was subjected to a heat treatment in air at 650˚C for 4 h to form fine powders designated as ACP-derived La0.6Ca0.4Co0.8Ru0.2O3 and ACP-derived La0.6Ca0.4Co0.8Ir0.2O3.
3.4 Synthesis of SSR-derived La
0.6Ca
0.4Co
xRu
1-xO
3Perovskite-type oxides La0.6Ca0.4Co1-xRuxO3 (x=0, 0.2, 0.4, 0.6, 0.8, and 1) were synthesized by SSR method. La(NO3)3・6H2O, Ca(NO3)2・4H2O, Co(NO3)3・6H2O, as well as RuO2 were thoroughly mixed by a mortar and pestle followed by a two-stage sintering process including 600˚C in the air for 4 h and 800˚C in air for 4 h, respectively.
3.5 Synthesis of La
0.6Ca
0.4CoIr
0.25O
3.5-δThe La0.6Ca0.4CoIr0.25O3.5-δ perovskite powders were prepared by mechanical alloying of IrO2 (99.99% Alfa Aesar) and La0.6Ca0.4CoO3 at a molar ratio of 1:4. The La0.6Ca0.4CoO3 was synthesized by ACP method where proper ratios of La(NO3)3, Ca(NO3)2, and Co(NO3)2 were dissolved in water and citrate acid first, and followed by initial drying to form a gel. A sintering process was carried out at 650°C in air for 4 h to obtain particles with desirable composition of La0.6Ca0.4CoO3. Mechanical alloying of IrO2 and La0.6Ca0.4CoO3 was conducted with a planetary high energy ball mill in air atmosphere containing ZrO2 balls for 12 h. Each batch included 1.6 g La0.6Ca0.4CoO3 and 0.4 g IrO2.
20
3.6 Fabrication of gas diffusion electrodes
The gas diffusion electrode (GDE) catalytic layer was fabricated by mixing 30 wt % perovskite catalysts, 30 wt % poly(tetrafluoroethylene) (Dupont T-30), 10 wt % poly(vinyl alcohol) (Mw=2,000–12,000), and 30 wt % carbonaceous materials (Vulcan XC72R (VXC72R), carbon nanocapsules (CNCs), and black pearl 2000 (BP2000)) in 10 mL deionized water at 104 rpm for 5 min to render a homogeneous slurry. Subsequently, the slurry was brush-painted repeatedly onto a commercially available GDE (eVionyx, Inc.) to reach a catalyst loading of 2.4 and 4.8 mgcm-2. Next, the catalyzed GDE was heated at 350˚C for 30 min to remove residual solvents. Afterward, the sample was rolled and pressed into a thickness of 300 μm.
3.7 Synthesis of carbon ambient gels
The carbon ambient gel was prepared by a condensation reaction between R and F, followed by solvent exchange and CO2 activation to render an excessive surface area. First, R and F (37 wt%) were mixed in a 1:2 molar ratio in deionized water under ultrasonication for 10 min at 26˚C. After complete dissolution of resorcinol, acetic acid was added as a catalyst to promote the condensation reaction forming colloids in the mixture. Subsequently, the mixture was sealed in a container at 70˚C for 72 h with constant vibration to allow the transformation from a sol suspension to a wet gel. After gelation, the sample was removed from the oven and washed for 72 h in which 50% of acetone was drained and replaced with fresh acetone every 24 h. Next, the process was repeated again for another 72 h with cyclohexane. These solvent
21
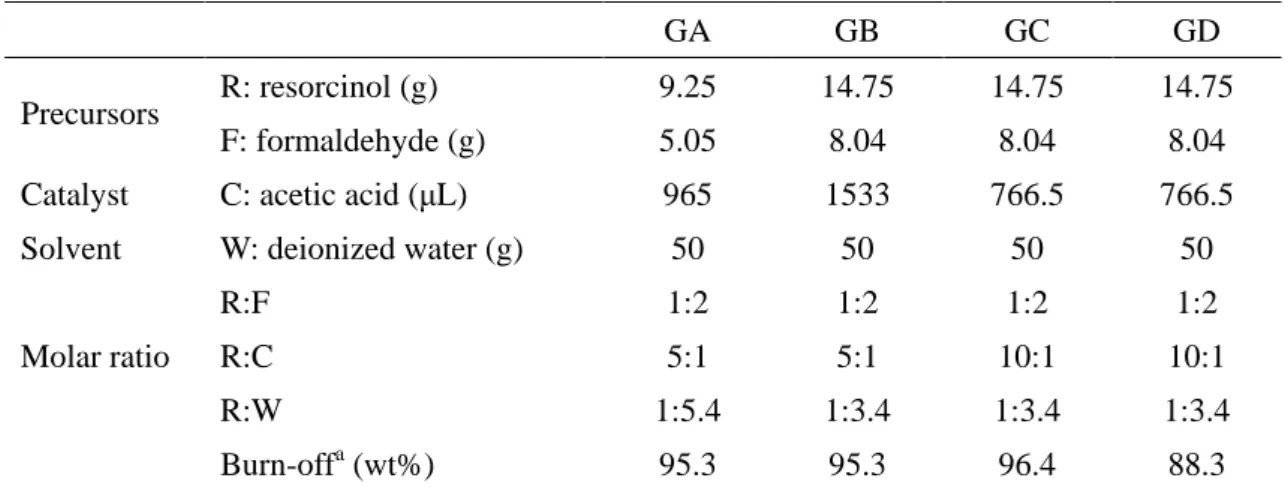
exchange steps were conducted at 26˚C so the surface tension for the liquid phase was reduced sequentially to minimize structural contraction for the solid phase upon solvent evaporation. Afterward, the sample was dried at 26 °C for 24 h to evaporate remaining cyclohexane, leaving a free-standing dark orange ambient gel. Finally, the ambient gel was placed in a tube furnace for two-stage heat treatments. The first stage was performed in Ar atmosphere at 950 °C for 1 h to decompose organic residues (pyrolysis reaction) where the dark orange ambient gel shrunk significantly to become the black porous carbon. In the second stage, at 950˚C the CO2 was purged and 99.99% CO2 was introduced for 3 h to activate the surface of the porous carbon. By adjusting precursor and catalyst concentration, we were able to prepare ambient gels with various porosities and surface areas. The resulting samples were designated as GA, GB, and GC, respectively. The exact amounts for the precursors, catalyst, deionized water, as well as ratios for the R/C and R/W are listed in Table 3.1. In order to distinguish the effect of CO2 activation, we also carried out identical sample preparation steps except the CO2 activation was replaced with Ar treatment for another 3 h (labeled as GD as a reference sample).
22
Table 3.1 Precursors and catalyst used for the synthesis of carbon ambient gels.
GA GB GC GD
Precursors R: resorcinol (g) 9.25 14.75 14.75 14.75 F: formaldehyde (g) 5.05 8.04 8.04 8.04 Catalyst C: acetic acid (μL) 965 1533 766.5 766.5 Solvent W: deionized water (g) 50 50 50 50
Molar ratio R:F 1:2 1:2 1:2 1:2 R:C 5:1 5:1 10:1 10:1 R:W 1:5.4 1:3.4 1:3.4 1:3.4 Burn-offa (wt%) 95.3 95.3 96.4 88.3 a
total weight loss of carbon ambient gels after 950 °C pyrolysis and CO2 activation.
3.8 Material characterization
3.8.1 X-ray diffraction (XRD)
A Siemens D5000 X-ray diffractometer with the wavelength of Cu-Kα radiation of 0.154 nm was used to identify relevant phase and crystallinity of the synthesized powders.
3.8.2 Scanning electron microscope (SEM)
Their morphologies were observed by a scanning electron microscope (SEM, JEOL JSM-6700F and JSM-6500F).
23
3.8.3 Brunauer, Emmett, and Teller (BET)
The surface area was obtained by Brunauer, Emmett, and Teller (BET) method by Micromeritics Tristar 3000, Micromeritics ASAP2020 and Quantachrome NOVA-1000A. A density function theory (DFT) program was employed to estimate relevant parameters in pore size and pore distribution.
3.8.4 Pycnometers measurement
The values for density was obtained by using AccuPyc 1340 (Micromeritics).
3.8.5 zeta potential
The zeta potential results were obtained by a NICOMO 380ZLS.
3.8.6 Raman spectroscopy
Raman spectroscopy (Raman spectrometer LabRAM HR800) was performed on the sample to examine their crystallinity.
3.8.7 H
2O
2decomposition measurement
A H2O2 decomposition measurement was employed to evaluate the catalytic ability for the ORR. Small amounts of La0.6Ca0.4Co0.8Ru0.2O3 powders (0.01, 0.015, 0.02, 0.025, and 0.03 g) were suspended in 30 mL of 13 wt % KOH aqueous solution for 10 min at 25˚C, followed by injection of 1.15 M H2O2 solution of 2 mL. The amount of O2 released was carefully collected as a function of time.
24
3.9 Electrochemical measurements
3.9.1 Gas diffusion electrode (GDE)
Electrochemical analysis was conducted with a Solartron SI1287 potentiostat for oxygen reduction and evolution in I-V polarizations, galvanostatic measurements, and life time determination. The GDE (3 cm2), serving as the working electrode, was exposed to ambient air on the back side. A Ti mesh coated with RuO2/IrO2 was used as the counter electrode, and a Zn rod (99.99 wt%) (or Ag/AgCl) was selected as the reference electrode. The Zn rod was chosen because its reading indicated the operating voltage of a zinc-air cell. A 7 M KOH aqueous solution was used as the electrolyte. The I-V polarization curves were measured at 1 mAs-1. Impedance analysis was carried out using a Solartron SI1255B with a 10 mV stimulus for the frequency range of 0.1-20 kHz at the open-circuit voltage, and overpotentials of −100, −200 and −300 mV. The recorded spectra were fitted by the ZView software to determine their respective charge transfer resistances and relevant kinetic parameters. Galvanostatic profiles were obtained for current densities of 10, 50, 100, and 200 mAcm-2. Two kinds of life time test. First, the GDE was subjected to 10 mAcm-2 and the resulting voltage was recorded. On the other hand, the GDEs experienced repeating sequences of oxygen reduction (0.5 h), resting (1 h), oxygen evolution (0.5 h), and resting (1 h) at 25mAcm−2 with a constant inflow of CO2-filtered air. Identical procedures were conducted on the ACP-derived La0.6Ca0.4CoO3 for comparison purpose. In addition, the electrochemical measurements were carried out on the La0.6Ca0.4CoO3 and IrO2 serving as the reference. The La0.6Ca0.4CoO3 was synthesized from the amorphous citrate precursor method (ACP) and its synthetic details were
25
reported elsewhere [37]. All the electrochemical experiments were performed at 25˚C .
3.9.2 Titanium Cavity Electrode (TCE)
For electrochemical analysis to determine the double layer capacitance, a three-electrode cell was used in which a J-shape TCE, with 2 mm in diameter and 200 mm in length, was adopted as the working electrode. The bottom of the TCE contained a cylindrical cavity with 1 mm in diameter and 1 mm in depth for sample loading. The sample was placed on a glass sheet and pressed compactly to fill the bottom cavity. The exact weight was measured by a microbalance with an accuracy of 2-3 μg. Details on the TCE and its testing results on commercially available carbon blacks have been reported earlier [109]. Pt foil (2×5 cm2) and Ag/AgCl were used as the counter and reference electrodes, respectively. Values for the double layer capacitance were determined via CV measurement and current reversal chronopotentiometry (CRC) in 0.5 M H2SO4 aqueous solution at 26 °C using a Solartron SI1287 potentiostat and 1255B frequency response analyzer. The CV profiles were recorded at scan rates of 5, 10, 20, and 50 mVs-1, in potential windows of 0-0.6, 0-0.8, and 0-1 V, respectively. The CRC measurements were carried out at ± 1 Ag-1 in a potential window of 0-1 V. In life time test, the sample was subjected to repeated CRC scans at ±1 Ag-1 in a potential window of 0-1 V. Impedance spectra were obtained at the open circuit voltage with a sinusoidal signal of 10 mV at frequencies between 0.1 and 20 kHz. The resulting spectra were fitted by a ZView software to retrieve relevant electrochemical parameters.
26
Chapter 4 Synthesis and Characterization of
La
0.6Ca
0.4Co
xRu
1-xO
3for Bi-functional
Electrodes
4.1 Physico-chemical characterizations
4.1.1 ACP-derived La
0.6Ca
0.4Co
0.8Ru
0.2O
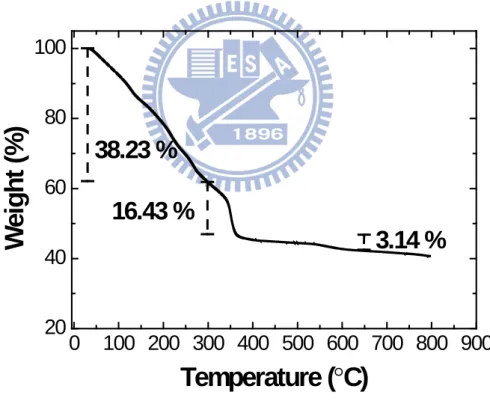
3Successful formation of polycrystalline perovskite phase from the ACP approach is known to depend on a variety of factors including the source of salts and their molar ratios, the type of chelating acids, pH value of precursor, as well as the sintering temperature, time, and atmosphere. In general, a higher sintering temperature is always preferred for an impurity-free perovskite phase, albeit with a significantly reduced surface area. However, in this work we attempt to synthesize perovskite La0.6Ca0.4Co0.8Ru0.2O3 powders for ORR catalytic actions. Subsequently, the as-synthesized powders are impregnated onto the carbonaceous supports for electrochemical evaluations. Hence, a reasonable surface area for La0.6Ca0.4Co0.8Ru0.2O3 powder is necessary. According to previous studies, in similar ACP routes, the perovskite phase can be formed at temperatures as low as 550-650˚C [13,61,130-134]. We select a sintering process of 650˚C for 4 h in air, hoping to reach a balance between crystallinity and surface area. To further confirm the sintering temperature of 650˚C is appropriate, we conduct a thermogravimetric analyzer (TGA) on the polymeric precursors of La0.6Ca0.4Co0.8Ru0.2O3 and its result is provided in Fig. 4.1. Apparently, there are three distinct regimes of weight loss for temperature range
27
of 25-800˚C, which is typical for the ACP process. In the first regime of 25-300˚C, the rapid weight loss is associated with the preliminary breakdown of organic components and solvent evaporation. In the second regime of 300-400˚C, the notable weight loss is attributed to the decomposition of organic components and initial formation of oxide phase. In the last regime of 400-650˚C, there appears a gradual weight loss as the perovskite phase is formed with improving crystallinity. Notably, there appears a negligible weight loss after 650˚C. This sintering temperature is confirmed by a TGA conducted on the polymeric precursors of La0.6Ca0.4Co0.8Ru0.2O3.
0
100 200 300 400 500 600 700 800 900
20
40
60
80
100
3.14 %
16.43 %
W
e
ight
(
%
)
Temperature (
°C)
38.23 %
Figure 4.1 A representative TGA profile for the polymeric precursor of La0.6Ca0.4Co0.8Ru0.2O3.
28
La0.6Ca0.4CoO3 along with the standard diffraction pattern for La0.6Ca0.4CoO3 (JCPDS no. 35.1389) as a reference. As shown in Fig. 4.2(a), La0.6Ca0.4Co0.8Ru0.2O3 revealed a crystalline perovskite phase (ABO3) with relevant diffraction peaks attributed to those of standard La0.6Ca0.4CoO3. However, there were two minor peaks at 2θ=30.74° and 36.86°, which were identified as La2O3 (JCPDS no. 74-1144) and Co3O4 (JCPDS no. 78-1969), respectively. From the XRD result of Fig. 4.2(b), a minor phase of Co3O4 was also identified in addition to the crystalline La0.6Ca0.4CoO3 phase. We did not observe any diffraction peak from RuO2, suggesting that the incorporation of Ru3+ at the Co3+ sites was achieved successfully. Because Ru3+ (0.82 Å) was relatively larger in size to Co3+ (0.69 Å), the introduction of Ru3+ into the perovskite lattice was expected to engender a moderate expansion in lattice parameters, resulting in a slight shift of diffraction peaks to smaller angle side. Indeed, the (024) peak for standard La0.6Ca0.4CoO3 was shifted from 47.56° to 47.02° once La0.6Ca0.4Co0.8Ru0.2O3 was formed.
To address the concern over the incomplete synthesis of the La0.6Ca0.4Co0.8Ru0.2O3 perovskite, indeed, at 650˚C there was a presence of undesirable La2O3 and Co3O4, as evidenced by the XRD. However, their residual amount is rather small. In our earlier work of the ACP-derived La0.6Ca0.4Co0.8Ir0.2O3 perovskite, at an identical sintering of 650˚C for 4 h, we also observed a small amount of La2O3 and Co3O4 [15]. Hence, we realized that these undesirable oxides are inherent to the ACP process.
29
(a)
(b)
(028)
(110)
(202)
In
te
n
s
it
y
(
a
rb
. u
n
ti
s
)
(104)
(024)
(214)
(220)
JCPDS-36-1389
La
2O
3Co
3O
430
40
50
60
70
(006)
2
θ
(degree)
Figure 4.2 XRD for the as-synthesized (a) La0.6Ca0.4Co0.8Ru0.2O3 and (b) La0.6Ca0.4CoO3. Also shown is the standard pattern of La0.6Ca0.4CoO3 from JCPDS 35.1389.
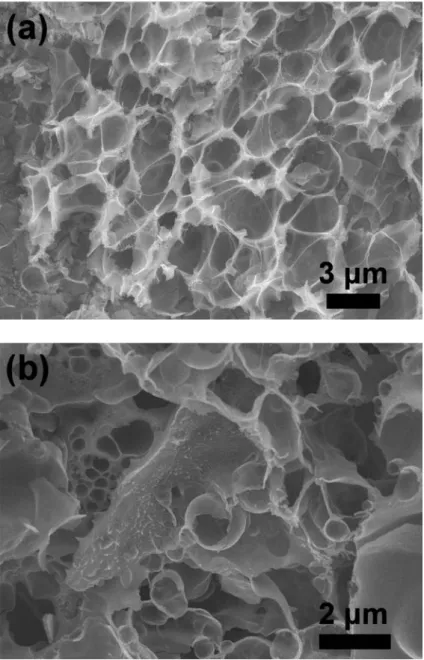
Fig. 4.3 provides the SEM images for the La0.6Ca0.4Co0.8Ru0.2O3 and La0.6Ca0.4CoO3 powders. As shown in Fig. 4.3(a), La0.6Ca0.4Co0.8Ru0.2O3 appeared in a foam-like microstructure with the presence of various micropores in 0.5-3 μm sizes. Unfortunately, individual primary particles were not distinguishable from the image. This foam-like microstructure was typical for the ACP-derived powders experiencing mild sintering treatments as sintering at higher temperatures produced larger particles with significant coalescence, which was not desirable for catalytic ability. The SEM image shown in Fig. 4.3(b) for the ACP-derived La0.6Ca0.4CoO3 also confirmed a porous microstructure with varied pore sizes. Its morphology was rather similar to that of La0.6Ca0.4Co0.8Ru0.2O3.
30
Figure 4.3 SEM images for the as-synthesized (a) La0.6Ca0.4Co0.8Ru0.2O3 and (b) La0.6Ca0.4CoO3.
The decomposition of dissolved H2O2 in an alkaline electrolyte can be used as the indicator for the ORR. This method is particularly suitable to perovskite, which is known as a two-electron catalyst. When the perovskite powders are suspended in the electrolyte, the decomposition of H2O2 proceeds as follows;
31
H2O2 → H2O +12O2 (4-1)
As time progresses, the concentration of H2O2 is decreased in conjunction with steady oxygen formation. Hence, by measuring the amount of oxygen evolved, we could determine the decomposition rate for H2O2. According to Falcón et al., decomposition of H2O2 in the perovskite is presumed to be a first-order reaction in which the reaction rate is proportional to the H2O2 concentration [46];
-d[H2O2]𝑡
𝑑𝑡 = 𝑘[H2O2]𝑡 (4-2) where [H2O2]t is the H2O2 concentration at time t and k is the first-order rate constant. Therefore, after integration on both sides, we could obtain
−d[H2O2]𝑡
[H2O2]𝑡 = 𝑘𝑑𝑡 (4-3)
This would lead to a straight line with the k as the slope if we plot the relation of ln([H2O2]0/[H2O2]t) as a function of t. [H2O2]t can be obtained via the following relation;
[H2O2]t = [H2O2]0− 2 ×PRTVO2VsolO2 (4-4)
where [H2O2]0 is the initial concentration of H2O2 when the decomposition begins, [H2O2]t is the remaining H2O2 concentration at time t, Po2 is 1 atm, T is 298 K,
Vo2 is the evolved O2 volume at time t, and Vsol is the total volume for the solution. Fig. 4.4 presents the plots of ln([H2O2]0/[H2O2]t) as a function of time for various amounts of La0.6Ca0.4Co0.8Ru0.2O3 and La0.6Ca0.4CoO3. As shown in Fig. 4.4(a), an increment in La0.6Ca0.4Co0.8Ru0.2O3 loading resulted in a faster decomposition of H2O2
32
which was typical in catalysis. Unexpectedly, the linearity was only observed for samples in the initial stage. In particular, once La0.6Ca0.4Co0.8Ru0.2O3 loading was sufficiently large, we recorded an accelerated H2O2 decomposition. This suggested that the first-order kinetic assumption was not fully applicable for La0.6Ca0.4Co0.8Ru0.2O3. A better linearity was witnessed for La0.6Ca0.4CoO3, as shown in Fig. 4.4(b). The decomposition rate for La0.6Ca0.4CoO3 was consistently lower than that of La0.6Ca0.4Co0.8Ru0.2O3 at identical weights as listed in Table 4.1, which infers a high ORR ability for the latter.
33
0
200
400
600
800
1000 1200
0
1
2
3
4
5
(a)
ln
([
H
2O
2]
0/[
H
2O
2]
t)
Time (s)
0
300
600
900
1200
0
1
2
3
(b)
ln
([H
2
O
2
] 0/
[H
2
O
2
] t )Time (s)
Figure 4.4 Plots of ln([H2O2]0/[H2O2]t) as a function of time for (a) La0.6Ca0.4Co0.8Ru0.2O3 and (b) La0.6Ca0.4CoO3at 0.01 (■), 0.015 (○), 0.02 (▲), 0.025 (×), and 0.03 g (☆), respectively.
34
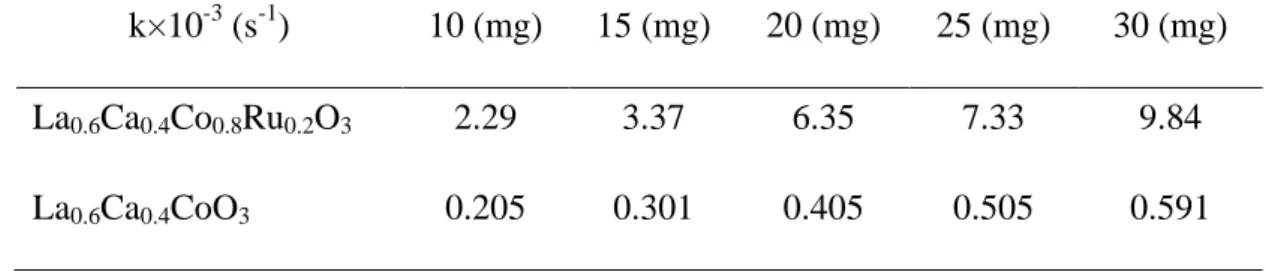
Table 4.1 The decomposition rate for La0.6Ca0.4Co0.8Ru0.2O3 and La0.6Ca0.4CoO3. k×10-3 (s-1) 10 (mg) 15 (mg) 20 (mg) 25 (mg) 30 (mg) La0.6Ca0.4Co0.8Ru0.2O3 2.29 3.37 6.35 7.33 9.84 La0.6Ca0.4CoO3 0.205 0.301 0.405 0.505 0.591
In typical heterogeneous reactions, the actual surface area is critical as it determines the available sites for catalytic actions. Therefore, it would be necessary to obtain the true surface area for both La0.6Ca0.4CoO3 and La0.6Ca0.4Co0.8Ru0.2O3 to compare their catalytic abilities. The BET surface area for La0.6Ca0.4CoO3 and La0.6Ca0.4Co0.8Ru0.2O3 was 9.2 and 11.6 m2g-1, respectively. Fig. 4.5 presents the plot of k, which was selected from the linear regime of Fig. 4.4, as a function of actual surface area for both samples. Notably, the k value for the La0.6Ca0.4CoO3 remained relatively unchanged. In contrast, the k value for the La0.6Ca0.4Co0.8Ru0.2O3 rose with increasing surface area.
We realized that in our system the decomposition of H2O2 might occur in a pseudo-homogeneous first-order reaction as shown in Eq. 3-5 [44]. Hence, during the experiments under constant stirring, it was likely that the microstructure of perovskite powders was altered which exposed to a larger surface area. As a result, we observed accelerated O2 evolution as a function of time and catalyst loading.
2 2 t 2 2 t
d[H O ]
[H O ] [Catalyst]
dt
k
−
=
(3-5) Actually, the k value for La0.6Ca0.4CoO3 was increased slightly with H2O235
decomposition time and catalyst loading. Its value was found to increase from 2.05×10⁻⁴ to 5.91×10⁻⁴ s-1. Because both La0.6Ca0.4CoO3 and La0.6Ca0.4Co0.8Ru0.2O3 followed the pseudo-homogeneous first-order reaction, they behaved similarly, as shown in Fig. 4.5. Since both the intercept at the infinitesimal surface area and the slope for La0.6Ca0.4Co0.8Ru0.2O3 were substantially larger than those of La0.6Ca0.4CoO3, we determined that the former possesses a superior catalytic performance for H2O2 decomposition. This would likely lead to a better ORR GDE for La0.6Ca0.4Co0.8Ru0.2O3.