應用多準則決策模型探討影響銀行業經營績效之要素─以平衡計分卡為架構
54
0
0
全文
(2) . 應用多準則決策模型探討影響銀行業經營績效之要 素─以平衡計分卡為架構 指導教授:鄭育仁 博士 國立高雄大學經營管理研究所 學生:黃士豪 國立高雄大學經營管理研究所 摘要 本研究以平衡計分卡為架構探討影響銀行業經營績效之要素。並以決策實 驗室分析法(DEMATEL)與網路分析法(ANP)所結合的 DANP 方法分析構面間的相互 影響性與衡量各要素的重要性。 本研究透過文獻回顧與專家意見蒐集要素並訪談八位來至金融控股公司與 非金融控股銀行的經理人。研究結果顯示,在平衡計分卡四個構面當中財務構 面扮演最重要關係構面,而學習與成長構面則為最具影響性構面。因此,藉由 其他三個構面的改善可以達到最終財務構面的成功。研究結果也指出金融控股 公司可運用集團資源共享達到綜效,非金融控股銀行則可利用高度自主權制定 適合銀行本身的營運決策。 此外研究結果呼應學者 Kaplan 與 Norton 所提出的策略地圖構想,但本研 究更進一步顯示每一構面間的相互影響性之關係。 關鍵字:銀行績效、平衡計分卡、多準則決策、DANP I .
(3) . Apply DANP to explore the determinants affecting Taiwan banking performance: Based on the perspectives of balanced scorecard Advisor: Dr. Cheng, Yu-Jen Institute of Business and Management NationalUniversity of Kaohsiung Student: Huang, Shih-Hao Institute of Business and Management NationalUniversity of Kaohsiung Abstract This research adopts the balance scorecard as a framework to evaluate the determinants that affect banking performance. Then, employs the hybrid model that combines decision making trial and evaluation laboratory (DEMATEL) and analytic network process (ANP) to confirm the relationship between perspectives and measure the relative importance of each determinant. This research collects discussion factors from relevant literature and experts and interviews eight senior managers that consist of four financial holding companies and four non-financial holding banks. The research results reveal that the perspective of finance receives the heaviest influence from the other perspectives whereas the perspective of learning and growth dispatches the strongest influence on the other perspectives. Therefore, the improvement of other perspectives can result in the achievement of financial performance. This research also points out that the financial holding companies may utilize resource sharing to gain synergy, while the non-financial holding banks can only make use of higher autonomy in decision-making to improve their performance. Moreover, the results confirm the process of the strategy map that Kaplan and Norton (2004) proposed, yet this research presents the mutual dependent of each perspective, additionally. Keywords: Banking performance, Balanced scorecard (BSC), Multiple Criteria Decision Making (MCDM), DANP (DEMATEAL-based ANP) II .
(4) . 致謝 完成碩士學位的過程中,首先要致謝的莫過於指導教授鄭育仁老師,除了 論文本身的指導與建議外還幫忙修改英文文句的流暢性,此外也謝謝老師常在 指導過程中提醒我須無時無刻保有謹慎的做事態度。感謝口試委員陳筠昀老師 與童桂馨老師特地撥冗於論文口試時給予指正與建議,使本論文能夠更加完善。 另外,也相當感謝學弟妹的幫忙讓粗線條的學長能夠及時完成論文與樣本 收集的最大功臣─好朋友 JOY 的父母。最後感謝爸媽在背後默默的支持並資助 我於碩二時至日本參與交換學生課程,完成留學的夢想。 . III .
(5) . Contents Chapter 1 Introduction ................................................................................................. 1 1.1 Research Background and Motivation ................................................................ 1 1.2 Research Purpose ................................................................................................ 4 1.3 Research Contributions ....................................................................................... 5 1.4 Research Structure............................................................................................... 6 Chapter 2 Literature Review ....................................................................................... 7 2.1 The balanced scorecard ....................................................................................... 7 2.2.Banking performance in financial measure......................................................... 9 2.3 Banking performance in customer .................................................................... 11 2.4 Banking performance in internal business process ........................................... 12 2.5 Banking performance in learning and growth................................................... 13 Chapter 3 Research Methodology ............................................................................. 15 3.1 MCDM .............................................................................................................. 15 3.1.1 DEMATEL ..................................................................................................... 15 3.1.2 ANP ................................................................................................................ 16 3.1.3DANP .............................................................................................................. 16 3.2 Research Procedure........................................................................................... 17 3.2.1 Application of DEMATEL for network relationship...................................... 17 3.2.2 Weight measurements by integrating DEMATEL and ANP .......................... 19 3.2.3 Screening the factors from past literature and experts opinions .................... 21 3.2.4 Date Collection............................................................................................... 22 Chapter 4 Research Results ....................................................................................... 25 4.1 Measuring relationships among perspectives.................................................... 25 4.1.1The ranking of ( Di + Ri ) and ( D i - R i ) ........................................................... 26 4.1.2 The causal diagram......................................................................................... 27 IV .
(6) . 4.1.3 A strategy map of banking.............................................................................. 28 4.2 Weight measuring among factors ...................................................................... 29 4.2.1. The ranking of the factors ............................................................................. 33 4.3 Comparing the weight of financial holding companies and nonfinancial holding. banks ..................................................................................................... 34. 4.4 Discussion ......................................................................................................... 35 Chapter 5 Conclusion ................................................................................................ 38 Reference ................................................................................................................... 40 Appendix ................................................................................................................... 45. V .
(7) . List of Figures Fig. 1.1 The number of banks in Taiwan ....................................................................... 1 Fig. 1.2 Interest rate spread on deposits and loans of banks in Taiwan......................... 2 Fig. 4.1 Causal diagram of total relationship............................................................... 28 Fig. 4.2 A strategy map of the four perspectives for banking ..................................... 29. List of Tables Table 1.1 List of banks in Taiwan ................................................................................. 3 Table 1.2 Performance of banks in Taiwan ................................................................... 4 Table 3.1 Pair-wisecomparisons questionnaire ........................................................... 17 Table 3.2 Descriptions of the selected factors for banking performance .................... 22 Table 3.3 Comparison of the impact of the 4 perspectives.......................................... 23 Table 3.4 Comparison of the impact of the 16 determinants ..................................... 24 Table 4.1 The profile of respondents in eight banks.................................................... 25 Table 4.2 The basic information of eight banks .......................................................... 26 Table 4.3 The initial direct influence matrix A of the four perspectives..................... 26 Table 4.4 The normalized direct influence matrix X of the four perspectives ............ 26 Table 4.5 The total influence matrix T of the four perspectives.................................. 26 Table 4.6 The gives and received influences of the four perspectives ........................ 26 Table 4.7 The initial direct influence matrix A of the 16 selected factors................... 30 Table 4.8 The normalized direct influence matrix X of the 16 selected factors ........ 30 Table 4.9 The total influence matrix T of the 16 selected factors ............................... 31 Table 4.10 The unweighted super matrix of the 16 selected factors ........................... 32 Table 4.11 The weighted super matrix of the 16 selected factors ............................... 32 Table 4.12 The limiting super matrix of the 16 selected factors ................................. 32 Table 4.13 Weights and ranking .................................................................................. 34 Table 4.14 The difference between financial holding companies and nonfinancial holding banks ............................................................................................................... 34 VI .
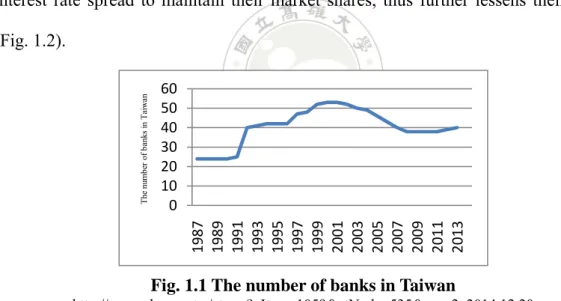
(8) . Chapter 1 Introduction 1.1 Research Background and Motivation Financial institutions in Taiwan can be categorized into banks, credit cooperative associations, credit departments of farmers' and fishermen's associations, securities, trust and investment companies, insurance companies. Banks normally serve as the main financial institutions. Since the 1990s, under the financial deregulation policy mushrooms the establishment of private banks until 2013, the number of banks has increased from 24 to 40, 1’ 2 depicted as Figure 1.1. 0. 1F1F. The excessive opening of new banks results in fierce competition among commercial banks. Under such competitive circumstance, the banks tend to shrink the interest rate spread to maintain their market shares, thus further lessens their profit. 60 50 40 30 20 10 0. 1987 1989 1991 1993 1995 1997 1999 2001 2003 2005 2007 2009 2011 2013. The number of banks in Taiwan. (Fig. 1.2).. Fig. 1.1 The number of banks in Taiwan http://www.cbc.gov.tw/ct.asp?xItem=1059&ctNode=535&mp=2, 2014.12.20 Source: Central Bank of the Republic of China (Taiwan), Financial Statistics Monthly. 1. For solving a domestic financial crisis in 1998,Taiwan government encouraged credit cooperative associations with better operating performance to transforminto banks. Hence, the number of banks reached a peak in 2000. 2 Taiwan government passed the Financial Institutions Merger Act in December 2000which enables local financial institutions to merge or acquire other financial institutions as a solution to cope with the overbanking problems. Therefore, the number of banks is reduced slightly. 1 .
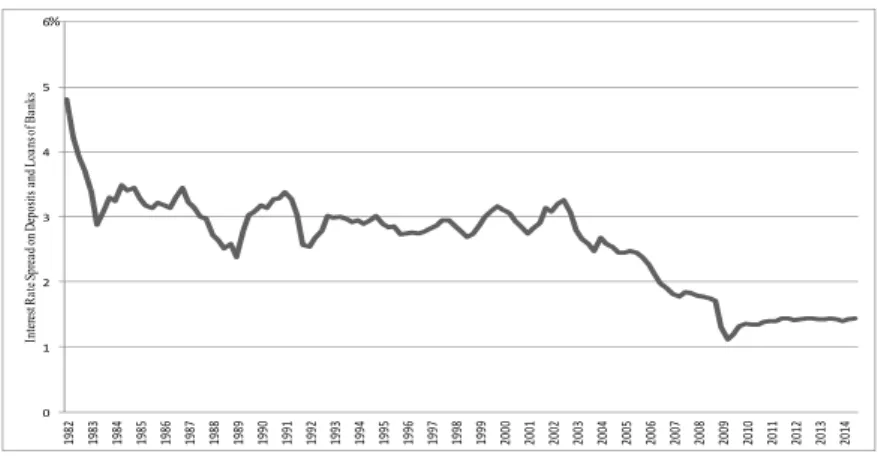
(9) . Interest Rate Spread on Deposits and Loans of Banks. 6%. 5. 4. 3. 2. 1. 2014. 2013. 2012. 2011. 2010. 2009. 2008. 2007. 2006. 2005. 2004. 2003. 2002. 2001. 2000. 1999. 1998. 1997. 1996. 1995. 1994. 1993. 1992. 1991. 1990. 1989. 1988. 1987. 1986. 1985. 1984. 1983. 1982. 0. Fig. 1.2 Interest rate spread on deposits and loans of banks in Taiwan http://www.cbc.gov.tw/ct.asp?xItem=1059&ctNode=535&mp=2, 2014.12.20 Source: Central Bank of the Republic of China (Taiwan), Financial Statistics Monthly. To solve of overbanking problem, the Taiwan government conducted a series of financial reforms, including promulgated (1) the Financial Institutions Merger Act is passed in 2000 to regulate the merger of financial institutions, expand economic of scale and scope, and enhance the operational efficiency of existing financial institutions; yet, some independent banks insist their original operation style to focus on the niche market. (2) the Financial Holding Company Act in 2001 to consolidate the supervision of cross-financial industry and promote the synergy of financial markets. At 2014, there are 15 financial holding companies 3 and 22 nonfinancial holding 2F2F. banks in Taiwan, depicted as Table1.1.. 3. The Waterland Financial Holdings is omitted in this research because it do not consist subsidiary bank. 2 .
(10) . Table 1.1 List of banks in Taiwan Subsidiary bank of financial holding company Name of Company 1.Hua Nan financial holdings 2.Fubon financial holdings 3.China development financial holdings 4.Cathay financial holdings 5.E.Sun financial holdings 6.Mega financial holdings 7.Yuanta financial holdings 8.Jihsun financial holdings 9.Taishin financial holdings 10.Shin Kong financial holdings 11.Sino Pac financial holdings 12.CTBC financial holdings 13.First financial holdings 14.Taiwan financial holdings 15.Taiwan corporative financial holdings. Date of establishment 2001/12 2001/12 2001/12 2001/12 2002/01 2002/02 2002/02 2002/02 2002/02 2002/02 2002/05 2002/05 2003/01 2008/01 2011/12. Independent bank Name of Company 1.Chang Hwa commercial bank 2.Taiwan Business Bank 3. Land Bank of Taiwan 4. The Shanghai Commercial & Savings Bank 5. Bank of Kaohsiung 6. Union Bank of Taiwan 7. Cosmos Bank, Taiwan 8. Far Eastern international bank 9. Ta Chong Bank Ltd. 10. EnTie Commercial Bank 11. Sunny Bank 12. Bank of Panhsin 13. Taichung Commercial Bank 14. Hwatai Bank 15. Cota Commercial Bank 16. King's Town Bank 17. Standard Chartered Bank (Taiwan) Limited 18. Bank of Taipei 19. Citibank Taiwan Limited 20. HSBC Bank (Taiwan) Limited 21. Development Bank of Singapore (Taiwan) 22. ANZ Bank(Limited) Limited. Date of establishment 1947/03 1915/06 1946/09 1954/09 1981/10 1991/12 1992/01 1992/01 1992/03 1993/01 1997/09 1997/09 1998/12 1999/01 1999/01 2006/05 2006/11 2007/07 2007/09 2010/01 2011/09 2012/10. http://www.cbc.gov.tw/lp.asp?ctNode=495&CtUnit=210&BaseDSD=7&mp=2,2014.12.20 Source: Central Bank of the Republic of China (Taiwan), List of Financial Institutions.. Even the banking industry can be easily separated as financial-holding companies and nonfinancial-holding banks, the operation performance is varied within each category, show as Table 1.2.. 3 .
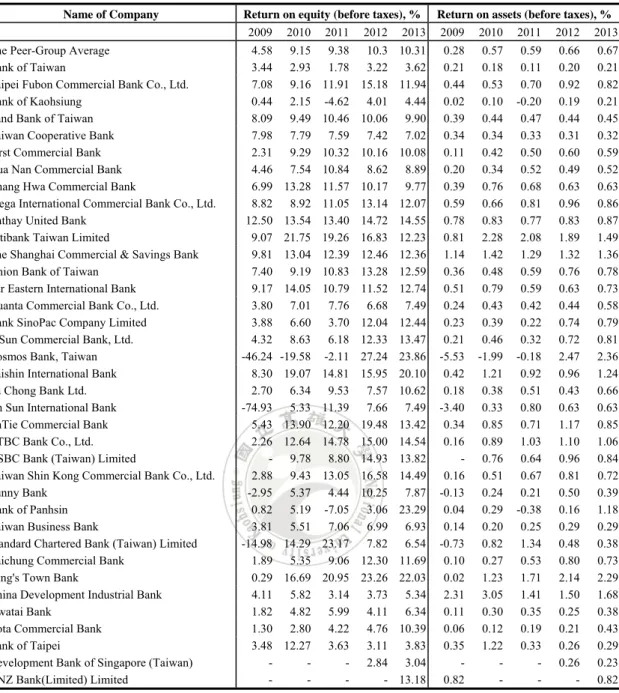
(11) . Table 1.2 Performance of banks in Taiwan Name of Company The Peer-Group Average Bank of Taiwan Taipei Fubon Commercial Bank Co., Ltd. Bank of Kaohsiung Land Bank of Taiwan Taiwan Cooperative Bank First Commercial Bank Hua Nan Commercial Bank Chang Hwa Commercial Bank Mega International Commercial Bank Co., Ltd. Cathay United Bank Citibank Taiwan Limited The Shanghai Commercial & Savings Bank Union Bank of Taiwan Far Eastern International Bank Yuanta Commercial Bank Co., Ltd. Bank SinoPac Company Limited E.Sun Commercial Bank, Ltd. Cosmos Bank, Taiwan Taishin International Bank Ta Chong Bank Ltd. Jih Sun International Bank EnTie Commercial Bank CTBC Bank Co., Ltd. HSBC Bank (Taiwan) Limited Taiwan Shin Kong Commercial Bank Co., Ltd. Sunny Bank Bank of Panhsin Taiwan Business Bank Standard Chartered Bank (Taiwan) Limited Taichung Commercial Bank King's Town Bank China Development Industrial Bank Hwatai Bank Cota Commercial Bank Bank of Taipei Development Bank of Singapore (Taiwan) ANZ Bank(Limited) Limited. Return on equity (before taxes), % Return on assets (before taxes), % 2009 2010 2011 2012 2013 2009 2010 2011 2012 2013 4.58 3.44 7.08 0.44 8.09 7.98 2.31 4.46 6.99 8.82 12.50 9.07 9.81 7.40 9.17 3.80 3.88 4.32 -46.24 8.30 2.70 -74.93 5.43 2.26 2.88 -2.95 0.82 3.81 -14.98 1.89 0.29 4.11 1.82 1.30 3.48 -. 9.15 2.93 9.16 2.15 9.49 7.79 9.29 7.54 13.28 8.92 13.54 21.75 13.04 9.19 14.05 7.01 6.60 8.63 -19.58 19.07 6.34 5.33 13.90 12.64 9.78 9.43 5.37 5.19 5.51 14.29 5.35 16.69 5.82 4.82 2.80 12.27 -. 9.38 1.78 11.91 -4.62 10.46 7.59 10.32 10.84 11.57 11.05 13.40 19.26 12.39 10.83 10.79 7.76 3.70 6.18 -2.11 14.81 9.53 11.39 12.20 14.78 8.80 13.05 4.44 -7.05 7.06 23.17 9.06 20.95 3.14 5.99 4.22 3.63 -. 10.3 3.22 15.18 4.01 10.06 7.42 10.16 8.62 10.17 13.14 14.72 16.83 12.46 13.28 11.52 6.68 12.04 12.33 27.24 15.95 7.57 7.66 19.48 15.00 14.93 16.58 10.25 3.06 6.99 7.82 12.30 23.26 3.73 4.11 4.76 3.11 2.84 -. 10.31 3.62 11.94 4.44 9.90 7.02 10.08 8.89 9.77 12.07 14.55 12.23 12.36 12.59 12.74 7.49 12.44 13.47 23.86 20.10 10.62 7.49 13.42 14.54 13.82 14.49 7.87 23.29 6.93 6.54 11.69 22.03 5.34 6.34 10.39 3.83 3.04 13.18. 0.28 0.21 0.44 0.02 0.39 0.34 0.11 0.20 0.39 0.59 0.78 0.81 1.14 0.36 0.51 0.24 0.23 0.21 -5.53 0.42 0.18 -3.40 0.34 0.16 0.16 -0.13 0.04 0.14 -0.73 0.10 0.02 2.31 0.11 0.06 0.35 0.82. 0.57 0.18 0.53 0.10 0.44 0.34 0.42 0.34 0.76 0.66 0.83 2.28 1.42 0.48 0.79 0.43 0.39 0.46 -1.99 1.21 0.38 0.33 0.85 0.89 0.76 0.51 0.24 0.29 0.20 0.82 0.27 1.23 3.05 0.30 0.12 1.22 -. 0.59 0.11 0.70 -0.20 0.47 0.33 0.50 0.52 0.68 0.81 0.77 2.08 1.29 0.59 0.59 0.42 0.22 0.32 -0.18 0.92 0.51 0.80 0.71 1.03 0.64 0.67 0.21 -0.38 0.25 1.34 0.53 1.71 1.41 0.35 0.19 0.33 -. 0.66 0.20 0.92 0.19 0.44 0.31 0.60 0.49 0.63 0.96 0.83 1.89 1.32 0.76 0.63 0.44 0.74 0.72 2.47 0.96 0.43 0.63 1.17 1.10 0.96 0.81 0.50 0.16 0.29 0.48 0.80 2.14 1.50 0.25 0.21 0.26 0.26 -. 0.67 0.21 0.82 0.21 0.45 0.32 0.59 0.52 0.63 0.86 0.87 1.49 1.36 0.78 0.73 0.58 0.79 0.81 2.36 1.24 0.66 0.63 0.85 1.06 0.84 0.72 0.39 1.18 0.29 0.38 0.73 2.29 1.68 0.38 0.43 0.29 0.23 0.82. http://www.cbc.gov.tw/np.asp?ctNode=901&mp=2, 2014.12.20 Source: Central Bank of the Republic of China (Taiwan), Condition and Performance of Domestic Banks. 1.2. Research Purpose Normally, banking industry plays an important role in the economic activities. This research investigates the factors that affect banking performance by the four perspectives of balanced scorecard. The purposes of this research are described as follows:. 4 .
(12) . 1. To investigate the factors that affect banking performance. 2. To interpret the interrelationship between each perspective and factor. 3. To show the difference of operation factors by comparing financial holding companies with nonfinancial holding banks. 4. To construct a strategy map for describing the mutual influence of each perspective. 5. To provide the results of this research as a reference for policy making or operation performance improvement. 1.3. Research Contribution This research engages in exploring and discussing the factors that affect banking performance in Taiwan banking industry. The research results show that the perspective of finance presents the most relationship with the other perspectives. The perspective of learning and growth shows the strongest influence on the other perspectives. According the strategy map, banks managers should not only focus on management of finance, but also highlight the other perspectives to achieve better performance. This research also points out that the financial holding companies may utilize resource sharing to gain synergy, while the non-financial holding banks can only make use of higher autonomy in decision-making to improve their performance. Finally, the results of this research can be organized to formulate subjection for government policy making and operation performance improvement for banking industry. Finally, the results of this research can be organized to formulate subjection for government policy making and operation performance improvement for banking industry.. 5 .
(13) . 1.4. Research Structure The remainder of this research is organized as follows: Chapter 2 shows the review of literature related to banking performance. Chapter 3 introduces of the research methodology (a hybrid of DEMATEL and ANP) and research procedure. Chapter 4 presents the research results and discussion and the conclusion will be summarized in chapter 5.. 6 .
(14) . Chapter 2 Literature Review Banking industry plays an important role of financial intermediate in the country's economic activities. The related issues of banking performance motivate a lot of scholars to study. Some of scholars apply the balanced scorecard to explore banking performance, i.e., Wu (2011) distinguishes banking industry from four perspectives (Financial, Customer, Internal business process, and Learning and growth) by the balanced scorecard to explore its performance. This chapter adopts Wu's classification and reviews past researches about banking performance. Firstly, it describes the contents and application of the balanced scorecard, and then discusses the banking performance in financial measure, customer, internal business process, and learning and growth, respectively. 2.1 The balanced scorecard The balanced scorecard, a widely used framework for performance measurement, proposed in recent years, was introduced in the early 1990s by Robert Kaplan and Nolan Norton. Kaplan and Norton (1992) observe that traditional measures of financial indexes can only provide a confined and imperfect picture of business performance, and that the dependence on the financial data restrains the value creation of future business. Kaplan and Norton (1992) therefore propose the balanced scorecard from four perspectives (finance, customer, internal business process, and learning and growth) to complement the traditional financial measures. The financial perspective emphasizes that the financial perspective metrics can measure economic performance in terms of financial outcomes. The customer perspective highlights the market segmentation of customer, organizations should utilize their intrinsic advantages and resources to distinguish the differences with 7 .
(15) . their competitors. The perspective of internal business process focuses on defining the critical internal operations and objectives that enable a company to increase value creation over time. Learning and innovation put emphasis on the importance of organizational capabilities that ensure continuous improvement of knowledge management, human resource capabilities and sharing of information (Kaplan and Norton, 1992, 1996). Each perspective of the balanced scorecard provides a different view of the organization, the related business processes and how these business processes contribute to the successful implementation of the corporate strategy (Kaplan and Norton, 1996). Through the balanced development of the four aforementioned perspectives mentioned above, the company not only keeps the measure of financial perspectives but also prompts the measure of the elements of the performance motivation toward the financial goals directly or indirectly, so that the company can pursue the growth and consider the development of future at the same time (Kaplan and Norton, 1996; Gumbus and Lyron, 2002). Chenhall (2008) also indicates the distinctive feature of the balanced scorecard is that it identifies financial and non-financial measures covering different perspectives, which provides a way of translating strategy into action. The concept of balanced scorecard is that can make an organization to clarify its vision, improve internal and external communications, and monitor organization performance against strategic goals by four perspectives, and make it to be a performance of measuring for all aspects (Kaplan and Norton, 1992, 1996). Furthermore, Kaplan and Norton (2004) created a tool of management, strategy map, which companies can use it to convert intangible assets into tangible outcomes with 8 .
(16) . an unprecedented degree of clarity and precision. The balanced scorecard is a widely used framework and is applied to many industries, i.e., manufacturing industry (Hoque and James, 2000), hotel industry (Banker et al., 2000), health care organizations (Bisbe and Barrubés, 2012), extension education centers in universities (Wu et al., 2011), banking industry (Tseng and Jheng, 2008) etc. In addition, many scholars also combine another methodology with the balanced scorecard to evaluate the performance of business, i.e., the balanced scorecard and fuzzy data envelopment analysis (Hsu, 2005), fuzzy MCDM based on balanced scorecard (Wu et al., 2009), fuzzy AHP and BSC approach (Lee et al., 2008), balanced scorecard approach based on a hybrid MCDM model combining DEMATEL and ANP (Chen et al., 2011), data envelopment analysis and balanced scorecard (Chen et al., 2008). 2.2 Banking performance in financial measure Under the environment of hyper-competitive and risk increasing, it's important to manage operating performance in bank industry. In the financial perspective, Wu (2011) concludes that there are six factors (i.e., operating revenues, debt ratio, return on assets, earnings per share, profit margin, and return on investment) can be used to evaluate banking performance. Chen (1999) applies in-depth interviews to research the banking performance measurement by the balance scorecard and finds that asset utilization efficiency, capital allocation analysis, earnings achievement ratio, profitability, and rate of return can be used as the indicators of financial perspective.Chu (2008) studies the case of domestic banks’ operational performance in Taiwan, he found that the five factors, i.e., profit ability, growth ability, capital adequacy, operational ability, and assets quality, the results show that growth ability, operational ability, and asset quality have significant influence in financial-holding 9 .
(17) . subsidiary banks.Huang et al. (2011) apply the analytic hierarchy process to investigate the measures and strategies in a BSC framework. According the result, assure sustainable shareholder value, intellectual property, maintain the asset quality, and customer relationship management are the prioritizing strategies for strategy execution. In the traditional business of banking, Saunders and Schumacher (2000) investigate the determinants of bank net interest margins in six selected European countries and the US and find that capital-to-asset ratios, interest-rate restrictions on deposits, and reserve requirements have a significant impact on bank’s net interest margins. Banks also can enhance profit by diversification. In the issue of diversification, it is indicated that both interest spread and non-interest income generating activities can improve banking performance. Rogers and Sinkey (1999) conclude that commercial banking in the United States has become more involved in nontraditional activities that provide financial services and generate fee income in recent years. They suggest that these banks tend to be larger, have smaller net interest margins, have relatively fewer core deposits, and exhibit less risk by empirical analysis. Li and Zhang (2013) indicate that there are diversification benefits of the increase in non-interest income by analyzing the data from the Chinese banking industry in 1986–2008. The results of diversification also show a circumstantial evidence for the presence of economies of scale (Amidu and Wolfe, 2013).. 10 .
(18) . 2.3 Banking performance in customer In some studies, customer satisfaction is indicated that is positive and statistically significant associated with short-term and longer-term future performance. The results also showed that the enterprises with higher-level customer satisfaction can increase higher profitability (Christopher and David, 1998; Zhang and Pan, 2009; Sim et al., 2010). Mohammed and Tony (2006) think that customer satisfaction is confirmed as a mediator in the relationship between performance and automated service quality. Jose (2000) also indicates that customer loyalty, customer satisfaction and service quality are some of the most important concepts in the marketing of banking. Ho (2009) recognizes that relationship marketing plays an important role for bank's competence. The major factor of determining the success of the relationship marketing is the customer loyalty. In the study about efficiency of customer service and performance, Duncan and Elliott (2004) indicate that performance measures i.e., capital adequacy, expense/income, interest margin, and return on assets are positively correlated with customer service quality. Liu and Wu (2007) examine the effects of direct mailings, firm reputation, firm expertise, locational convenience, and one-stop shopping convenience on both cross-buying and customer retention. The results of this study conclude that banks can influence customer retention and cross-buying by different service attributes. Chen (1999) selects market share rate and customer growth rate to be the indicators of customer perspective in her study of banking performance. In addition, based on a case study conducted in Chase Manhattan Bank, Namchul and Donald (2002) show that the internal business process projects such as service charge reengineering and e-fund disbursement cards will result in new products and services in addition to producing dramatic increases in operating 11 .
(19) . savings and revenue. Datta and Kundu (2011) apply secondary data on selected Indian public and private sector banks to examine whether e-banking initiatives can be considered as a successful case of business process reengineering implementation. They conclude that customers prefer electronic delivery channel (i.e., ATMs and electronic funds transfer) more than that of traditional branch banking. 2.4 Banking performance in internal business process Banks not only apply in financial and customer perspective but also focus on internal business process to enhance the performance of business. In order to achieve competitive advantage, internal business process must be different from the organization's rivals or perform in a superior way (Litter et al., 2000; Škrinjar et al., 2008). Škrinjar et al. (2008) study the impact of business process, the results of empirical research show that business process orientation create better non‐financial performance and indirectly affect to better performance. Benaroch et al. (2012) apply an event study to examine the economic impact of a diversified sample of IT operational risk events from the U.S. financial services industry during 1985-2009. They indicate that IT control is important of the dependence of business processes on IT systems and a tendency to build into these systems' automated managerial controls. Banking can cut down the cost by the efficiency of transaction processing and the frequency of operating equipment utilization (Chen, 1999). Wu et al. (2010) also think that banks can evaluate organizational performance on the basis of innovation in system programming, certification of a financially integrated professional platform, and management stratum support in the perspective of internal business process. Some indexes of internal business process (i.e., new service items, rationalized forms and processes, sales performance, and management performance) were selected to evaluate banking 12 .
(20) . performance (Wu, 2011). As a result of financial globalization and liberalization, the development of financial institutions has led to the establishment of financial holding companies to pursue the economics of scale and scope and enhance the operational efficiency. Haan and Poghosyan (2012) find that bank size reduces return volatility by using quarterly data for bank holding companies in the United States and controlling for the quality of management, leverage, and diversification. Hu et. al (2009) conclude that it is an important for financial holding companies to be operated efficiently by using data envelopment analysis. Chiou (2009) investigates whether commercial banks in Taiwan establishing or joining in financial holding companies could promote their efficiency and productivity. The results show that except for pure technical efficiency, other efficiencies and productivity of commercial banks do not be enhance because of establishing or joining in financial holding companies. 2.5 Banking performance in learning and growth Sim et al. (2010) indicate that if employees have the ability of diagnosing and responding to complaints of customer, the negative effects of a service failure will be reduced. Therefore, management should make frontline employees to have trained, that would help to enhance repurchase behavior and brand loyalty and improve performance. Davis and Albright (2004) employ empirical analysis to investigate the impact of the balanced scorecard on a banking institution's financial performance. The conclusion of that study is business train employees with customer service, office technology efficiency, product offerings, and sales techniques can enhance employee's ability to recognize customer needs, cross-sells, referrals, and customer service. Ardichvilia and Gasparishvilib (2001) indicate that the use of learning technologies is a growing trend towards in medium-sized banks. A study of 13 .
(21) . Australian financial institution’s training program, the authors suggest that training of social skills should theoretically be crucial to gain competitive advantage. Based on a cross-sectional sample of 155 banking firms, Lin (2007) finds that both capability of information technology and human capital investment contribute directly to the overall value-creation performance of banking firms. Wu et al. (2010) evaluate the performance of WM banks in Taiwan by applying the analytical hierarchy process and grey relational analysis. The result of this study suggests that employees’ professional knowledge, education and training of employees should be considered in bank industry. Chen (1999) also selects training in a specialty of employee and stability of employee to be the indicators of learning and growth perspective. In sum, since banking industry plays an important role in the economic activities attracts scholars to explore the banking performance. Several analysis approaches have been applied to evaluate the banking performance, i.e., analytic network process (ANP), balanced scorecard (BSC), decision making trial and evaluation laboratory (DEMATEL), data envelopment analysis (DEA), ratio analysis, and regression analysis. This research employs balanced scorecard as a framework to investigate the banking performance by DANP method.. 14 .
(22) . Chapter 3 Research Methodology To investigate the factors that affect banking performance, this research firstly selects the factors from related literature and expert opinions. Then, applies the four perspectives of balanced scorecard as a framework to posit those factors, respectively. In the following, this research adopts the hybrid MCDM (Multiple Criteria Decision Making) model 4 that was proposed by Ou Yang et al. (2008) to confirm the 3F3F. interrelationship between each perspective and factor and measure the relative importance of each factor. Finally, the results are applied to construct the strategy map for describing how banks can create value by connecting strategic objectives to clarify the causes and effects relationship among the perspectives. 3.1 MCDM Multi-Criteria Decision Making (MCDM) is a methodology to evaluate and compare alternatives. MCDM refers to the problem of selecting among alternatives associated with multiple criteria (Pohekar and Ramachandran, 2004). A number of methods have been used for MCDM such as DEMATEL AHP, ANP, VIKOR and TOPSIS to deal with the problems of decision making. 3.1.1 DEMATEL The DEMATEL (Decision Making Trial and Evaluation Laboratory) method, developed by the Battelle Memorial Institute of Geneva between 1972 and 1976, is a widely used methodology to research on and solve complicated and intertwined problems. Gabus and Fontela (1976) indicate that DEMATEL can convert the causes and effects relationship between factors into an intelligible structure of the system. 4. In order to suit the real world application, Ou Yang et al. (2008) propose a novel hybrid MCDM model combined with DEMATEL and ANP to solve the dependence and feedback problems. 15 .
(23) . Liou et al. (2008) also indicate that DEMATEL approach can find out the structural relations among diverse factors in a complex system. DEMATEL is applied to many industries for exploring the causes and effects relationship in decision making or management, i.e., safety management system for airlines (Liou et al., 2008), healthcare industry (Lu et al., 2013), green supply chain management (Hsu et al., 2013), network communication equipment manufacturing industry (Hu et al., (2011), restaurant space design (Horng et al., 2013). 3.1.2 ANP ANP (Analytic Network Process) method, proposed by Satty (1996), is an extension of Analytic Hierarchy Process (AHP). AHP (Satty, 1980) is a decision making framework for using a unidirectional hierarchical relationship among factors, but ANP allows more complex interrelationships among factors to resolve the interdependence and feedback relations of factors. Allowing the existence of a feedback relationship among factors within this framework is the major difference between these two techniques. The ANP provides a way to derive the priorities by ratio scale for the distribution of influence among the criterion and groups of factors in the decision making process (Chen et al., 2011). ANP has also been applied in many decision-making problems successfully, i.e., innovative culinary development (Hu, 2009), green supply-chain management (Sarkis, 2003), evaluation of hot spring hotel service quality (Hsieh et al., 2008), enterprise risk management (Yilmaz, 2007), the best biodiesel blend selection (Sakthivel et al, 2014), and strategic alliance partner selection in the airline industry (Liou et al., 2011). 3.1.3 DANP DANP, a hybrid of DEMATEL and ANP, is proposed by Ou Yang et al. (2008) for overcoming the problem of interdependence and feedback among decision 16 .
(24) . making criteria. Ou Yang et al. (2008) show that the DEMATEL method can easily account for normalization in the super-matrix by assuming each cluster has equal weight, but it ignores the different effects among clusters. The result of their study shows that the proposed DANP method is more suitable in applications than the traditional ones by combining with DEMATEL and ANP to solve the dependence and feedback problems. 3.2 Research Procedure The DANP applies DEMATEL to investigate interdependences between factors of banking performance and then incorporates ANP to evaluate the priority of factors. The procedures of DANP are described as follows. 3.2.1 Application of DEMATEL for network relationship The first step of DANP method is to calculate the direct-relation matrix. At the beginning, the respondents are asked by pair-wise comparisons questions (depicted as table. 3.1) to derive the degree of direct influence. Table 3.1 pair-wise comparisons questionnaire. A. B. C. A B C In order to calculate magnitudes of influence correctly, the scales of 0, 1, 2, 3 and 4 represent the range from “no impact” to “very high impact”. Each respondent will produce a direct-relation matrix Dk , k=1, 2,···, n, represents the number of respondents. Each element of direct-relation matrix Dk , denoted by d ijk , shows the initial direct effects that each criterion exerts on and receives from other factor. The matrix D is expressed as the following formula:. 17 .
(25) . ⎡d11k L d1kj L d1kn ⎤ ⎢ ⎥ M M M ⎥ ⎢ D = ⎢⎢d ik1 L d ijk L d ink ⎥⎥ ⎢ M M M ⎥ ⎢ k ⎥ L d njk L d nnk ⎥⎦ ⎢⎣d n1 . (1). Secondly, the average matrix A is calculated by the mean of the same factor in the various direct matrices of the respondents. Each element of matrix A, denoted as αij , is calculated by formula (2).. ∑ =. α ij. n k =1. d ijk. (2). n. The second step of DANP method is to calculate the initial direct-relation matrix. The initial direct-relation matrix X (i.e., X = [xij ]n×n ) can be obtained by normalizing the average matrix A through formulas (3) and (4), in which all principal diagonal factors are equal to zero. X = s× D. s=. (3) 1. (4). MAX1≤i≤n ∑ nj=1 xij. The third step of DANP method is to derive the total influence matrix. Once the normalized direct-relation matrix X is obtained, the total relation matrix T can be acquired through formula (5), in which the Iis denoted as the identity matrix. Matrix T is the direct/indirect matrix. The factors ij of matrix T denotes the direct and. indirect influence from factor ito factor j. T = lim(X + X 2 + ... + X k ) k →∞. (5). = lim X(I + X + X 2 + ... + X k −1 ) = X(I − X ). −1. k →∞. The fourth step of DANP method is toanalyze the results of influences and relationships. Vector D and vector R,a level of influence and a level of relation are 18 .
(26) . defined as formula (6) and (7), respectively denote the sum of columns and the sum. [ ]. of rows from total relation matrix T = t ij n. Di = ∑ tij j =1 n. R j = ∑ t ij j =1. n× n. .. (i = 1,2 ,..., n). (6). (i = 1,2,..., n). (7). The value of ( Di + Ri ) is called prominence and indicates the strength of influence both dispatch and receipt. A higher value of ( Di + Ri ) means that the perspective plays a central role and has a stronger connection with the other factors, it is presumed to have higher priority. Similarly, the value of ( Di − Ri ) is called relation and indicates the prioritization of factors. A higher value of ( Di − Ri ) means that this factor has a stronger influence on other factors than the influence it receives from them and it is assumed to have the lower priority (Li and Tzeng, 2009; Wu, 2011). 3.2.2 Weight measurements by integrating DEMATEL and ANP Originally, the first step of the ANP is to compare the criteria in whole system to form the super-matrix. According to Satty (1980, 1996), this is done through pairwise comparisons by asking “How much importance/influence does a criterion have compared to another criterion with respect to our interests or preferences? The relative importance value can be determined using a scale of 1 to 9 to represent equal importance extreme importance. The general form of the super-matrix can be described as follows:. 19 .
(27) . c. 1 e11 L e1m1. e11. c1 e12M c W=. e1m1 e21 e22 2 M e2 m 2. M en1. c 2 enM2 enmn. ⎡W11 ⎢ ⎢ ⎢W 21 ⎢ ⎢ ⎢ ⎢ ⎢ M ⎢ ⎢ ⎢W n1 ⎢ ⎣. c. 2 e21 L e2 n2. L. c. n en1 L enmn. W12. L. W1n. W 22. L. W2n. M. O. M. Wn2. L. W nn. ⎤ ⎥ ⎥ ⎥ ⎥ ⎥ ⎥ ⎥ ⎥ ⎥ ⎥ ⎥ ⎥ ⎦. (8). where cn denotes the nth cluster, enm denotes the mth element in nth cluster, and W ij is the principal eigenvector of the influence of the elements compared in the jth. cluster to the ith cluster. In addition, if the jth cluster has no influence to the ith cluster, then Wij = [0]. Ou Yang et al. (2008) indicate that ANP method confirms the importance and influence of factors through questionnaires. The dynamic influence relationship implied in the total influence matrix acquired by DEMATEL is similar to the concept of ANP. Because the influence degrees between factors in the total influence matrix Tα are different, all factors of the total-influence matrix Tα should be normalized.. The normalized total-influence matrix Ts is represented as follows: ⎡t11α L t1αj ⎢ M ⎢M α ⎢ Tα = ti1 L tijα ⎢ M ⎢M ⎢t α L t α nj ⎣ n1 ⎡ t11α / d 1 ⎢ ⎢ M Ts = ⎢ t iα1 / d i ⎢ ⎢ M ⎢t α / d ⎣ n1 n. L t1αn ⎤ ⎥ M⎥ L tinα ⎥ d i = ⎥ M⎥ α ⎥ L t nn ⎦. L t1αj / d 1 M t ijα / d i M α L t nj / d n L. n. ∑ tα j =1. (9). ij. t1αn / d1 ⎤ ⎡ t11s ⎥ ⎢ M ⎥ ⎢M L t inα / d i ⎥ = ⎢ t is1 ⎥ ⎢ M ⎥ ⎢M α L t nn / d n ⎥⎦ ⎢⎣t ns1. L. where t ijs = t ijα / d i 20 . L t1s j M L t ijs M L t njs. L t1sn ⎤ ⎥ M ⎥ L t ins ⎥ ⎥ M ⎥ s ⎥ L t nn ⎦. (10).
(28) . Furthermore, the weighted super-matrix W w such as formula (11) can be calculated by multiplying the unweighted super-matrix W and the normalized total-influence matrix Ts . That is Ww = Ts × W . ⎡t11s ×W11 L tis1 ×Wi1 L tns1 ×Wn1 ⎤ ⎢ ⎥ M M ⎥ ⎢ M Ww = ⎢t1sj ×W1 j L tijs ×Wij L tnjs ×Wnj ⎥ ⎢ ⎥ M M ⎥ ⎢ M ⎢t s ×W L t s ×W L t s ×W ⎥ 1n in un nn nn ⎦ ⎣ 1n. (11). Finally, the weighted super-matrix can be raised to limiting powers such as formula (12) until it has converged and become a long-term stable super-matrix to obtain the global priority vectors or called the DANP weights (Ou Yang et al., 2008).. lim W. k. (12). k →∞. 3.2.3 Screening the factors from past literature and experts opinions This research classifies four perspectives by the balanced scorecard to explore the performance of banking in Taiwan. The four perspectives, namely financial, customer, internal business process, and learning and growth, follow from Kaplan and Norton (1992). The factors in each perspective are concluded from past literature and interview with experts. Besides of selected factors from past literature, there were interviews with two officials of banking bureau and three university professors. After interviewing with experts, the additional potential factors are collected and rearranged opinions from interview records as (1) Capital adequacy - It is put into place to ensure that institutions of banks do not take on excess leverage and become insolvent; (2) Internal control system - It helps to ensure that the bank complies with laws and regulations as well as internal rules and procedures, policies, plans, and decrease the 21 .
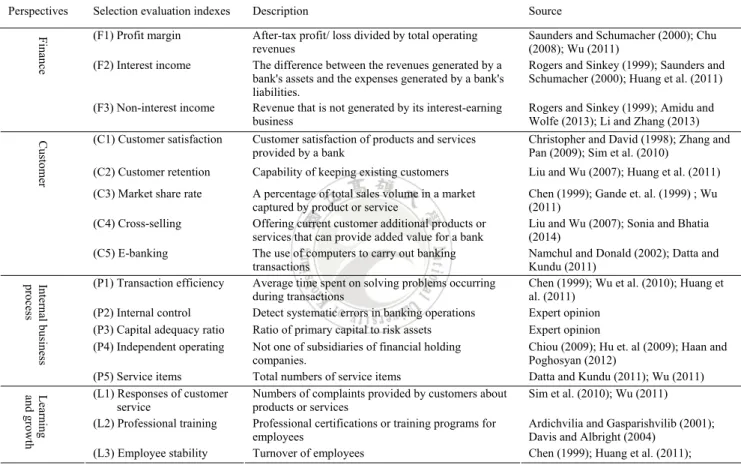
(29) . risk of unexpected losses. The sixteen evaluation factors are grouped into the four BSC dimensions, F: Finance (F1–F3), C: Customer (C1–C5), P: Internal Process (P1–P5), and L: Learning and Growth (L1–L3). The descriptions of the factors for the selection evaluation of banking performance are listed as table 3.2. Table 3.2 Descriptions of the selection evaluation factors for banking performance Perspectives Finance. Selection evaluation indexes. Description. Source. (F1) Profit margin. After-tax profit/ loss divided by total operating revenues The difference between the revenues generated by a bank's assets and the expenses generated by a bank's liabilities. Revenue that is not generated by its interest-earning business. Saunders and Schumacher (2000); Chu (2008); Wu (2011) Rogers and Sinkey (1999); Saunders and Schumacher (2000); Huang et al. (2011). (C1) Customer satisfaction. Customer satisfaction of products and services provided by a bank. Christopher and David (1998); Zhang and Pan (2009); Sim et al. (2010). (C2) Customer retention. Capability of keeping existing customers. Liu and Wu (2007); Huang et al. (2011). (C3) Market share rate. A percentage of total sales volume in a market captured by product or service Offering current customer additional products or services that can provide added value for a bank The use of computers to carry out banking transactions Average time spent on solving problems occurring during transactions Detect systematic errors in banking operations Ratio of primary capital to risk assets Not one of subsidiaries of financial holding companies. Total numbers of service items Numbers of complaints provided by customers about products or services Professional certifications or training programs for employees Turnover of employees. Chen (1999); Gande et. al. (1999) ; Wu (2011) Liu and Wu (2007); Sonia and Bhatia (2014) Namchul and Donald (2002); Datta and Kundu (2011) Chen (1999); Wu et al. (2010); Huang et al. (2011) Expert opinion Expert opinion Chiou (2009); Hu et. al (2009); Haan and Poghosyan (2012) Datta and Kundu (2011); Wu (2011) Sim et al. (2010); Wu (2011). (F2) Interest income (F3) Non-interest income. Customer. (C4) Cross-selling (C5) E-banking Internal business process. (P1) Transaction efficiency (P2) Internal control (P3) Capital adequacy ratio (P4) Independent operating. Learning and growth. (P5) Service items (L1) Responses of customer service (L2) Professional training (L3) Employee stability. Rogers and Sinkey (1999); Amidu and Wolfe (2013); Li and Zhang (2013). Ardichvilia and Gasparishvilib (2001); Davis and Albright (2004) Chen (1999); Huang et al. (2011);. 3.2.4 Data collection This research is applied and the DEMATEL and ANP methods combined and incorporated into the questionnaire design. Two pair-wise comparisons questionnaires are created for the data collection by interviewing with senior managers of banking institutions. One is created for collecting the cause-effect relationship among the four perspectives. The other is created for deriving the relative importance of each factor. The questionnaire employs a five point Likert scale that illustrates no impact, low 22 .
(30) . impact, medium impact, high impact, and very high impact, respectively. The examples of the two questionnaires are shown as table 3.3 and table 3.4. Table 3.3 presents an example of the questionnaire for conducting the DEMATEL. Each respondent was asked to evaluate the impact (i.e., the degree of controlling the decision-making process and the resource allocations) of a determinant on each of the other determinant using an integer scale (from 0 to 4). Table 3.3 shows that if Learning and growth has a low direct influence on Finance, then a score of “1” is given to represent this low influence. Conversely, if the Finance has a high direct influence on the Customer, a score of ‘‘3’’ is assigned. A high score represents the belief that an improvement in the Customer depends strongly on an improvement in the Finance.. Table 3.3 Comparison of the impact of the 4 perspectives Learning and growth. Finance. Internal business process. Customer. Financial. Perspectives. 3. Customer Internal business process Learning and growth. 1. Note: 0. No impact; 1. Low impact; 2. Medium impact; 3. High impact; 4. Very high impact. 23 .
(31) . Table 3.4 Comparison of the impact of the 16 determinants Profit margin. Interest income. Non-interest income. Customer satisfaction. Customer retention. Market share rate. Cross-selling. E-banking. Transaction efficiency. Internal control. Capital adequacy ratio. Independent operating. Service items. Responses of customer. service. Professional training. Employee stability. Determinants Employee stability Professional training Responses of customer service Service items Independent operating Capital adequacy ratio Internal control Transaction efficiency E-banking Cross-selling Market share rate Customer retention Customer satisfaction Non-interest income Interest income Profit margin. Note: 0. No impact; 1. Low impact; 2. Medium impact; 3. High impact; 4. Very high impact. The two questionnaires focus on the management of banks in Taiwan. The questionnaires aim at comparing paired results of the cause-effect relationship among the four perspectives and the importance of the factors.. 24 .
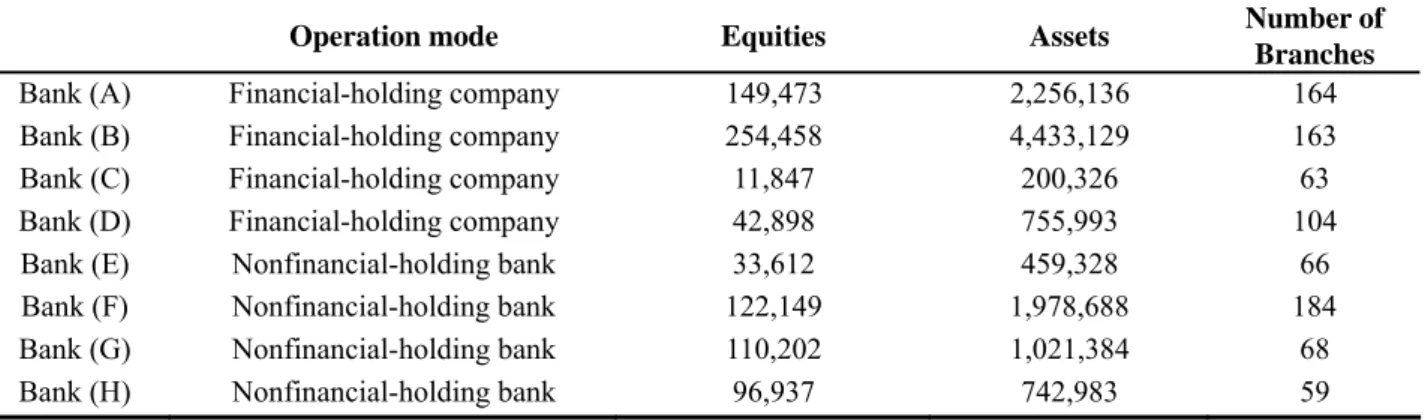
(32) . Chapter 4 Research Results In this research, the DANP model is proposed to confirm the interrelationship between each perspective and factor, and measure the relative importance of each factor. This chapter presents the results of banking performance in Taiwan. 4.1 Measuring relationships among perspectives Firstly, the respondents are focused on the managers of four financial holding companies and four nonfinancial holding banks. The basic information of eight banks and the profile of every respondent are shown as Table 4.1 and Table 4.2, respectively. Then, the DEMATEL questionnaires were asked to inquire about the direct influence among the four perspectives and selected factors. Eight questionnaires are collected after interviewing eight senior managers. Each questionnaire maps into a matrix according to the four perspectives of the balance scorecard. Then, the initial direct influence matrix A of the four perspectives for banking performance can be obtained by averaging all eight matrix by formula (2). The initial direct influence matrix A is shown as in Table 4.3.. Table 4.1 The basic information of eight banks (2015) Bank (A) Bank (B) Bank (C) Bank (D) Bank (E) Bank (F) Bank (G) Bank (H). Operation mode. Equities. Assets. Financial-holding company Financial-holding company Financial-holding company Financial-holding company Nonfinancial-holding bank Nonfinancial-holding bank Nonfinancial-holding bank Nonfinancial-holding bank. 149,473 254,458 11,847 42,898 33,612 122,149 110,202 96,937. 2,256,136 4,433,129 200,326 755,993 459,328 1,978,688 1,021,384 742,983. 25 . Number of Branches 164 163 63 104 66 184 68 59.
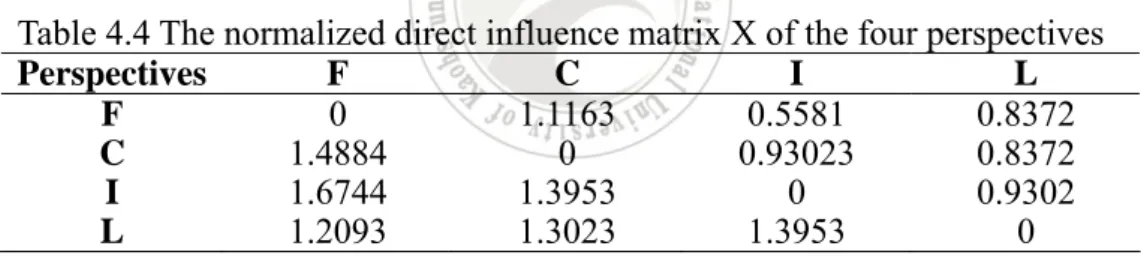
(33) . Table 4.2The profile of respondents in eight banks Operation mode Financial-holding company Financial-holding company Financial-holding company Financial-holding company Nonfinancial-holding bank Nonfinancial-holding bank Nonfinancial-holding bank Nonfinancial-holding bank. Bank (A) Bank (B) Bank (C) Bank (D) Bank (E) Bank (F) Bank (G) Bank (H). Position Senior Manager Senior Manager Senior Manager Manager Senior Manager Senior Manager Senior Manager Manager. Seniority (yrs) over 20 years over 20 years over 20 years 10 – 15 years over 20 years over 20 years over 20 years 5 – 10 years. Table 4.3 The initial direct influence matrix A of the four perspectives Perspectives F C I L F 0 2 1 1.5 C 2.6667 0 1.6667 1.5 I 3 2.5 0 1.6667 L 2.1667 2.3333 2.5 0 The normalized direct influence matrix X and the total influence matrix T can be calculated by formula (3) and formula (5), respectively, shown as Table 4.4. and Table 4.5. Table 4.4 The normalized direct influence matrix X of the four perspectives Perspectives F C I L F 0 1.1163 0.5581 0.8372 C 1.4884 0 0.93023 0.8372 I 1.6744 1.3953 0 0.9302 L 1.2093 1.3023 1.3953 0 Table 4.5 The total influence matrix T of the four perspectives Perspectives F C I F 0.919 1.081 0.706 C 1.169 0.831 0.706 I 1.61 1.39 0.765 L 1.566 1.434 1.059. L 0.618 0.618 0.794 0.676. Adopts formula (6) and formula(7), the gives and received influences of the four perspectives are calculated based on matrix T , and presented in Table 4.6. Table 4.6 The gives and received influences of the four perspectives Perspectives Di Ri ( Di + Ri ) ( Di − Ri ) Finance 3.324 5.264 8.588 -1.94 Customer 3.324 4.736 8.06 -1.412 Internal business process 4.559 3.236 7.795 1.323 Learning and growth 4.735 2.706 7.441 2.029 26 .
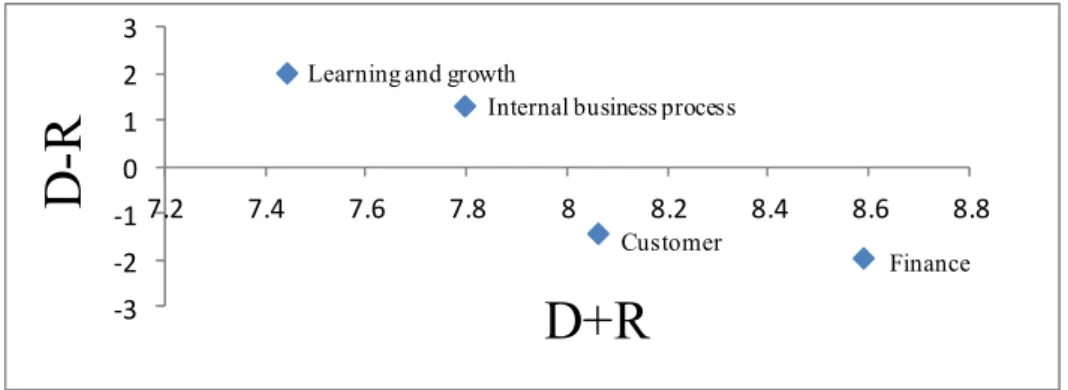
(34) . 4.1.1 The ranking of ( Di + Ri ) and ( D i - R i ) Perspectives which have higher values of ( Di + Ri ) present stronger relationships with the other perspectives; others have lower values of ( Di + Ri ) present weaker relationships with the other perspectives. Perspectives which have positive values of ( Di − Ri ) are called dispatchers that influence the other perspectives strongly; others have negative values of ( Di − Ri ) are called receivers that influenced by the other perspectives. From Table 4.4, it can be observed that the rank of ( Di + Ri )is “Finance (8.588)”, “Customer (8.06)”, “Internal business process (7.795)”, and “Learning and growth”; the rank of ( Di − Ri ) is “Learning and growth (2.029)”, “Internal business process (1.323)”, “Customer (-1.412)”, and “Finance (-1.94)”, respectively. The results reveal that finance perspective with the highest ( Di + Ri ) value presents the most relationship with the other perspectives and is located in the central role. The learning and growth perspective with the highest ( Di − Ri ) value shows the strongest influence on the other perspectives and plays the main cause factor among the perspectives; whereas, the finance perspective with the lowest ( Di − Ri ) value receives the strongest influence from the other perspectives and is called the main effect factor among the perspectives. In other words, the learning and growth perspective is the most important influencing source and the finance perspective is has strongest effected by the other perspectives. 4.1.2 The causal diagram According to Table 4.6, the causal diagram of the total influence is depicted as Fig.4.1. The learning and growth perspective with the highest positive values of ( Di − Ri ) shows that it has the most affecting power in four perspectives. Therefore, the learning and growth perspective should be considered as a priority for 27 .
(35) . improvement in banking performance. Kaplan and Norton (2004) indicate that learning and growth perspective is important if organizations want to have sustainable operation and development. Organization must build to create long-term improvement for customers and internal business processes using existing capabilities and align organizational procedures and routines. Davis and Albright (2004) also concludes that in learning and growth perspective, business can enhance employee's ability to recognize customer needs, cross-sells, referrals, and customer service by training employees. On the other hand, the finance perspective presents the strongest relationship with the other perspectives from Fig 4.1. Under the environment of fierce competition, it's important for commercial banks to manage operating performance and maximize profit in banking industry. In the Balanced Scorecard, financial measuring is the core of performance evaluation for four perspectives, especially in the profit-pursuing world. The other perspectives also enable organization to achieve long-term improvement and to enhance financial performance. 3 Learning and growth Internal business process. D-R. 2 1 0 ‐1 7.2. 7.4. 7.6. 7.8. 8. 8.2 Customer. ‐2. 8.4. 8.6. 8.8 Finance. D+R. ‐3. Fig. 4.1 Causal diagram of total relationship. 4.1.3 A strategy map of banking A strategy map can be constructed from Table 4.6 and shown as Fig. 4.2. A threshold value should be decided to eliminate trivial relations which are derived from DEMATEL analysis when strategy map established (Liou et al., 2008). In this 28 .
(36) . research, the threshold value is computed from the elements of matrix T by. ∑t. ij. /16 = 0.9964. Furthermore, the second quartile (0.875) and third quartile (1.169) are set as a. standard to separate weak and strong influence from perspectives. In Fig. 4.2, the dotted lines indicate weak influence between perspectives whereas the bold solid lines denote strong influence. For banking performance, it can be observed from Fig. 4.2 that the learning and growth perspective is the main cause factor which has a stronger influence on the other perspectives, while the finance perspective is the main effect factor which is influenced more by the other perspectives.. Finance 1.081 . 1.169 1.61 . Customer 1.566 . 1.39 . Internal business process. 1.434 . 1.059. Learning and growth Fig. 4.2 A strategy map of the four perspectives for banking (Threshold: 0.9964; Weak. 0.875~ 1.169; Strong. 1.1.169~ 1.61). 4.2 Weight measuring among factors The weights of factors that affect banking performance are derived by using the combined DEMATEL with ANP. As mentioned previously, the initial direct influence matrix A of the 16 selected factors can be obtained by formula (2) and itis shown as 29 .
(37) . Table 4.7. The normalized direct influence matrix X of the 16 selected factors and the total influence matrix T of the 16 selected factors can be computed by formula (3) and formula (5), respectively, presented as Table 4.8 and Table 4.9.. Table 4.7 The initial direct influence matrix A of the 16 selected factors F1. F1 0.000. F2 1.167. F3 1.000. C1 1.000. C2 1.000. C3 1.000. C4 1.000. C5 1.000. I1 1.000. I2 1.000. I3 1.000. I4 1.167. I5 1.000. L1 1.000. L2 1.000. L3 1.000. F2. 2.500. 0.000. 1.000. 1.167. 1.000. 1.000. 1.000. 1.000. 1.000. 1.000. 1.000. 1.000. 1.000. 1.000. 1.000. 1.000. F3. 3.500. 2.500. 0.000. 1.167. 1.167. 1.333. 1.167. 1.167. 1.167. 1.000. 1.000. 1.167. 1.000. 1.000. 1.000. 1.000. C1. 3.167. 2.833. 3.500. 0.000. 1.667. 1.500. 1.500. 1.333. 1.500. 1.000. 1.000. 1.000. 1.500. 1.500. 1.500. 1.500. C2. 3.333. 2.833. 3.500. 3.167. 0.000. 1.833. 1.833. 1.333. 1.333. 1.333. 1.500. 1.500. 1.833. 1.500. 1.500. 1.667. C3. 2.833. 3.000. 3.333. 2.833. 2.333. 0.000. 1.167. 1.167. 1.000. 1.000. 1.000. 1.667. 1.167. 1.167. 1.167. 1.167. C4. 3.333. 3.000. 3.000. 2.667. 2.167. 3.333. 0.000. 1.167. 1.333. 1.667. 1.500. 2.333. 1.667. 1.333. 1.500. 1.333. C5. 3.000. 2.333. 3.167. 2.500. 2.667. 3.000. 2.333. 0.000. 2.000. 1.333. 1.333. 1.500. 1.833. 1.500. 1.500. 1.167. I1. 2.833. 3.167. 3.167. 2.833. 2.667. 3.167. 2.333. 2.000. 0.000. 1.167. 1.000. 1.000. 1.667. 1.500. 1.167. 1.167. I2. 2.667. 2.667. 2.833. 2.500. 2.167. 2.167. 2.167. 2.000. 3.167. 0.000. 2.000. 1.833. 2.167. 2.000. 1.667. 1.833. I3. 3.000. 2.667. 2.667. 2.000. 1.667. 2.167. 1.667. 1.333. 1.667. 1.833. 0.000. 2.000. 1.500. 1.500. 1.333. 1.167. I4. 2.500. 1.667. 2.167. 1.833. 1.833. 2.000. 1.833. 1.500. 2.500. 1.500. 1.500. 0.000. 1.667. 1.500. 1.500. 1.500. I5. 2.667. 3.000. 3.333. 2.833. 2.833. 3.333. 2.333. 2.167. 2.167. 1.333. 1.167. 2.333. 0.000. 1.500. 1.333. 1.333. L1. 2.667. 3.167. 3.333. 3.333. 2.833. 3.333. 2.667. 2.167. 2.500. 1.333. 1.167. 2.333. 2.833. 0.000. 2.000. 2.167. L2. 3.333. 3.167. 3.167. 2.833. 2.833. 3.000. 2.500. 1.667. 3.167. 2.333. 1.167. 2.000. 3.000. 2.167. 0.000. 1.333. L3. 3.333. 3.500. 3.333. 3.167. 2.667. 3.000. 2.500. 1.333. 3.000. 2.000. 1.000. 2.000. 2.667. 2.167. 2.833. 0.000. .. Table 4.8 The normalized direct influence matrix X of the 16 selected factors F1. F1 0.000. F2 1.217. F3 1.043. C1 1.043. C2 1.043. C3 1.043. C4 1.043. C5 1.043. I1 1.043. I2 1.043. I3 1.043. I4 1.217. I5 1.043. L1 1.043. L2 1.043. L3 1.043. F2. 2.400. 0.000. 0.960. 1.120. 0.960. 0.960. 0.960. 0.960. 0.960. 0.960. 0.960. 0.960. 0.960. 0.960. 0.960. 0.960. F3. 2.754. 1.967. 0.000. 0.918. 0.918. 1.049. 0.918. 0.918. 0.918. 0.787. 0.787. 0.918. 0.787. 0.787. 0.787. 0.787. C1. 1.949. 1.744. 2.154. 0.000. 1.026. 0.923. 0.923. 0.821. 0.923. 0.615. 0.615. 0.615. 0.923. 0.923. 0.923. 0.923. C2. 1.778. 1.511. 1.867. 1.689. 0.000. 0.978. 0.978. 0.711. 0.711. 0.711. 0.800. 0.800. 0.978. 0.800. 0.800. 0.889. C3. 1.744. 1.846. 2.051. 1.744. 1.436. 0.000. 0.718. 0.718. 0.615. 0.615. 0.615. 1.026. 0.718. 0.718. 0.718. 0.718. C4. 1.702. 1.532. 1.532. 1.362. 1.106. 1.702. 0.000. 0.596. 0.681. 0.851. 0.766. 1.191. 0.851. 0.681. 0.766. 0.681. C5. 1.540. 1.198. 1.626. 1.283. 1.369. 1.540. 1.198. 0.000. 1.027. 0.684. 0.684. 0.770. 0.941. 0.770. 0.770. 0.599. I1. 1.470. 1.643. 1.643. 1.470. 1.384. 1.643. 1.211. 1.038. 0.000. 0.605. 0.519. 0.519. 0.865. 0.778. 0.605. 0.605. I2. 1.261. 1.261. 1.340. 1.182. 1.025. 1.025. 1.025. 0.946. 1.498. 0.000. 0.946. 0.867. 1.025. 0.946. 0.788. 0.867. I3. 1.704. 1.515. 1.515. 1.136. 0.947. 1.231. 0.947. 0.757. 0.947. 1.041. 0.000. 1.136. 0.852. 0.852. 0.757. 0.663. I4. 1.481. 0.988. 1.284. 1.086. 1.086. 1.185. 1.086. 0.889. 1.481. 0.889. 0.889. 0.000. 0.988. 0.889. 0.889. 0.889. I5. 1.267. 1.426. 1.584. 1.347. 1.347. 1.584. 1.109. 1.030. 1.030. 0.634. 0.554. 1.109. 0.000. 0.713. 0.634. 0.634. L1. 1.128. 1.339. 1.410. 1.410. 1.198. 1.410. 1.128. 0.916. 1.057. 0.564. 0.493. 0.987. 1.198. 0.000. 0.846. 0.916. L2. 1.416. 1.345. 1.345. 1.204. 1.204. 1.274. 1.062. 0.708. 1.345. 0.991. 0.496. 0.850. 1.274. 0.920. 0.000. 0.566. L3. 1.385. 1.455. 1.385. 1.316. 1.108. 1.247. 1.039. 0.554. 1.247. 0.831. 0.416. 0.831. 1.108. 0.900. 1.177. 0.000. 30 .
(38) . Table 4.9 The total influence matrix T of the 16 selected factors F1. F2. F3. C1. C2. C3. C4. C5. I1. I2. I3. I4. I5. L1. L2. L3. F1. 0.154. 0.164. 0.184. 0.156. 0.144. 0.146. 0.134. 0.107. 0.126. 0.111. 0.107. 0.119. 0.118. 0.107. 0.111. 0.111. F2. 0.228. 0.135. 0.19. 0.161. 0.149. 0.151. 0.139. 0.111. 0.13. 0.114. 0.111. 0.123. 0.122. 0.111. 0.114. 0.114. F3. 0.276. 0.215. 0.169. 0.172. 0.159. 0.162. 0.148. 0.118. 0.139. 0.122. 0.118. 0.132. 0.13. 0.118. 0.122. 0.122. C1. 0.255. 0.224. 0.277. 0.144. 0.165. 0.168. 0.154. 0.122. 0.145. 0.127. 0.122. 0.137. 0.135. 0.122. 0.127. 0.127. C2. 0.264. 0.231. 0.287. 0.218. 0.136. 0.174. 0.159. 0.127. 0.149. 0.131. 0.127. 0.141. 0.14. 0.127. 0.131. 0.131. C3. 0.264. 0.232. 0.256. 0.22. 0.204. 0.14. 0.159. 0.127. 0.15. 0.132. 0.127. 0.142. 0.14. 0.127. 0.132. 0.131. C4. 0.321. 0.252. 0.28. 0.239. 0.222. 0.224. 0.14. 0.139. 0.165. 0.144. 0.139. 0.189. 0.154. 0.139. 0.144. 0.144. C5. 0.284. 0.249. 0.275. 0.236. 0.219. 0.221. 0.204. 0.102. 0.161. 0.141. 0.136. 0.153. 0.151. 0.136. 0.141. 0.141. I1. 0.284. 0.249. 0.275. 0.236. 0.219. 0.221. 0.204. 0.136. 0.126. 0.141. 0.136. 0.153. 0.151. 0.136. 0.141. 0.141. I2. 0.294. 0.257. 0.284. 0.244. 0.226. 0.229. 0.211. 0.141. 0.2. 0.111. 0.141. 0.158. 0.156. 0.141. 0.146. 0.146. I3. 0.264. 0.232. 0.255. 0.22. 0.172. 0.207. 0.159. 0.127. 0.15. 0.132. 0.093. 0.142. 0.14. 0.127. 0.132. 0.131. I4. 0.248. 0.186. 0.24. 0.176. 0.162. 0.165. 0.151. 0.119. 0.174. 0.124. 0.119. 0.099. 0.132. 0.119. 0.124. 0.123. I5. 0.311. 0.27. 0.332. 0.255. 0.237. 0.272. 0.22. 0.149. 0.177. 0.154. 0.149. 0.2. 0.13. 0.149. 0.154. 0.154. L1. 0.343. 0.298. 0.366. 0.313. 0.26. 0.264. 0.242. 0.164. 0.229. 0.17. 0.164. 0.218. 0.216. 0.129. 0.171. 0.203. L2. 0.354. 0.281. 0.312. 0.266. 0.247. 0.251. 0.231. 0.155. 0.217. 0.193. 0.155. 0.175. 0.204. 0.155. 0.126. 0.16. L3. 0.326. 0.284. 0.347. 0.268. 0.249. 0.252. 0.232. 0.155. 0.218. 0.162. 0.155. 0.176. 0.206. 0.155. 0.194. 0.126. The dynamic influence relationship between factors can be gained by constructing its degree of importance in unweighted super matrix that is counted by formula (8) of the 16 selected factors. Furthermore, the weighted super-matrix Ww is calculated by multiplying the unweighted super-matrix W and the normalized total-influence matrix T with formula (11) can be established based on the degree of influence of each dimension. The limiting super matrix is used to derive the weight of each factor by formula (12), as illustrated in Table 4.12.. Table 4.10 The unweighted super matrix of the 16 selected factors 31 .
(39) . F1. F1 0.069. F2 0.106. F3 0.119. C1 0.115. C2 0.112. C3 0.098. C4 0.105. C5 0.105. I1 0.094. I2 0.091. I3 0.111. I4 0.101. I5 0.092. L1 0.088. L2 0.096. L3 0.096. F2. 0.083. 0.062. 0.096. 0.092. 0.090. 0.104. 0.098. 0.086. 0.098. 0.085. 0.090. 0.079. 0.096. 0.091. 0.091. 0.090. F3. 0.088. 0.086. 0.065. 0.112. 0.108. 0.108. 0.102. 0.102. 0.102. 0.089. 0.094. 0.099. 0.100. 0.096. 0.095. 0.094. C1. 0.071. 0.070. 0.068. 0.050. 0.092. 0.079. 0.074. 0.074. 0.074. 0.073. 0.078. 0.067. 0.072. 0.079. 0.069. 0.078. C2. 0.064. 0.063. 0.060. 0.058. 0.042. 0.071. 0.067. 0.067. 0.067. 0.065. 0.057. 0.060. 0.065. 0.062. 0.062. 0.061. C3. 0.076. 0.074. 0.071. 0.069. 0.067. 0.052. 0.089. 0.089. 0.089. 0.077. 0.082. 0.087. 0.087. 0.083. 0.082. 0.081. C4. 0.060. 0.059. 0.057. 0.055. 0.053. 0.053. 0.038. 0.063. 0.063. 0.061. 0.053. 0.056. 0.061. 0.058. 0.058. 0.057. C5. 0.055. 0.054. 0.052. 0.051. 0.049. 0.049. 0.047. 0.034. 0.058. 0.057. 0.049. 0.051. 0.057. 0.054. 0.045. 0.044. I1. 0.064. 0.063. 0.060. 0.059. 0.057. 0.057. 0.054. 0.066. 0.042. 0.075. 0.057. 0.075. 0.064. 0.062. 0.071. 0.070. I2. 0.052. 0.051. 0.049. 0.047. 0.046. 0.046. 0.044. 0.044. 0.044. 0.031. 0.046. 0.048. 0.043. 0.041. 0.050. 0.050. I3. 0.050. 0.049. 0.047. 0.046. 0.044. 0.045. 0.043. 0.042. 0.042. 0.052. 0.030. 0.047. 0.041. 0.040. 0.040. 0.039. I4. 0.058. 0.057. 0.055. 0.053. 0.052. 0.051. 0.061. 0.049. 0.049. 0.049. 0.066. 0.037. 0.059. 0.057. 0.056. 0.056. I5. 0.056. 0.055. 0.053. 0.051. 0.050. 0.050. 0.047. 0.047. 0.047. 0.057. 0.050. 0.052. 0.035. 0.055. 0.063. 0.054. L1. 0.053. 0.052. 0.050. 0.048. 0.047. 0.047. 0.045. 0.045. 0.045. 0.054. 0.047. 0.049. 0.044. 0.033. 0.052. 0.051. L2. 0.052. 0.051. 0.049. 0.047. 0.046. 0.046. 0.044. 0.044. 0.044. 0.042. 0.046. 0.048. 0.043. 0.051. 0.031. 0.050. L3. 0.050. 0.049. 0.047. 0.046. 0.044. 0.045. 0.043. 0.042. 0.042. 0.041. 0.045. 0.047. 0.041. 0.049. 0.040. 0.030. Table 4.11 The weighted super matrix of the 16 selected factors F1. F1 0.073. F2 0.103. F3 0.114. C1 0.100. C2 0.099. C3 0.098. C4 0.106. C5 0.096. I1 0.096. I2 0.095. I3 0.098. I4 0.101. I5 0.094. L1 0.091. L2 0.102. L3 0.093. F2. 0.078. 0.061. 0.089. 0.088. 0.086. 0.086. 0.083. 0.084. 0.084. 0.083. 0.086. 0.076. 0.081. 0.079. 0.081. 0.081. F3. 0.088. 0.086. 0.070. 0.109. 0.107. 0.095. 0.092. 0.093. 0.093. 0.092. 0.095. 0.098. 0.100. 0.098. 0.090. 0.099. C1. 0.074. 0.073. 0.071. 0.056. 0.082. 0.082. 0.079. 0.080. 0.080. 0.079. 0.082. 0.072. 0.077. 0.083. 0.076. 0.076. C2. 0.069. 0.068. 0.066. 0.065. 0.051. 0.076. 0.073. 0.074. 0.074. 0.073. 0.064. 0.066. 0.072. 0.069. 0.071. 0.071. C3. 0.070. 0.069. 0.067. 0.066. 0.065. 0.052. 0.074. 0.075. 0.075. 0.074. 0.077. 0.067. 0.082. 0.070. 0.072. 0.072. C4. 0.064. 0.063. 0.061. 0.060. 0.059. 0.059. 0.046. 0.069. 0.069. 0.068. 0.059. 0.061. 0.066. 0.065. 0.066. 0.066. C5. 0.051. 0.050. 0.049. 0.048. 0.048. 0.047. 0.046. 0.035. 0.046. 0.046. 0.047. 0.048. 0.045. 0.044. 0.045. 0.044. I1. 0.060. 0.059. 0.057. 0.057. 0.056. 0.056. 0.054. 0.055. 0.043. 0.065. 0.056. 0.071. 0.053. 0.061. 0.062. 0.062. I2. 0.053. 0.052. 0.050. 0.050. 0.049. 0.049. 0.047. 0.048. 0.048. 0.036. 0.049. 0.050. 0.046. 0.045. 0.055. 0.046. I3. 0.051. 0.050. 0.049. 0.048. 0.048. 0.047. 0.046. 0.046. 0.046. 0.046. 0.035. 0.048. 0.045. 0.044. 0.045. 0.044. I4. 0.057. 0.056. 0.055. 0.054. 0.053. 0.053. 0.062. 0.052. 0.052. 0.051. 0.053. 0.040. 0.060. 0.058. 0.050. 0.050. I5. 0.056. 0.055. 0.054. 0.053. 0.052. 0.052. 0.051. 0.051. 0.051. 0.051. 0.052. 0.054. 0.039. 0.058. 0.059. 0.059. L1. 0.051. 0.050. 0.049. 0.048. 0.048. 0.047. 0.046. 0.046. 0.046. 0.046. 0.047. 0.048. 0.045. 0.034. 0.045. 0.044. L2. 0.053. 0.052. 0.050. 0.050. 0.049. 0.049. 0.047. 0.048. 0.048. 0.047. 0.049. 0.050. 0.046. 0.046. 0.036. 0.055. L3. 0.053. 0.052. 0.050. 0.050. 0.049. 0.049. 0.047. 0.048. 0.048. 0.047. 0.049. 0.050. 0.046. 0.054. 0.046. 0.036. Table 4.12 The limiting super matrix of the 16 selected factors F1. F2. F3. C1. C2. C3. C4. C5. I1. I2. I3. I4. I5. L1. L2. L3. F1. 0.098. 0.098. 0.098. 0.098. 0.098. 0.098. 0.098. 0.098. 0.098. 0.098. 0.098. 0.098. 0.098. 0.098. 0.098. 0.098. F2. 0.082. 0.082. 0.082. 0.082. 0.082. 0.082. 0.082. 0.082. 0.082. 0.082. 0.082. 0.082. 0.082. 0.082. 0.082. 0.082. F3. 0.093. 0.093. 0.093. 0.093. 0.093. 0.093. 0.093. 0.093. 0.093. 0.093. 0.093. 0.093. 0.093. 0.093. 0.093. 0.093. C1. 0.076. 0.076. 0.076. 0.076. 0.076. 0.076. 0.076. 0.076. 0.076. 0.076. 0.076. 0.076. 0.076. 0.076. 0.076. 0.076. C2. 0.068. 0.068. 0.068. 0.068. 0.068. 0.068. 0.068. 0.068. 0.068. 0.068. 0.068. 0.068. 0.068. 0.068. 0.068. 0.068. C3. 0.070. 0.070. 0.070. 0.070. 0.070. 0.070. 0.070. 0.070. 0.070. 0.070. 0.070. 0.070. 0.070. 0.070. 0.070. 0.070. C4. 0.062. 0.062. 0.062. 0.062. 0.062. 0.062. 0.062. 0.062. 0.062. 0.062. 0.062. 0.062. 0.062. 0.062. 0.062. 0.062. C5. 0.047. 0.047. 0.047. 0.047. 0.047. 0.047. 0.047. 0.047. 0.047. 0.047. 0.047. 0.047. 0.047. 0.047. 0.047. 0.047. I1. 0.058. 0.058. 0.058. 0.058. 0.058. 0.058. 0.058. 0.058. 0.058. 0.058. 0.058. 0.058. 0.058. 0.058. 0.058. 0.058. I2. 0.049. 0.049. 0.049. 0.049. 0.049. 0.049. 0.049. 0.049. 0.049. 0.049. 0.049. 0.049. 0.049. 0.049. 0.049. 0.049. I3. 0.047. 0.047. 0.047. 0.047. 0.047. 0.047. 0.047. 0.047. 0.047. 0.047. 0.047. 0.047. 0.047. 0.047. 0.047. 0.047. I4. 0.054. 0.054. 0.054. 0.054. 0.054. 0.054. 0.054. 0.054. 0.054. 0.054. 0.054. 0.054. 0.054. 0.054. 0.054. 0.054. I5. 0.053. 0.053. 0.053. 0.053. 0.053. 0.053. 0.053. 0.053. 0.053. 0.053. 0.053. 0.053. 0.053. 0.053. 0.053. 0.053. L1. 0.047. 0.047. 0.047. 0.047. 0.047. 0.047. 0.047. 0.047. 0.047. 0.047. 0.047. 0.047. 0.047. 0.047. 0.047. 0.047. L2. 0.049. 0.049. 0.049. 0.049. 0.049. 0.049. 0.049. 0.049. 0.049. 0.049. 0.049. 0.049. 0.049. 0.049. 0.049. 0.049. L3. 0.049. 0.049. 0.049. 0.049. 0.049. 0.049. 0.049. 0.049. 0.049. 0.049. 0.049. 0.049. 0.049. 0.049. 0.049. 0.049. 32 .
(40) . 4.2.1 The ranking of the factors The local and the global weights of the factors which are devolved by ANP approach can be listed as Table 4.13. Through the limiting super matrix of ANP approach, we can obtain the global weight of each factor. Furthermore, the importance of factor under the same perspective is summed up to get the local weight of that perspective. The local weights present the importance that each factor in comparison to the other factor in the same perspective. The global weights help us to understand the overall absolute weights of individual factors. The purpose of weight measuring helps bank managers to determine the primary factors when they seek to improve banking performance. From Table 4.13 shows that among the sixteen factors, profit margin should be the most important factor with a weight of 0.098, followed by non-interest income at 0.093 and interest income at 0.082. Relative to other factors, capital adequacy ratio is the least important factor with a weight of 0.0467. The 4th and 5th are the customer satisfaction at 0.076 and market share rate at 0.07. In addition, according to the local weights, profit margin is the most important factor from the perspective of finance; customer satisfaction is the most important factor from the perspective of customer; transaction efficiency is the most important factor from the perspective of internal business process; professional training is the most important factor from the perspective of learning and growth. In sum, among the top five factors, there are three included under the perspective of finance and two under the perspective of customer. This result shows that maximizing profit and persuading the revenue growth in banking industry are considered as most prioritized for banking performance.. 33 .
數據

+7


相關文件
¾ For investment and holding companies, stock, commodity and bullion brokers, and miscellaneous financial services, manpower requirement is projected to increase from 62 500 in 2001
Income is generated from wages and salaries, interest, rent and profits. In a labour-intensive industry such as tourism, a large part of income comes from wages and salaries earned
– It allowed a commercial bank, investment bank, and insurance company to merge and form a financial holding company.. – To serve all their customers’ financial needs, bank
• 1999 年廢除 Glass-Steagal Act ,通過 Financi al Services Modernization Act 。. • 允許銀行、證券與保險等業務,以金融控股公司 (Financial Holding
由於本計畫之主要目的在於依據 ITeS 傳遞模式建構 IPTV 之服務品質評估量表,並藉由決
蔣松原,1998,應用 應用 應用 應用模糊理論 模糊理論 模糊理論
樹、與隨機森林等三種機器學習的分析方法,比較探討模型之預測效果,並獲得以隨機森林
則巢式 Logit 模型可簡化為多項 Logit 模型。在分析時,巢式 Logit 模型及 多項 Logit 模型皆可以分析多方案指標之聯合選擇,唯巢式 Logit
