Related Factors and Use of Free Preventive Health Services among Adults with
Intellectual Disabilities in Taiwan
Suh-May Yen 1, 2 Pei-Tseng Kung 3, # Li-Ting Chiu 1 Wen-Chen Tsai 1, #,*
1. Department of Health Services Administration, China Medical University, Taichung, Taiwan, R.O.C.
2. Department of Chinese Medicine, Nantou Hospital, Nantou, Taiwan, R.O.C.
3. Department of Healthcare Administration, Asia University, Taichung, Taiwan, R.O.C.
Suh-May Yen: [email protected] Pei-Tseng Kung: [email protected]
Li-Ting Chiu: [email protected] Wen-Chen Tsai: [email protected]
# Authors had equal contribution to this work.
*Correspondence author:Professor Wen-Chen Tsai
Address:No. 91 Hsueh-Shih Road, Taichung, Taiwan 40402, R.O.C Tel:886-4-22073070
Fax:886-4-22028895
E-mail: [email protected]
Abstract
Background: This study aimed to investigate the utilization of preventive health
services in the adults with intellectual disabilities from the nationwide database.
Methods: The research method of this study is secondary data analysis. The data was
obtained from three nationwide databases from 2006 to 2008. This study employed descriptive statistics to analyze the use and rate of preventive health services by intellectual disabled adults. Chi-square test was used to determine the relationship between the utilization of preventive health services and these variables. Multivariate logistic regression analysis was used to explore the factors that affect intellectual disabled adults’ use of preventive health services.
Results: Our findings indicated 16.65% of people with intellectual disabilities aged over 40 years used the preventive health services. Females were more frequent users than males (18.27% vs. 15.21%, p <0.001). The utilization rate decreased with
increasing severity of intellectual disabilities. The utilization was lowest (13.83%) for those with very severe disability, whereas that was the highest (19.38%) for those with mild severity. The factors significantly influencing utilization of the services included gender, age, and marital status, urbanization of resident areas, monthly payroll, low-income household status, catastrophic illnesses status and relevant chronic diseases and severity of disability.
Conclusions: Although Taiwan's Health Promotion Administration (HPA) has
provided free preventive health services for more than 15 years, people with
intellectual disabilities using preventive health care tend to be low. Demographics,
economic conditions, health status, relevant chronic diseases, environmental factor, and severity of disability are the main factors influencing the use of preventive healthcare. According to the present findings, it is recommended that the government should increase the reimbursement of the medical staff performing health
examinations for the persons with intellectual disabilities. It is also suggested to conduct media publicity and education to the public and the nursing facilities for the utilization of adult preventive health services.
Key Words: Intellectual disabilities; Disability; Preventive health service; Adult
health examination
Background
The global prevalence of intellectual disabilities was 10.37 per 1,000 populations [1]. In the end of 2011, there were 98,046 people with intellectual disabilities, accounting for 0.4% of the total population in Taiwan [2]. According to a survey conducted in 2006, 89.5% of people with intellectual disabilities in Taiwan lived with family members and 78.0% had no paid employment [3]. People with intellectual disabilities had a shorter life expectancy than did the general population [4, 5].
Standardized mortality ratios for adults with moderate or severe intellectual disabilities were 3 times higher than those for the general population [6].
A study in the Netherlands determined that people with intellectual disabilities had 2.5 times more health problems than did those without intellectual disabilities [7].
Numerous people with intellectual disabilities developed neurological, digestive, dermatological, and mental disorders, as well as obesity, diabetes, and cardiovascular disease [8-11]. People with intellectual disabilities might be unaware of physical problems and might have difficulty verbally expressing such conditions. Patients with intellectual disabilities are often rushed to hospitals for treatment when their physical conditions become severe. Therefore, people with intellectual disabilities must expend more time and effort in receiving medical care and may not be able to obtain required appropriate treatments [12-14].
Previous studies have demonstrated that the intellectually disabled persons were
less likely to receive preventive health services than the others [15-18]. For instance,
only 25% of women with learning disabilities in Exeter (a city in southwestern England) underwent cervical screening [19], and in Wales, only 31%–41% of people with learning disabilities received annual health assessments in 2006 and 2009 [20].
People with intellectual disabilities have substantial health needs, and have been reported to benefit from regular health assessments. A randomized controlled study conducted in Australia showed that people with intellectual disabilities who regularly received health assessments were newly diagnosed with diseases at a rate that was 1.6
times that of those who did not receive regular health assessments [21].
A study in the United States suggested that an increase in preventive services could avert the loss of more than 2 million life-years annually [22]. Increasing clinical preventive health services could effectively lower subsequent medical expenses [23–
26]. Previous studies have indicated that sex, marital status [27], educational level, age, income, health status, severity of disability, and urbanization level influence the
use of preventive health services among disabled people [28].
To reduce exorbitant medical expenses and improve unequal access to health
care, free preventive health services for adults have been promoted since 1995 in
Taiwan. The services include medical examinations, health education, blood, and
urine tests. All adults aged over 40 years are accessible to this free service. Frequency
limitations of this service varied according to different age ranges, i.e. once per three
years for the persons aged 40-64 years and once per year for those who aged over 65 years. The examination outcomes are reported to patients, and primary care
physicians suggest necessary additional diagnoses, treatments, or follow-ups. There were 21,042 adults with intellectual disabilities met the requirements in 2008. The purpose of this study was to explore of preventive health service utilization among these people and the factors associated with their use.
Methods
Data source and Participants
According to the Disabled Welfare Law (1980), local governments in Taiwan provide support such as social welfare, special education, and health care to people with intellectual disabilities. Intelligence quotient (IQ) scores are diagnosed based on an official test administered by a psychologist and certified by the government; the scores are then confirmed by a doctor accredited by the government. If the IQ score of a person is below 70 (more than 2 standard deviations below the mean), the person is identified as having intellectual disabilities. Local governments certify disabled residents and report cases to the central government, and the Ministry of the Interior maintains a registry of certified cases. Intellectual disabilities are categorized
according to four levels of severity, namely very severe (IQ: 5 standard deviations
below the mean), severe (IQ: 4–5 standard deviations below the mean), moderate (IQ:
3–4 standard deviations below the mean), and mild (IQ: 2–3 standard deviations
below the mean).
The study population was 21,042 people in Taiwan with intellectual disabilities, aged over 40 years, and registered with the Ministry of the Interior as of 2008
(Department of Statistics, 2008). Among them, 17.46%, 32.20%, 30.34%, and 20.00%
were diagnosed with mild, moderate, severe, and very severe levels of intellectual
disabilities, respectively.
The Health Promotion Administration (HPA) has provided free preventive health
services for adults in Taiwan since 1995 and maintains a dataset of records of adults
who have used such services. Since 1995, Taiwan has implemented the National
Health Insurance (NHI) program; 99.68% of the residents are enrolled in the NHI
program. The NHI program is a universal, comprehensive health insurance program
with a considerably low copayment. The NHI Administration holds all medical claims
data and publishes the National Health Insurance Research Dataset for academic
research annually. In this study, three data sources were used: the 2006–2008
preventive health service dataset obtained from the HPA, medical claims data from
the NHI Research Database provided by the Ministry of Health and Welfare, and
information on disabled people from the 2008 Registry of Disabled People obtained
from the Ministry of the Interior. The Statistics Center of the Department of Health, Taiwan, helped match the three datasets with personal identification numbers and provided a dataset that included that necessary information for this study. All personal identification information was deleted and personal privacy was protected. The institutional review board of China Medical University and Hospital approved this study (IRB No. CMU-REC-101-012).
Description of variables
Variables in this study included demographics (e.g., gender, age, marital status, educational level, and aborigine status, economic conditions (e.g., premium-based monthly payroll, low-income household status), health status (with or without a catastrophic illness/injury), chronic diseases (including mental disorders, musculoskeletal system and connective tissue diseases, neurological disorders, cancers, blood and blood-forming organs diseases, circulatory system diseases, respiratory diseases, endocrine and metabolic diseases, digestive diseases,
genitourinary system diseases, skin and subcutaneous tissue disease, diseases of eyes
and auxiliary organs, ear and mastoid diseases, infectious diseases, and congenital
malformations); environmental factors (i.e., urbanization of resident areas), severity
of disability (i.e., very severe, severe, moderate, and mild), and utilization of adult
preventive health services. Urbanization was categorized into eight levels. The first
level was the area with the highest level of urbanization, whereas the eighth level was
the region with the lowest level of urbanization. A low-income household was defined
as a household in which the average monthly income per person was below the lowest
living index, i.e., 60% of the living expenditure per person in the previous year in the
local area of the household [29].
Statistical Analysis
A statistics software package (SAS 9.2) was used for data analysis. Descriptive statistics was used to describe the percentages of demographic characteristics, economic status, health status, environmental factors, levels of intellectual disability, and the utilization of preventive health services for adults. Chi-square test was used to determine the relationship between the utilization of preventive health services and these variables. Multivariate logistic regression analysis was applied to explore the factors associated with the use of adult preventive health services among the persons with intellectual disabilities. The full model approach was applied in logistic
regression analysis. In this study, a p value of less than 0.05 was considered statistically significant.
Results
Basic characteristics of the participants
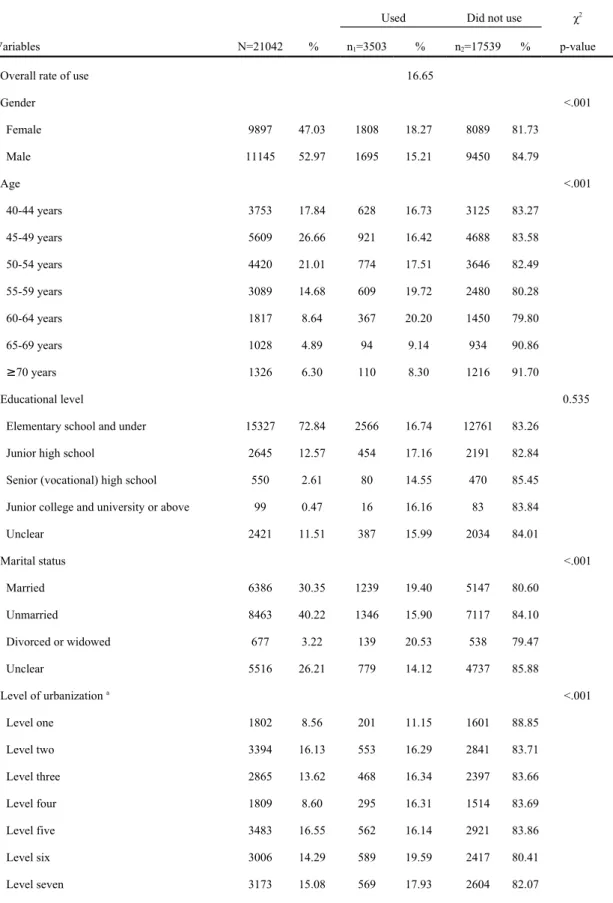
Among the 21,042 participants, males were the majority(52.97%, n =11,145)
(Table 1). Those aged 45-49 years were predominant (26.66%, n =5,609). Most of the participants had a educational level of elementary school or lower (72.84%, n
=15,327). Those with premium-based monthly payroll less than NT $15,840 (New Taiwan Dollars, NT$)(U.S. $ 1 = NT $ 30) accounted for the majority (51.69%, n
=10,877). Regarding the relevant chronic diseases, intellectual disability with
comorbid mental illness (26.44%) and circulatory system disease (23.93%) were
ranked in the first and second places, respectively. Those with moderate level of
severity of intellectual disabilities were predominant, accounting for 32.20% (n
=6,775).
The utilization of adult preventive health services among the participants
As presented in Table 1, 16.65% (n =3,503) of participants aged over 40 years used the adult preventive health services. Of them, more females (18.27%) used the services than males (15.21%, p <0.001). Those aged 60-64 years had the highest utilization (20.20%, p <0.001). According to the levels of urbanization, those living in the areas of 6 th level of urbanization had the highest utilization (19.59%) whereas those living in urbanization of first level(most urban) had the lowest utilization (11.15%) (p <0.001). The participants with any catastrophic illness/injury used more preventive health services than those without (23.72% vs. 15.68%, p <0.001). Among those with relevant comorbid diseases, those having the highest utilization rate were those with diseases of the ear and mastoid process (31.56%), followed by those with endocrine and metabolic disease (30.66%), and those with cancers had the lowest utilization rate (18.80%) compared to the others. The persons with more severe level of intellectual disability were the lower frequent users of services (p <0.001),
indicating that the lowest users were those with very severe level (13.83%) and those with highest utilization rate were the subgroup of mild level of disabilities (19.38%).
Factors influencing the utilization of adult preventive health services among participants
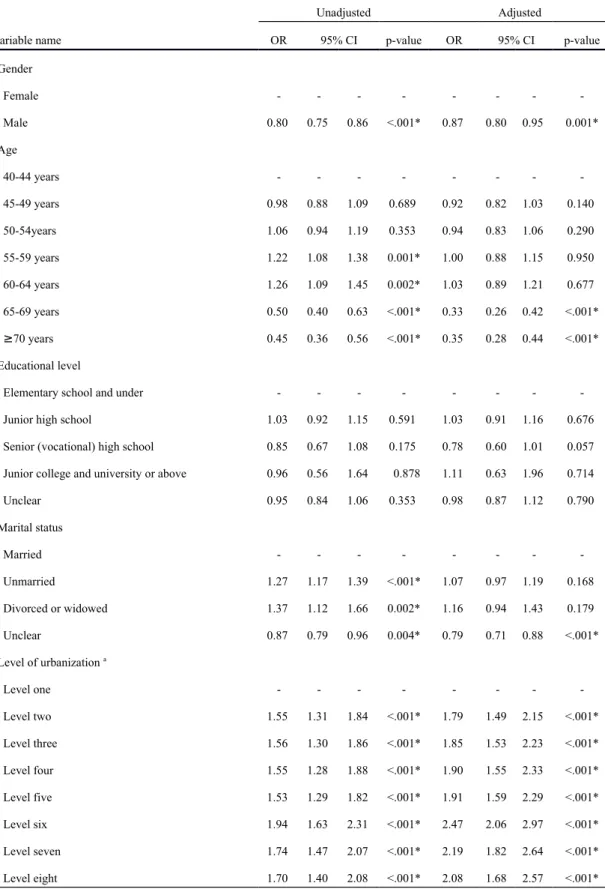
The results of analyzing variables associated with the utilization of adult preventive health services are shown in Table 2. The factors significantly influencing the
utilization included gender, age, marital status, urbanization of resident area, premium-based monthly payroll, low-income household status, catastrophic
illness/injury status, relevant chronic diseases, and severity of intellectual disabilities.
After controlling for other variables, males were 0.87 times less likely to use adult
preventive health services than females (OR = 0.87, 95% CI = 0.80-0.95). When those aged 40-44 years were used as a reference group, the groups aged 65-69 years or ≥ 70 years had significantly lower probabilities to use the services (OR = 0.35, 95% CI = 0.28-0.44; OR = 0.33, 95% CI = 0.26-0.42). Furthermore, the probability of using the services increased with decreasing urbanization of resident areas. Those living in areas with the 6 th level of urbanization were 2.47 times more likely to use the services than those living in the area of first level (most urban) (OR = 2.47, 95% CI = 2.06- 2.97).
Using those with less than NT$ 15,840 of premium-based monthly payroll as a reference group, the group with NT$ 16,500-22,800 was more likely to use the adult preventive health services (OR = 1.16, 95% CI = 1.04-1.29). Those with low-income household status were more likely to use services than those without low-income household status (OR =1.27, 95%CI = 1.14-1.42). Those with catastrophic illness/injury were 1.22 times (95%CI =1.08-1.38) more likely to use the services than those without. In addition, those having endocrine and metabolic diseases (OR = 1.79, 95%CI = 1.63-1.96) or circulatory system diseases (OR = 1.57, 95%CI = 1.43- 1.72) were more likely to use the services than those who had not. The probability of using the services decreased with increasing severity of intellectual disabilities. Those with very severe intellectual disability were 0.75 times less likely to use the services than those with mild level of severity (95%CI = 0.66-0.86).
Discussion
In 2004, the overall rate of use of adult preventive health services among those
aged 40 to 64 years was 42%, while the rate of use among those aged 65 years or
older was 38% [27]. However, only 16.65% of people with intellectual disabilities
aged over 40 years used the preventive health services in the years 2006-2008, which was much lower than that of the general population. Another study indicated that, in Taiwan, among the disabled people using adult preventive health services, people suffering from chronic epilepsy had the highest use rate (23.33%), whereas disabled people with major organ malfunction had the lowest use rate (10.21%) [27].
The results of this study indicated that the utilization of adult preventive health services were not significantly associated with aborigine status and educational level.
The finding of females with higher probability to use the services than males was consistent with previous studies reporting the utilization of relevant preventive health services [30-32]. Those aged ≥ 65 years were less likely to use the services than the others, which might be associated with many elderly persons with intellectual disabilities living in psychiatric hospitals, nursing facilities, and nursing homes [33].
People with an “unclear” marital status exhibited the lowest use rate. Most people with this status may have been unmarried, and unmarried people exhibited the lowest use rate compared with other marital status groups. The probability of using
preventive health services increased with decreasing urbanization of resident areas.
Generally, people living in urban areas have more convenient transportations and can
get faster access to medical resources than those living in rural areas. However, the
Bureau of National Health Insurance (NHI) initiated an Integrated Delivery System
program in 1999 that covered all 48 mountainous and island districts. Under the
program, NHI-contracted hospitals are responsible for providing medical care,
including outpatient care, emergency services, and specialty services. Health care,
which consists of outpatient care, preventive care, disease screening, and health
education, is provided from mobile vehicles. The mobile care services were provided
in mountain areas and offshore islands to narrow the health care disparities. For those
with intellectual disabilities living in rural areas, it was common that they and their families went together to receive preventive health services when the mobile care services were provided. As the result, a higher probability of using the services was observed for the persons with intellectual disabilities living in rural areas than those in urban areas. The probability of using preventive health services was found lower for the participants living in the most urbanized areas in this study. It was more likely due to better medical resources and higher accessibility in urban areas. They could obtain necessary medical treatments once they were ill. The high accessibility resulted in less attention being paid to use preventive health services by the participants living in urbanized areas.
Our results indicated that those with a low-income household status were more likely to use the services than the others, which was inconsistent with previous studies reporting that higher incomes were associated with more frequent use of preventive health services [34-36]. This finding may be resulted from the improvement in eliminating health inequalities between rich and poor populations, as a consequence
of implementation of the NHI in Taiwan since 1995.
Aboriginal persons with intellectual disabilities had similar probability of using
the services compared to non-aborigines. The results reflected the outcomes of efforts
to improve health for vulnerable populations, and to eliminate gaps of health care for
the minority in Taiwan. The probability of using the services was higher in those with
any catastrophic illness/injury than those without. It was possible that their families
were more concerned with changes in their health status for those participants with a catastrophic disease. Therefore, they paid more attentions and used more preventive health services. In consistent with previous studies [37], we also found that those with very severe level of intellectual disability used less preventive health services. The cognitive and language skills for the persons with very severe intellectual disabilities are lower compared with those with moderate and mild levels of severity. They need assistance and company of other people, which lead to more difficulties in using
preventive health services.
This study was limited by the sources of data, which did not include information pertaining to personal health beliefs or health behaviors. The lack of objective
information on household income in our dataset is regarded as a limitation of this
study.
Although health policy has established strategies for eliminating health inequalities that affect people with intellectual disabilities in Taiwan, preventive health services must be markedly improved for people with intellectual disabilities.
According to the findings, conducting publicity through the media and educating the
public on using adult preventive health services are suggested. In addition, health care
organizations should aggressively encourage and arrange free preventive health
services for people with intellectual disabilities when they visit physicians,
particularly for groups that were determined not to use such services.
Conclusions
This study demonstrated that the significant factors influencing the utilization of adult preventive health services for the persons with intellectual disabilities included gender, age, and urbanization of resident areas, premium-based payroll, low-income household status, marital status, catastrophic illness/injury status, relevant chronic diseases, and severity of intellectual disabilities. Non-significant factors were aboriginal status and educational level. Those with lower use of preventive health services were characterized by male gender, aged ≥ 65 years, high school education, unmarried, living in urban areas, with skin and blood-forming organs diseases, and with very severe intellectual disabilities.
List of abbreviations
CI: Confidence interval;
HPA: Health Promotion Administration;
IQ: Intelligence quotient;
NHI: National Health Insurance;
NT$: New Taiwan Dollar;
OR: Odds Ratio;
SAS: Statistics Analysis System;
Competing interests
The author(s) declare that they have no competing interests.
Authors’ contributions
WCT and PTK conducted the study design. SMY and LTC drafted the manuscript.
PTK and SMY conducted the statistical analysis. WCT was the supervisor of the study and revised the manuscript critically for important intellectual content. All authors read and approved the manuscript.
Authors' information
1. Department of Health Services Administration, China Medical University,
Taichung, Taiwan 40402, R.O.C.
2. Department of Chinese Medicine, Nantou Hospital, Nantou, Taiwan, R.O.C.
3. Department of Healthcare Administration, Asia University, Taichung, Taiwan 41354, R.O.C.
Acknowledgements
This study was supported by the grant (CMU99-S-47) from China Medical University and the grant (No.9805006A) from the Health Promotion Administration. The
preventive health care files were obtained from the Health Promotion Administration,
Ministry of Health and Welfare in Taiwan. We are also grateful for use of the
National Health Insurance Research Database provided by the Ministry of Health and Welfare, Taiwan. The interpretations and conclusions contained herein do not
represent those of the Health Promotion Administration in Taiwan. We would like to
thank two reviewers and the editor for their valued comments.
Reference
1. Maulik PK, Mascarenhas MN, Mathers CD, Dua T, Saxena S: Prevalence of intellectual disability: a meta-analysis of population-based studies.
Research In Developmental Disabilities 2011, 32(2):419-436.
2. Statistical yearbook of interior - The disabled population by cause [http://sowf.moi.gov.tw/stat/year/y04-19.xls ]
3. Wang YT: Are adults with intellectual disabilities socially excluded? An exploratory study in Taiwan. Journal Of Intellectual Disability Research: JIDR 2013, 57(10):893-902.
4. Durvasula S, Beange H, Baker W: Mortality of people with intellectual disability in northern Sydney. Journal of Intellectual & Developmental Disability 2002, 27(4):255-264.
5. Patja K, Iivanainen M, Vesala H, Oksanen H, Ruoppila I: Life expectancy of people with intellectual disability: a 35-year follow-up study. Journal Of Intellectual Disability Research: JIDR 2000, 44 ( Pt 5):591-599.
6. Tyrer F, McGrother C: Cause-specific mortality and death certificate reporting in adults with moderate to profound intellectual disability.
Journal Of Intellectual Disability Research: JIDR 2009, 53(11):898-904.
7. van Schrojenstein Lantman-De HM, Metsemakers JF, Haveman MJ, Crebolder HF: Health problems in people with intellectual disability in general
practice: a comparative study. Family practice 2000, 17(5):405-407.
8. Kwok H, Cheung PWH: Co-morbidity of psychiatric disorder and medical illness in people with intellectual disabilities. Current Opinion In Psychiatry 2007, 20(5):443-449.
9. Lin JD, Yen CF, Loh CH, Hsu SW, Huang HC, Tang CC, Li CW, Wu JL: A cross- sectional study of the characteristics and determinants of emergency care utilization among people with intellectual disabilities in Taiwan. Research In Developmental Disabilities 2006, 27(6):657-667.
10. Rimmer JH, Yamaki K, Lowry BMD, Wang E, Vogel LC: Obesity and obesity- related secondary conditions in adolescents with
intellectual/developmental disabilities. Journal Of Intellectual Disability Research: JIDR 2010, 54(9):787-794.
11. Sohler N, Lubetkin E, Levy J, Soghomonian C, Rimmerman A: Factors
associated with obesity and coronary heart disease in people with
intellectual disabilities. Social work in health care 2009, 48(1):76-89.
12. Diab ME, Johnston MV: Relationships between level of disability and receipt of preventive health services. Archives of physical medicine and
rehabilitation 2004, 85(5):749-757.
13. Lin JD, Yen CF, Wu JL: Importance and satisfaction of preventive health strategies in institutions for people with intellectual disabilities: a
perspective of institutional directors. Research in developmental disabilities 2005, 26(3):267-280.
14. Weng RH, Kung PT, Tsai WC, Chiang HH, Chiu LT: The use of fluoride varnish and its determining factors among children with disability in Taiwan. Res Dev Disabil 2011, 32(2):583-592.
15. Iezzoni LI, McCarthy EP, Davis RB, Harris-David L, O'Day B: Use of screening and preventive services among women with disabilities. American journal of medical quality 2001, 16(4):135-144.
16. Phillips KA, Mayer ML, Aday LA: Barriers to care among racial/ethnic groups under managed care. Health affairs 2000, 19(4):65-75.
17. Ramirez A, Farmer GC, Grant D, Papachristou T: Disability and preventive cancer screening: results from the 2001 California Health Interview Survey.
American journal of public health 2005, 95(11):2057-2064.
18. Shabas D, Weinreb H: Preventive healthcare in women with multiple
sclerosis. Journal of women's health & gender-based medicine 2000, 9(4):389- 395.
19. Pearson V, Davis C, Ruoff C, Dyer J: Only one quarter of women with learning disability in Exeter have cervical screening. BMJ (Clinical Research Ed) 1998, 316(7149):1979-1979.
20. Perry J, Kerr M, Felce D, Bartley S, Tomlinson J: Monitoring the public health impact of health checks for adults with a learning disability in Wales: Final report of the Public Health Wales/WCLD project group. Cardiff: Public Health Wales & Welsh Centre for Learning Disabilities 2010.
21. Lennox N, Bain C, Rey-Conde T, Purdie D, Bush R, Pandeya N: Effects of a comprehensive health assessment programme for Australian adults with intellectual disability: a cluster randomized trial. International Journal Of Epidemiology 2007, 36(1):139-146.
22. Maciosek MV, Coffield AB, Flottemesch TJ, Edwards NM, Solberg LI: Greater use of preventive services in U.S. health care could save lives at little or no cost. Health affairs 2010, 29(9):1656-1660.
23. Gandjour A: Aging diseases--do they prevent preventive health care from saving costs? Health economics 2009, 18(3):355-362.
24. Macnab AJ, Rozmus J, Benton D, Gagnon FA: 3-year results of a collaborative
school-based oral health program in a remote First Nations community.
Rural and remote health 2008, 8(2):882.
25. Malach M, Baumol WJ: Opportunities for the cost reduction of medical care.
Journal of community health 2009, 34(4):255-261.
26. Rodriguez Vazquez C, Garcillan R, Rioboo R, Bratos E: Prevalence of dental caries in an adult population with mental disabilities in Spain. Spec Care Dentist 2002, 22(2):65-69.
27. Kung PT, Tsai WC, Li YH: Determining factors for utilization of preventive health services among adults with disabilities in Taiwan. Res Dev Disabil 2012, 33(1):205-213.
28. Huang KH, Tsai WC, Kung PT: The use of Pap smear and its influencing factors among women with disabilities in Taiwan. Res Dev Disabil 2012, 33(2):307- 314.
29. Public Assistance Act [http://law.moj.gov.tw/Eng/LawClass/LawAll.aspx?
PCode=D0050078]
30. Bertakis KD, Azari R, Helms LJ, Callahan EJ, Robbins JA: Gender differences in the utilization of health care services. The Journal of family practice 2000, 49(2):147-152.
31. Green CA, Pope CR: Gender, psychosocial factors and the use of medical services: a longitudinal analysis. Social science & medicine 1999,
48(10):1363-1372.
32. Owens GM: Gender differences in health care expenditures, resource utilization, and quality of care. Journal of managed care pharmacy 2008, 14(3 Suppl):2-6.
33. Haveman M, Perry J, Salvador-Carulla L, Walsh PN, Kerr M, Van Schrojenstein Lantman-de Valk H, Van Hove G, Berger DM, Azema B, Buono S et al: Ageing and health status in adults with intellectual disabilities: results of the European POMONA II study. Journal Of Intellectual & Developmental Disability 2011, 36(1):49-60.
34. Hewitt M, Devesa SS, Breen N: Cervical cancer screening among U.S. women:
analyses of the 2000 National Health Interview Survey. Preventive medicine 2004, 39(2):270-278.
35. Katz SJ, Hofer TP: Socioeconomic disparities in preventive care persist despite universal coverage. Breast and cervical cancer screening in Ontario and the United States. JAMA 1994, 272(7):530-534.
36. Rodriguez MA, Ward LM, Perez-Stable EJ: Breast and cervical cancer
screening: impact of health insurance status, ethnicity, and nativity of
Latinas. Annals of family medicine 2005, 3(3):235-241.
37. Kung PT, Tsai WC, Chiou SJ: The assessment of the likelihood of
mammography usage with relevant factors among women with disabilities.
Res Dev Disabil 2012, 33(1):136-143.
Table 1 Use of adult preventive health services among the intellectual disability:
basic characteristics and bivariate analysis.
Used Did not use χ
2Variables N=21042 % n
1=3503 % n
2=17539 % p-value
Overall rate of use 16.65
Gender <.001
Female 9897 47.03 1808 18.27 8089 81.73
Male 11145 52.97 1695 15.21 9450 84.79
Age <.001
40-44 years 3753 17.84 628 16.73 3125 83.27
45-49 years 5609 26.66 921 16.42 4688 83.58
50-54 years 4420 21.01 774 17.51 3646 82.49
55-59 years 3089 14.68 609 19.72 2480 80.28
60-64 years 1817 8.64 367 20.20 1450 79.80
65-69 years 1028 4.89 94 9.14 934 90.86
≥70 years 1326 6.30 110 8.30 1216 91.70
Educational level 0.535
Elementary school and under 15327 72.84 2566 16.74 12761 83.26
Junior high school 2645 12.57 454 17.16 2191 82.84
Senior (vocational) high school 550 2.61 80 14.55 470 85.45
Junior college and university or above 99 0.47 16 16.16 83 83.84
Unclear 2421 11.51 387 15.99 2034 84.01
Marital status <.001
Married 6386 30.35 1239 19.40 5147 80.60
Unmarried 8463 40.22 1346 15.90 7117 84.10
Divorced or widowed 677 3.22 139 20.53 538 79.47
Unclear 5516 26.21 779 14.12 4737 85.88
Level of urbanization
a<.001
Level one 1802 8.56 201 11.15 1601 88.85
Level two 3394 16.13 553 16.29 2841 83.71
Level three 2865 13.62 468 16.34 2397 83.66
Level four 1809 8.60 295 16.31 1514 83.69
Level five 3483 16.55 562 16.14 2921 83.86
Level six 3006 14.29 589 19.59 2417 80.41
Level seven 3173 15.08 569 17.93 2604 82.07
Level eight 1510 7.18 266 17.62 1244 82.38
Table 1 (Continued)
Used Did not use χ
2Variables N=21042 % n
1=3503 % n
2=17539 % p-value
Premium-based monthly payroll <.001
Dependents 5303 25.20 720 13.58 4583 86.42
<15,840 10877 51.69 1898 17.45 8979 82.55
16,500-22,800 4143 19.69 770 18.59 3373 81.41
24,000-28,800 358 1.70 57 15.92 301 84.08
30,300-36,300 210 1.00 31 14.76 179 85.24
>38,200 151 0.72 27 17.88 124 82.12
Low-income household <.001
Yes 3713 17.65 799 21.52 2914 78.48
No 17329 82.35 2704 15.60 14625 84.40
Aborigine 0.001
Yes 267 1.27 66 24.72 201 75.28
No 20775 98.73 3437 16.54 17338 83.46
Catastrophic illness/injury <.001
Yes 2538 12.06 602 23.72 1936 76.28
No 18504 87.94 2901 15.68 15603 84.32
Relevant chronic diseases
Cancer 0.344
Yes 266 1.26 50 18.80 216 81.20
No 20776 98.74 3453 16.62 17323 83.38
Endocrine and metabolic disease <.001
Yes 4319 20.53 1324 30.66 2995 69.34
No 16723 79.47 2179 13.03 14544 86.97
Mental illness <.001
Yes 5564 26.44 1416 25.45 4148 74.55
No 15478 73.56 2087 13.48 13391 86.52
Disease of the nervous system <.001
Yes 2636 12.53 686 26.02 1950 73.98
No 18406 87.47 2817 15.30 15589 84.70
Disease of the circulatory system <.001
Yes 5035 23.93 1435 28.50 3600 71.50
No 16007 76.07 2068 12.92 13939 87.08
Disease of the respiratory system <.001
Yes 3047 14.48 886 29.08 2161 70.92
No 17995 85.52 2617 14.54 15378 85.46
Table 1 (Continued)
Used Did not use χ
2Variables N=21042 % n
1=3503 % n
2=17539 % p-value
Disease of the digestive system <.001
Yes 4861 23.10 1398 28.76 3463 71.24
No 16181 76.90 2105 13.01 14076 86.99
Disease of the urinary system <.001
Yes 459 2.18 136 29.63 323 70.37
No 20583 97.82 3367 16.36 17216 83.64
Disease of the skeletal and muscular system and connective tissue <.001
Yes 3830 18.20 1078 28.15 2752 71.85
No 17212 81.80 2425 14.09 14787 85.91
Disease of the eyes and auxiliary organs <.001
Yes 640 3.04 161 25.16 479 74.84
No 20402 96.96 3342 16.38 17060 83.62
Infectious diseases <.001
Yes 839 3.99 210 25.03 629 74.97
No 20203 96.01 3293 16.30 16910 83.70
Congenital malformation <.001
Yes 277 1.32 71 25.63 206 74.37
No 20765 98.68 3432 16.53 17333 83.47
Skin and subcutaneous tissue disorders <.001
Yes 1861 8.84 551 29.61 1310 70.39
No 19181 91.16 2952 15.39 16229 84.61
Diseases of the blood and blood-forming organs <.001
Yes 761 3.62 227 29.83 534 70.17
No 20281 96.38 3276 16.15 17005 83.85
Diseases of the ear and mastoid process <.001
Yes 735 3.49 232 31.56 503 68.44
No 20307 96.51 3271 16.11 17036 83.89
Severity of intellectual disability <.001
Mild 3673 17.46 712 19.38 2961 80.62
Moderate 6775 32.20 1194 17.62 5581 82.38
Severe 6385 30.34 1015 15.90 5370 84.10
Very severe 4209 20.00 582 13.83 3627 86.17
a
Level one: the most urbanized areas.
Table 2 Factors influencing the intellectual disability to use adult preventive health services: logistic regression analysis.
Unadjusted Adjusted
Variable name OR 95% CI p-value OR 95% CI p-value
Gender
Female - - - - - - - -
Male 0.80 0.75 0.86 <.001* 0.87 0.80 0.95 0.001*
Age
40-44 years - - - - - - - -
45-49 years 0.98 0.88 1.09 0.689 0.92 0.82 1.03 0.140
50-54years 1.06 0.94 1.19 0.353 0.94 0.83 1.06 0.290
55-59 years 1.22 1.08 1.38 0.001* 1.00 0.88 1.15 0.950
60-64 years 1.26 1.09 1.45 0.002* 1.03 0.89 1.21 0.677
65-69 years 0.50 0.40 0.63 <.001* 0.33 0.26 0.42 <.001*
≥70 years 0.45 0.36 0.56 <.001* 0.35 0.28 0.44 <.001*
Educational level
Elementary school and under - - - - - - - -
Junior high school 1.03 0.92 1.15 0.591 1.03 0.91 1.16 0.676
Senior (vocational) high school 0.85 0.67 1.08 0.175 0.78 0.60 1.01 0.057 Junior college and university or above 0.96 0.56 1.64 0.878 1.11 0.63 1.96 0.714
Unclear 0.95 0.84 1.06 0.353 0.98 0.87 1.12 0.790
Marital status
Married - - - - - - - -
Unmarried 1.27 1.17 1.39 <.001* 1.07 0.97 1.19 0.168
Divorced or widowed 1.37 1.12 1.66 0.002* 1.16 0.94 1.43 0.179
Unclear 0.87 0.79 0.96 0.004* 0.79 0.71 0.88 <.001*
Level of urbanization
aLevel one - - - - - - - -
Level two 1.55 1.31 1.84 <.001* 1.79 1.49 2.15 <.001*
Level three 1.56 1.30 1.86 <.001* 1.85 1.53 2.23 <.001*
Level four 1.55 1.28 1.88 <.001* 1.90 1.55 2.33 <.001*
Level five 1.53 1.29 1.82 <.001* 1.91 1.59 2.29 <.001*
Level six 1.94 1.63 2.31 <.001* 2.47 2.06 2.97 <.001*
Level seven 1.74 1.47 2.07 <.001* 2.19 1.82 2.64 <.001*
Level eight 1.70 1.40 2.08 <.001* 2.08 1.68 2.57 <.001*
Table 2 (Continued)
Unadjusted Adjusted
Variable name OR 95% CI p-value OR 95% CI p-value
Premium-based monthly payroll
<15,840 - - - - - - - -
Dependent population 0.74 0.68 0.82 <.001* 0.90 0.81 1.01 0.061
16,500-22,800 1.08 0.98 1.19 0.104 1.16 1.04 1.29 0.011*
24,000-28,800 0.90 0.67 1.19 0.453 1.03 0.76 1.40 0.836
30,300-36,300 0.82 0.56 1.20 0.310 0.91 0.61 1.37 0.653
>38,200 1.03 0.68 1.57 0.890 1.12 0.72 1.74 0.631
Low-income household
No - - - - - - - -
Yes 1.48 1.36 1.62 <.001* 1.27 1.14 1.42 <.001*
Aborigine
No - - - - - - - -
Yes 1.66 1.25 2.19 0.000* 1.29 0.95 1.75 0.103
Catastrophic illness/injury
No - - - - - - - -
Yes 1.67 1.51 1.85 <.001* 1.22 1.08 1.38 0.002*
Relevant chronic diseases
Cancer 1.16 0.85 1.58 0.344 0.77 0.55 1.08 0.135
Endocrine and metabolic disease 2.95 2.73 3.19 <.001* 1.79 1.63 1.96 <.001*
Mental illness 2.19 2.03 2.36 <.001* 1.33 1.21 1.46 <.001*
Disease of the nervous system 1.95 1.77 2.14 <.001* 1.11 0.99 1.24 0.067 Disease of the circulatory system 2.69 2.49 2.90 <.001* 1.57 1.43 1.72 <.001*
Disease of the respiratory system 2.41 2.21 2.63 <.001* 1.38 1.24 1.53 <.001*
Disease of the digestive system 2.70 2.50 2.92 <.001* 1.49 1.36 1.63 <.001*
Disease of the urinary system 2.15 1.76 2.64 <.001* 0.97 0.77 1.21 0.766 Disease of the skeletal and muscular
system and connective tissue
2.39 2.20 2.59 <.001*
1.31 1.19 1.45 <.001*
Disease of the eyes and auxiliary organs 1.72 1.43 2.06 <.001* 0.94 0.77 1.15 0.549
Infectious diseases 1.71 1.46 2.01 <.001* 0.98 0.82 1.16 0.776
Congenital malformation 1.74 1.33 2.29 <.001* 1.05 0.78 1.41 0.748 Skin and subcutaneous tissue disorders 2.31 2.08 2.57 <.001* 1.29 1.14 1.46 <.001*
Diseases of the blood and blood-forming organs 2.21 1.88 2.59 <.001* 1.18 0.99 1.40 0.065
Diseases of the ear and mastoid process 2.40 2.05 2.82 <.001* 1.08 0.91 1.29 0.382
Table 2 (Continued)
Unadjusted Adjusted
Variable name OR 95% CI p-value OR 95% CI p-value
Severity of intellectual disability
Mild - - - - - - - -
Moderate 0.89 0.80 0.99 0.026* 0.88 0.79 0.98 0.020*
Severe 0.79 0.71 0.87 <.001* 0.82 0.73 0.92 0.001*
Very severe 0.67 0.59 0.75 <.001* 0.75 0.66 0.86 <.001*
a