國立臺灣大學工學院土木工程學研究所 碩士論文
Graduate Institute of Civil Engineering College of Engineering
National Taiwan University Master Thesis
以動態車輛路線最佳化模型決定高速公路事件應變車隊任務 Using Dynamic Vehicle Routing Model to Dispatch Emergency
Response Teams on Freeways
戴至佑 Chih-Yu Tai
指導教授:許聿廷 博士 Advisor: Yu-ting Hsu, Ph.D.
中華民國 107 年 7 月 July, 2018
誌謝
研究生的生涯很短暫,在結束碩論的撰寫後也跟著告一段落,但回想從碩零 到即將畢業這段時間,發現生活過得非常充實又有趣,一方面在自己喜歡的領域 鑽研學習,另一方面也認識許多志同道合的朋友,互相砥礪切磋分享見解。當然 研究的過程並不輕鬆,需要修習許多專業課程與閱讀文獻,打好研究基礎,還要 學習新的工具來幫助我們進行實驗或分析等等工作,這些佔據了研究生大多數的 時間,剩下的時間則將研究進度向前推進。有時研究也會遇到瓶頸,此時老師和 同學們的幫助尤其重要,透過一次次的討論與修改,方能克服研究中遇到的困難。
能完成這篇論文,首先要感謝的人是我的指導教授 許聿廷老師,老師總是耐 心的聆聽我的問題,並幫助我釐清思緒,讓我可以不斷向前邁進。也要感謝柏傑 家維,能跟你們一起吃飯運動,讓我的生活豐富了不少,你們也時常關心我的論 文,給予我許多協助。乃慈學姊雖然認識不久但感覺已經是老朋友了,謝謝妳帶 我去吃很多好吃的東西,關心我生活的大小事。薇亘 一起做計畫的好學妹,相信 細心的你能繼續做好計畫順利畢業。另外也很感謝研究室的學弟妹們在報團咪時 給我的許多建議,很高興能跟你們在同一家。
感謝一直陪伴這我的哥哥,你是我的心靈支柱,雖然在碩二時你去服役,但 每天晚上總是聽我分享事情鼓勵我做好研究,口試時更成為我的模擬口委,聽我 一遍又一遍的練習。
最後,感謝我的父母支持我唸到碩士,平常的關心照顧我的你們是我堅強的 後盾,讓我可以專心投入在研究中,完成我的學業。完成碩論讓我有許多的收穫,
未來仍要繼續學習努力不懈,不枉費這兩年辛苦打下的基礎。
中文摘要
高速公路的壅塞超過半數是由事件所造成,提升事件處裡的效率能夠降低壅 塞所帶來的延滯時間。目前國道的管理係依賴事件應變車隊進行事件的清理與排 除,最佳化事件應變車隊的調度為一種有效提升應變效率的方法。本研究的目標 為應用最佳化方法提升事件應變作業指派的品質,以縮短應變車隊抵達各事件的 應變時間。本研究提出動態調度系統的架構,釐清與分類系統所需輸入或取得的 參數,並針對高速公路系統建立應變車隊路徑規劃問題的模型。模型除了最小化 總體事件應變時間,也納入動態調度中重新指派車隊與事件類型優先順序的考量,
以使調度模型能夠有更多彈性、符合實際的需求。本研究以臺灣北區高速公路路 網為研究案例,比較分析動態調度模式與現行調度模式間應變時間的差異。從案 例分析中可發現動態調度模式不但能在新事件發生後提供即時總應變時間最小化 的指派策略,使尖峰時段的總應變時間下降,也能透過改變相關參數的權重來適 度調整重新指派車隊的頻率或事件類別優先處理的順序。本研究可以作為高速公 路管理單位建構動態調度系統的參考,特別對於多事件密集發生的狀況下,可幫 助調度人員做出更有效率的派遣決策。
關鍵字:高速公路管理、決策支援系統、動態派遣、事件應變、車輛路徑規劃。
ABSTRACT
According to historic data, more than half of freeway congestion is caused by incidents, and enhancing efficiency of incident response can reduce the delay caused by congestion. For most of freeway management systems, they depend on incident response teams to clean up and remove incidents, and optimizing decision of response team dispatch is an effective way to improve the efficiency of incident response. The goal of this study is to apply an optimization method to enhance the quality of the incident assignment strategy to reduce the response time for the response teams to arrive at each incident. We propose the framework of a dynamic dispatch system, clarify the parameters that need to be input or obtained, and develop a model based on the vehicle routing problem for incident response on the freeways. In addition to minimizing the total incident response time, the model also incorporates the considerations of reassignment and prioritizing incidents in dynamic dispatch, making the dispatch model more flexible and consistent with realism of operational needs. In this study, the roadway network of the Northern District of Taiwan Area Freeway is used for the case study to compare the dynamic dispatch model with the current dispatch approach. It is found that the dynamic dispatch model can provide an incident assignment strategy that minimizes the total response time after a new incident occurs so as to enhance the efficiency of freeway incident response, particularly for the peak period where multiple incidents are likely to occur concurrently. Additionally, it also allows the flexible adjustment of the reassignment frequency or incident priority by changing the weight of the related parameters. Our research can provide the insights agency for the construction of a dynamic dispatch system for freeway management units and help dispatchers make more efficient dispatch decisions.
Key words: freeway management, decision making system, dynamic dispatch, incident response, vehicle routing problem.
CONTENTS
口試委員會審定書………...#
誌謝 ...
中文摘要 ...i
ABSTRACT ... ii
CONTENTS ...iv
LIST OF FIGURES ...vi
LIST OF TABLES ... vii
Chapter 1 Introduction ... 1
1.1 Research Background ... 1
1.2 Research Objective ... 1
1.3 Thesis Organization ... 2
Chapter 2 Literature Review ... 4
2.1 Freeway Incident Management... 4
2.2 Freeway Incident Analysis ... 7
2.3 Dispatching Model of Incident Response ... 8
2.3.1 Static Model ... 8
2.3.2 Dynamic Model ... 11
2.4 Summary of Literature Review ... 15
Chapter 3 Methodologies and Modeling Approaches ... 17
3.1 Problem Statement ... 17
3.2 Operation Design for Incident Response ... 19
3.3 Model Development ... 24
3.3.1 Assumptions ... 25
3.3.2 Notation ... 26
3.3.3 Problem Formulation ... 30
Chapter 4 Case Study ... 35
4.1 Northern Taiwan Freeway System ... 35
4.1.1 Network ... 39
4.1.2 Incident data ... 42
4.2 Case Analysis and Comparison ... 45
4.2.1 Monday peak period ... 46
4.2.2 Friday peak period ... 49
4.2.3 Saturday peak period ... 52
4.2.4 Sunday peak period ... 55
4.2.5 Monday non-peak period ... 57
4.3 Sensitivity Analysis ... 59
4.3.1 Priority Order ... 59
4.3.2 Reassignment filter ... 62
4.4 Summary of Findings ... 65
Chapter 5 Conclusions ... 70
5.1 Research Summary ... 70
5.2 Contributions ... 71
5.3 Future Research ... 74
REFERENCE ... 76
LIST OF FIGURES
Fig. 1.1 Study Framework... 3
Fig. 2.1 Input-Output Estimation of Freeway-Incident Delay ... 5
Fig. 2.2 Logic of Proposed Approach ... 10
Fig. 3.1 Components of Freeway-Incident Duration Time ... 20
Fig. 3.2 Operation Design for Incident Response ... 23
Fig. 3.3 Virtual network Diagram ... 29
Fig. 3.4 Time cost on nodes and links ... 29
Fig. 4.1 The duty areas of branches and locations of traffic control centers and stationary points of response teams ... 37
Fig. 4.2 Duty ranges of incident response teams ... 39
Fig. 4.4 The chart of cumulative response time of four cases ... 68
Fig. 4.5 Computer processing time of the model ... 69
LIST OF TABLES
Table 2.1 Type of vehicle routing problem model ... 11
Table 2.2 Comparison of studies on vehicle dispatch model ... 14
Table 3.1 Notation ... 26
Table 4.1 The mileage of stationary point of each response team ... 37
Table 4.2 The travel time between interchanges in a day time... 41
Table 4.3 The information of studied cases ... 42
Table 4.4 The history dispatch record data ... 44
Table 4.5 Estimated incident processing time ... 44
Table 4.6 The result of Monday peak period ... 48
Table 4.7 The result of Friday peak period ... 51
Table 4.9 The result of Sunday peak period ... 56
Table 4.10 The result of Monday non-peak period ... 58
Table 4.11 Response time of control group and experimental group ... 60
Table 4.12 The result of priority order test ... 61
Table 4.13 The total response time of reassignment filter test ... 63
Table 4.14 The result of reassignment filter test ... 64
Table 4.15 Total response time of study cases ... 67
Table 4.16 Computer processing time of the model ... 69
Chapter 1 Introduction
1.1 Research Background
The development of a freeway system, a national level transportation, shortens the travel time and accelerates intercity transportation, and it also promotes the growth of economy. The government has to maintain and manage freeways, and it induces a great amount of manpower, equipment, monetary and time costs. Emergency incident response is one of the works, which is a mechanism to contain the impact on traffic flows when incidents occur. To be specific, if an incident such as accident, scattered items or animal intrusion occurs, it may block lanes and cause severe congestion over the freeway system. There is the need of a freeway traffic control center to dispatch response teams to clear the incident and restore traffic. The duration from incident occurrence to clearance determines the delays caused to the upstream traffic volume. As a result, how to decrease incident-processing time is one of critical issues in the field of freeway maintenance and management.
1.2 Research Objective
In most of the current practice, the freeway management agencies may divide the freeway network into several districts, and each district has its own incident response team. When an incident occurs, the local control unit in the district will notify the freeway management agency and send a response team to clear the incident. In recent years, due to the development of Intelligent Transportation System (ITS), advance information, communication and computer technologies are applied to field of
transportation management. The freeway management agency establishes traffic control centers to monitor real-time traffic on freeways and also manage response teams through real-time traffic censors, closed-circuit television cameras (CCTV) and GPS units. Incident information is reported to the traffic control center, and the traffic control center can directly assign appropriate response teams to process incidents. This new dispatch system for incident response increases the flexibility and efficiency of coordinating response teams and decrease the waste of resources. However, the current dispatch mode is relatively static and considerably based on dispatcher’s personal judgement; it may not work smoothly when multiple incidents occurs in the same area, and the dispatcher has to rely on experience to assign response teams. As a result, this research seeks to develop a dynamic model using real-time traffic data on freeway to assign response teams. The model result will be compared with the currently-used static mode and analyzed with respect to relevant parameter will be discussed.
1.3 Thesis Organization
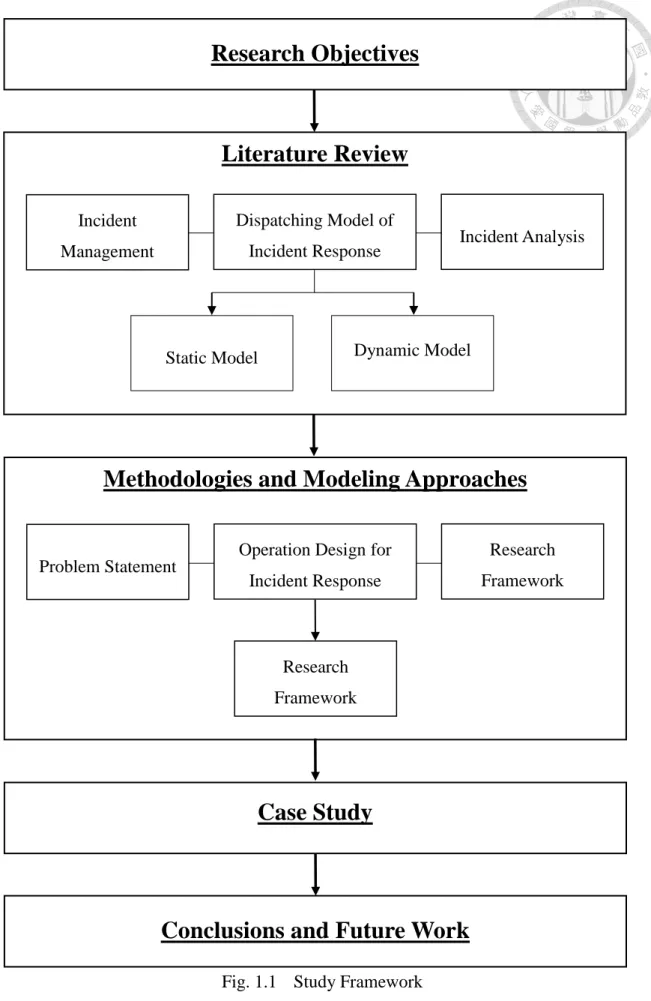
This study is composed of five chapters. The overall flowchart of its organization is shown in Fig. 1.1. Chapter 1 introduces the research background and current practice of freeway incident response, and thereby the motivation and objective of this research are proposed. Chapter 2 reviews important previous studies in the related areas and discusses the difference between static and dynamic dispatch model. Chapter 3 proposes the concept of the real-time dispatch decision-making system and develops a dynamic dispatch model for response team. In Chapter 4, this research uses Northern Taiwan Freeway Network for the case study, and the result are discussed with different scenarios and sensitivity analysis. Chapter 5 concludes the contribution of this research and suggests potential directions for future work.
Fig. 1.1 Study Framework
Research Objectives
Literature Review
Methodologies and Modeling Approaches
Incident Management
Dispatching Model of
Incident Response Incident Analysis
Static Model Dynamic Model
Problem Statement
Operation Design for Incident Response
Research Framework
Research Framework
Conclusions and Future Work
Case Study
Chapter 2 Literature Review
Incidents may influence traffic and safety on freeways and cause loss of time, money and even lives. If an incident block some lanes, it will cause congestion on the upper freeway segment. Once vehicles queue to the near ramp, the response team may spend more time to arrive at scene and the delay of vehicles increases. In addition, some kinds of incident, such as animal intrusion, accident or scattered items, which are not processed right away, can derive more serious incident and make people get injury or property lose. As a result, we should do more research to improve management strategies and knowledge of incidents. To design and make progress of incident processing system or to provide strategies to alleviate the impact of incidents on freeway, many scholars studied freeway incidents from different aspects.
In this chapter, this research divides previous research into three categories. The first category is freeway incident management, the second is incident data analysis and the third is vehicle dispatch model.
2.1 Freeway Incident Management
In this category, some studies showed us the background of incident management. A study (Zografos et al., 1993) first introduced “traffic flow restoration unit (TFRU), which is dispatched to restore the traffic flow when an incident is detected.
A traffic flow restoration unit may consist of a single vehicle, i.e. tow-truck, or it may be a multivehicle unit including tow-trucks, ambulances, and so forth.” The emergency vehicle teams in our study were dispatched not only to restore traffic flow but also deal with other kinds of incident, so we called it “response team” in this study. The study
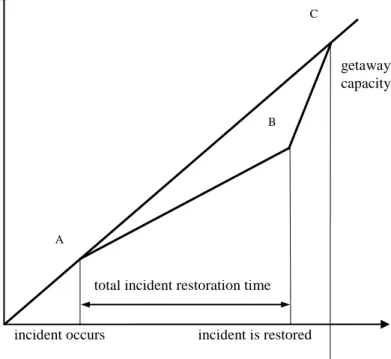
then explained the relationship between cumulative traffic volume and time by quoting
“the urban” (1989), see Fig. 2.1. They explained “the horizontal axis represents time, and the vertical, cumulative traffic volume. The initial traffic-flow rate is represented by the slope of the line AC. When an incident occurs, the actual traffic flow past the incident slows down due to the reduction of the capacity of the freeway. The slope of the line AB represents the flow rate past the incident site. At the time that the incident is remedied the traffic-flow rate increases (slope of line BC) until the delayed traffic passes the incident location and the traffic flow resumes its normal rate.” Fig. 2.1 shows that the total incident-remedy time is a major determinant of incident delay.
A
B C
getaway capacity
CUMULATIVE TRAFFIC VOLUME
incident occurs incident is restored
TIME traffic flow resumes to normal total incident restoration time
Fig. 2.1 Input-Output Estimation of Freeway-Incident Delay
On the other hand, due to the development of Intelligent Transportation System Technology (ITS), incident information can be delivered to traffic control center as the crucial data of planning and management. Stephen G. et al. (1992) and Zografos et al.
(2002) used ITS technology to create real-time decision making support system providing functions like districting, assigning response teams, routing and visualizing data to help the managers make proper decisions, and they believed this strategy enhancing the efficiency of incidents response.
These studies provide management logic of incident response through establishing systematic frames. The government can follow the studies to build decision support systems to help freeway managers make decisions and decrease incident response time.
However, authors of these theses did not explain the methods to dispatch response teams, so it is hard to assess the performance of their models.
Some researchers analyzed data or built model with considering the characteristic of freeway system, which is different from other road systems. For example, RH Hall (2002) considered the interval of interchange and the additional time that response teams spend to change direction on freeway to derive model of response time and delay.
They also indicated there are two dispatch strategies if a new incident occurs when the nearest response team is clearing another incident. The first one is to wait response team finishing previous incident and assign it to clear the new one, and the second one is to assign a farther response team to process the new incident. They believed future studies should discuss how to blend these two dispatch strategies to ensure utilization and stability of incident response time on peak hours. According to the study, this research will explore the characteristics of freeway system and these two strategies.
2.2 Freeway Incident Analysis
Incident occurred on the freeway frequently and left a lot of data which can be analyzed to find the occurrence tendency, and managers could adopt prevention strategies to enhance the quality of freeway management. JA Lindley. (1987) quantified the degree and cost of congestion on urban freeway in the future. They discovered emergency incident causing over half of the congestion delay so that their study made people understand the importance of preventing incidents and increasing the efficiency of incident response. They also emphasized that managers need to adopt high cost-benefit strategies to solve incident deriving problem.
Based on previous research, reducing duration of incidents can relieve the congestion effectively. Giuliano, G. (1989) collected freeway incident data to analyze the key factors related to incident processing time. They set incident processing time as the dependent variable and find out that the main factors are category, time of a day, volume ratio of large vehicles and road conditions. According to the result, they proposed some strategies to facilitate the congestion caused by incidents. Because Giuliano, G’s study deduced that different incident categories have different processing time, and the accident type incident caused the longest time to clear, Yang et al. (2012) used regression analysis with freeway accident data to find factors of the time from accident occurring to accident cleared and discuss ways to reduce accident processing time.
Different improvement strategies also need to do cost-benefit analysis to know the effectiveness. A study used big data of incidents and traffic volume collected from probe vehicles to analyze the difference between before and after implementing the vehicle patrol strategy and the factors of frequency of incident occurrence and duration.
Skabardonis et al. (1996) found that the strategy reduced the incident response time, but not significant enough to affect the duration. We should also evaluate the effectiveness to prove it a beneficial strategy after building the model.
2.3 Dispatching Model of Incident Response
This research wants to propose a method to assign response teams, so we review some theses related to vehicle dispatch model. In the process of incident response, the dispatch strategy of response teams affects the travel time and clearance order of incidents. Many previous studies proposed different models or strategies to enhance the efficiency of vehicle assignment. The dispatch model can be divided into static model and dynamic model by observing whether its parameters chang with time. The introduction of static and dynamic model is in the following:
2.3.1 Static Model
The static dispatch model decides each response team is responsible for fixed area before incident occurs. It would not change the dispatch method when some new incidents happen, so it is inflexible and simple than dynamic model.
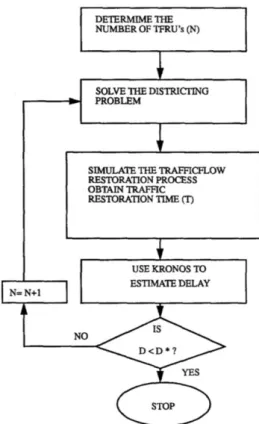
Zografos et al. (1993) introduced the operation procedure of a static model in their study, see Fig. 2.2. The number of response team started from one, and they used districting model to divide the area to the response team according to parameters such as the travel time from the response team stationary location to each road segment, the incident occurrence of each road segment and work load, and then estimating total delay.
Next, they increased the number of response teams and repeat the procedure above until the new stage delay was more than last stage delay, and the number of response team which caused least delay and its solution of districting problem were the best result. The
response team will be assigned to process incidents on the basis of the districting area.
However, deciding number of response team and districting area to them is not enough because it is possible that several incidents happen in the same area in a short time. Therefore, dispatchers follow strategies, such as First Called, First Served (FCFS) and Nearest Origin Assignment (NO) to assign response teams when they face this condition. A. Haghani et al. (2004) defined “The FCFS strategy assumes the service calls are assigned to available vehicles in the order in which requests are received.
Service requests are added to a queue of requests on arrival; when a vehicle becomes available, it is assigned the first request in the queue. If one (or more) vehicles is (are) idle when the request arrives. The request is assigned to the vehicle that has been idle longest. A driver must contact the dispatch center upon completion of service” and “In nearest origin assignment, service requests enter the pool of unassigned requests. Upon assignment completion, the driver contacts the dispatch center for a new assignment, at which time an assignment is made to the nearest unassigned request. Service calls arriving when one or more vehicles are idle are assigned to the nearest idle vehicle. A driver must contact the dispatch center upon completion of service.” Although these strategies can help making decision in real time, they are heuristic methods and still have large development space.
Fig. 2.2 Logic of Proposed Approach
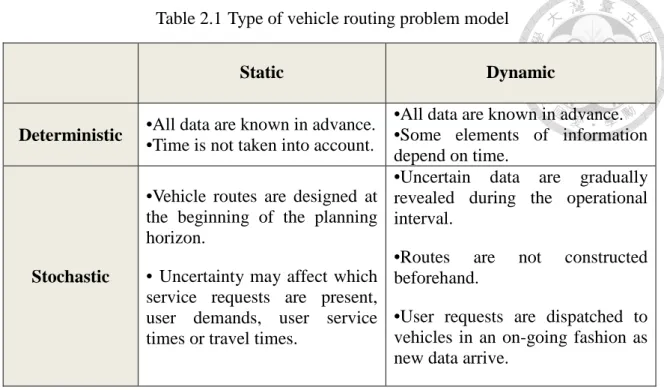
G. Ghiani et al. (2003) defined that Vehicle Routing Problem which usually used to dispatch vehicles can also divide into static and dynamic model, and the way to distinguish them is if their parameters depend on time. In addition, the model can be divided into two groups depending on the uncertainty. The following Table 2.1 is made according to G. Ghiani et al.’s study. In real-time condition, the traffic volume and the positions of response team depend on time and all data are known in advance, so this study attempted to build a model belonging to deterministic and dynamic model. The next segment of this chapter will introduce dynamic model and related theses.
Table 2.1 Type of vehicle routing problem model
2.3.2 Dynamic Model
Real-time demands or incidents should be input into dynamic models, and the travel time affected by traffic conditions should be considered. Moreover, the dynamic model should be solved as fast as possible to avoid increasing incident response time.
Recently the development and application of mathematical programming and algorithm utilizes solutions and fastens the solving speed. We began to review studies related to dispatch problem on freeway network and found a study used First Called, First Served to get the initial solution of vehicle routing problem and then used Tabu search algorithm at regular intervals to improve the solution. The simulation result confirmed the model shorten the total travel time of vehicles. (S Ichoua et al., 2003) Some studies attempted to propose their own model to dispatch response teams, H Zhao et al. (2009) developed dynamic dispatch model in which they considered priority of incidents, reassignment of vehicle teams and processing time constraint. However, the flexible model cannot schedule the dispatch order of incidents for each team, so they assumed that each response team should return to the stationary point before processing the next
Static Dynamic
Deterministic •All data are known in advance.
•Time is not taken into account.
•All data are known in advance.
•Some elements of information depend on time.
Stochastic
•Vehicle routes are designed at the beginning of the planning horizon.
• Uncertainty may affect which service requests are present, user demands, user service times or travel times.
•Uncertain data are gradually revealed during the operational interval.
•Routes are not constructed beforehand.
•User requests are dispatched to vehicles in an on-going fashion as new data arrive.
incident. H Deqi et al. (2012) also provided the framework of freeway incident response and used dynamic shortest path algorithm to calculate travel time and plan vehicle routes in real time, but they did not focus on the dynamic dispatch model. Therefore, we turned to other area like logistics, transfer transportation, emergency medical service and emergency supply transportation to learn how they designed dynamic vehicle dispatch models in different assumption and conditions.
Logistics is one of the issues in vehicle routing problem. In order to satisfy customers’ need, some goods have to be delivered to customers in limited time.
Therefore, MS Daskin et al. (1992) put time as a parameter into the real-time vehicle routing problem model and added some time window constraints, and he also developed heuristic algorithm to increase solving speed.
Warren B. Powell (2000) studied driver characteristics and operation rule of vehicle team and developed a mathematical model, which he proposed two adaptive labeling algorithms to solve, and he used a rail transfer case to compare the quality and speed of the algorithms.
A Haghani et al. (2004) made use of real-time traffic data and travel time data and connected with dynamic shortest path algorithm to propose a flexible dispatch model of emergency medical vehicles. They distinguished ambulances and incidents by giving different weights and constraints in the model, and they also classified and assigned numbers to conditions of vehicle teams. The flexible model can reassign vehicles teams or change routes to avoid congestion road and decrease the travel time of the medical vehicle teams because it keeps tracking the conditions and positions of response teams.
Their research used simulation to confirm the effectiveness of the model and used sensitivity analysis to observe the influence of parameters.
Another research discussing the emergency supply transportation problem under
large disasters, they developed a multi-period dynamic model to solve multi-OD pairs and network uncertainty problem, and used hybrid genetic algorithm to fasten the solving time. (X Ren et al., 2012)
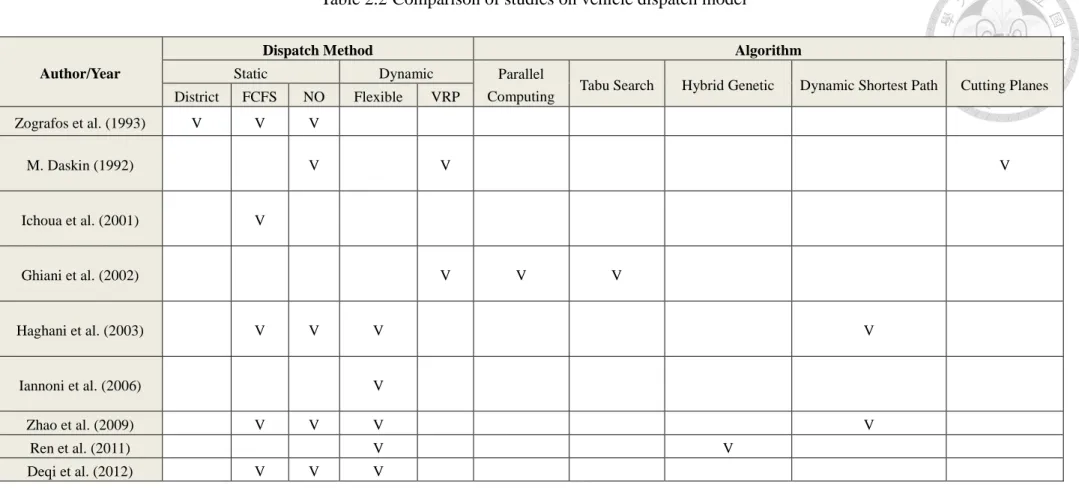
We made Table 2.2 to arrange previous studies and divided them with dynamic or static and using algorithms, see Table.
To be more realistic and after reviewing former studies, this study chose to develop a dynamic vehicle routing problem model because it is flexible and can do vehicle scheduling, and we will also consider parameters and methods such as the priority of incident types, conditions of response teams, shortest path algorithm and response team reassignment constraints according to previous studies to design our model. The full model would be introduced in CHAPTER 3.
Table 2.2 Comparison of studies on vehicle dispatch model
Author/Year
Dispatch Method Algorithm
Static Dynamic Parallel
Computing Tabu Search Hybrid Genetic Dynamic Shortest Path Cutting Planes District FCFS NO Flexible VRP
Zografos et al. (1993) V V V
M. Daskin (1992) V V V
Ichoua et al. (2001) V
Ghiani et al. (2002) V V V
Haghani et al. (2003) V V V V
Iannoni et al. (2006) V
Zhao et al. (2009) V V V V
Ren et al. (2011) V V
Deqi et al. (2012) V V V
2.4 Summary of Literature Review
In this study, we reviewed literatures which focused on how to enhance the efficiency of freeway incident response and reduced the vehicle delay on freeways.
Incident management studies introduced the system framework of incident response and the operation procedures of response team that helped this study build the model more practical. The contribution of incident analysis studies finding key factors of incident processing time and analysis of response strategies, which can suggest this study for setting parameters. In order to build a model which can plan routes and schedule the order of incidents for response teams, we not only consulted flexible dispatch models for freeway network but also took models about logistics, medical vehicle and transferring vehicle as reference, and choosing to develop vehicle routing problem model to be our basic dispatch model for freeway network. The expectation contributions of this study are listed below:
(1) Proposing a dynamic model and its operation framework:
The time-dependent traffic volume should be considered in the dispatch model because it affects the travel time of response teams. As a result, this study provides a procedure to renew the vehicle speed of each freeway segment and the positions of response teams when solving the model. To insure the model is flexible but not over-altered, this study adds some constraints in the model to avoid reassign response teams frequently. The freeway managers can use the concept of this study to build a real-time decision support system to help dispatcher dispatching response teams in the future.
(2) Decreasing total response time for response teams:
According to previous studies, the duration of incident decides the delay of freeway
traffic volume. This study focuses on shortening the total response time of incidents, so the main objective of the model is to minimize the total response time. By considering travel time of response teams and the priority of incident, the solution of the model provides dispatch suggestions that making response teams arrive at all the locations of incidents as fast as possible and reduce the delay on freeways.
Our study will use the history dispatch data and traffic volume data on Northern Taiwan Freeway Network as a case study, which inputs incident positions, occurrence time and real-time traffic volume into the model to get the solution, and comparing with static dispatch model using recently. In addition, we also observe the influence of changing priority and reassignment parameters by doing sensitivity analysis.
Chapter 3 Methodologies and Modeling Approaches
This chapter goes deeper into details of this study with four sections. Section 3.1 states the problem that researchers face in this area recently and proposes the method used to overcome the challenge. Section 3.2 introduces the response procedure from incident occurrence to incident clearance and illustrates a scenario of the incident response. Then it presents the framework of operation design for the incident response system. The last section elaborates the proposed VRP model; the first part includes all assumptions, the second part introduces the variables and parameters, and the final part explains the objective function, constraints and the concept of the proposed model.
3.1 Problem Statement
It is complicated to dispatch response teams, as the dispatchers on the dispatch platform should consider various factors when to decide which team should be assigned to deal with the incident and which route the team should follow, such as positions and types of incidents, the associated direction and traffic condition on the freeway. These factors would affect the travel time of response teams. If several incidents occur within a short period in nearby areas, the dispatchers would have difficulty to make decisions, and such a condition usually happens in the peak hours and holidays according to the historical dispatch data. If there is a supporting dispatch system, which can gather real-time traffic data and process the information of incidents and response teams to quickly provide high-quality suggestions, the dispatchers only have to input relevant parameters through the user interface. Then, the system will feedback the dispatchers suggested teams and routes, which can enable them to make rational and more efficient
assignment decisions.
To establish the decision supporting system, the crucial work is to form a model that provides necessary functions. Although some previous studies have investigated the concept of incident response system and dispatch strategies for freeways, however, they may not adquately consider parameters in environments changing over time. In addition, the strategies they suggested are heuristic solutions and still have much room to improve solution quality. On the other hand, some studies in other application areas such as logistics and medical service that have already developed dynamic dispatch models, but for freeway incident response dynamic dispatch is still rarely studied or implemented in practice. Some models are too complicated so that it may take much time to solve the problem, and some do not include considerations related to reassignment limits, scheduling, preparation time based on conditions of response teams, which are needed in reality. These defects may influence the efficiency of incident response, especially when there are several incidents on freeways simultaneously.
As a result, there is the need to develop a dynamic incident dispatch model for freeway management so that it can help the dispatcher assign response teams in real time and enhance the efficiency of incident response. According to previous studies, we propose the dynamic incident dispatch model for freeways as a multi-depot vehicle routing problem (MDVRP), which can meet operational needs and is flexible for adding model constraints corresponding to practical concerns. Thereby, this study proposes an operational framework for incident response and a dynamic multi-depot vehicle routing problem , where realistic considerations are reflected in the mathematical formulation.
3.2 Operation Design for Incident Response
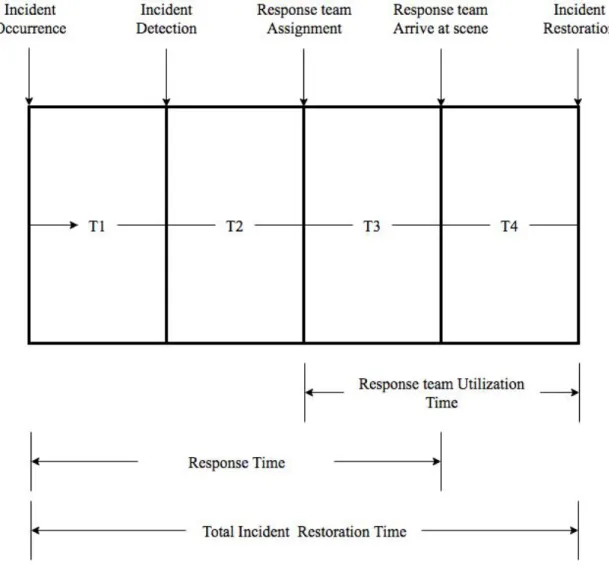
In order to design an incident response system and the associated dispatch model, we need to understand the role of incident dispatch and the timing to use the decision support system for incident response first. Dispatching a response team is one of the components in freeway-incident duration time. Zografos et al. (1993) shows the total remedy time by Fig. 3.1. The total remedy time is divided into four intervals in this figure. The first interval is T1 “Detection and Identification time”; it is the time interval from the time of incident occurrence to the time that the incident-management center is notified the incident type, position and severity. The sources of notification can be the freeway police, drivers, victims, monitors or even managers of the incident-management center. The second interval is T2 “Dispatch time”; it is the time between incident detection and the time that the incident is assigned to a response team.
The dispatcher in the freeway-management center will firstly use CCTV (a camera on freeway) near the position of the incident to confirm the information from the source after receiving a notification, and then the dispatcher will input the parameters into the dispatch model through a user interface. The model solution will return suggestions regarding response team and route assignment to the dispatcher, and the dispatcher will make a final decision and contact the response team chosen. The third interval is T3
“Preparation and Travel time”; this is the time that the response team needs to arrive at the location of the incident from its previous position. This time is composed of preparation time and travel time. Before the response team departs to the location of the incident, the team should check workers and equipment or complete the duty of the current incident restoration; this period is named preparation time. The last interval is T4 “Clearance time”; this is the time that the response team spends on clearing the
incident at scene. The worker must record the time and the condition at scene and send it back to freeway-management center as the dispatch data via an on-board unit of the incident response system.
Zografos et al. (1993) mentioned that reducing of any component of remedy time can decrease the incident delay on freeways. In this study, the main objective is to minimize the incident response time, which includes T1, T2 and T3, and we focused on how to support the dispatcher to make decisions faster and provide better suggestions that can enable response teams to arrive at the locations of incidents as quick as possible.
Fig. 3.1 Components of Freeway-Incident Duration Time
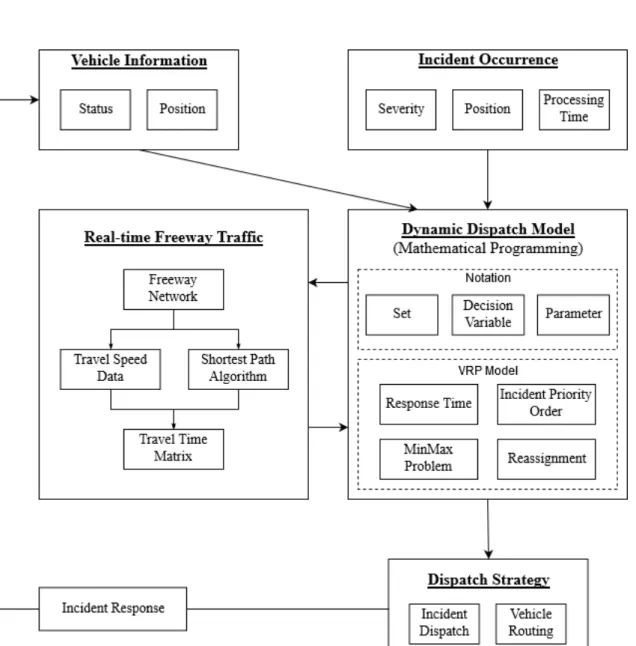
Based on the background knowledge of freeway-incident duration time, this study designs the operation procedure of the incident dispatch system and shows it in
Fig. 3.2. A scenario that triggers the procedure starts from one or some incident notifications received by the dispatch platform. After the dispatchers check the incident and obtain enough information, they need to input required parameters into the dynamic dispatch model. The source data of the parameters can be divided into three groups, Vehicle Information, Incident Occurrence and Real-time Freeway Network Traffic.
The introduction of these groups of data is in the following:
(1) Vehicle Information
The data of vehicle information contains the status and the position information. The vehicle position information can be collected by GPS devices. The vehicle status information, which indicates if the team is currently on duty, can be acquired through communicating with the response team. In practice, response teams need preparation time to check workers and equipment before they leave their stationary points. On the other hand, if a response team currently processing an incident is assigned another incident, the team needs time to clear the current one. In the model, these two statuses (at the stationary point or processing an incident) of response teams are calculated as waiting time, which means the interval between the time that a response team is assigned an incident and the time that this response team actually departs to the location of incident. The dynamic dispatch model has to calculate the total response time based on the status and position information of response teams upon the moment that the
notification of an incident is received.
(2) Incident Occurrence
Incident information contains severity, positions and estimated processing time of an incident. The severity of incident may be of high, medium and low levels according to the incident type and the conditions at the scene, and the dispatcher will judge the severity level after integrating the information they receive. The position of the incident is related to the travel time in the model, and it is taken as the node in the virtual network used for formulating the problem. This study uses average processing time of each incident type as the estimated processing time in the proposed.
(3) Freeway Network Traffic
The freeway network including interchanges and stationary points of response teams should be constructed first. Traffic data every hour on the freeway are collected and a travel time matrix over the network made by using the shortest path algorithm and traffic data of the network to calculate the travel time between every node pair. The model can retrieve travel times of links through an inquiry function from the matrix when it is building the virtual network of response teams and incidents.
After the dispatcher inputs the value of the parameters, the dynamic dispatch model starts a solution process to determine the optimal assignment. This model seeks to handle all incidents in the freeway network with the minimum response time and must not violate the constraints. This model considers the incident priority order, reassignment and presents them in a minimax problem. The details of notation, formulation and the concept used in the model are explained and discussed in next section.
The output of the model is the dispatch strategy, including the assignment of each incident assigned to an appropriate response team and the associated route. The incident
dispatch result upon the notification of a new incident will be stored and used as the parameters for the problem of the later incident.
Fig. 3.2 Operation Design for Incident Response
3.3 Model Development
This study develops the dynamic dispatch model based on the multi-depot vehicle routing problem, which is able to route response teams at different locations to handle all the incidents in the freeway network in a round-trip for each team and minimize the cost of the total response time. Each response team processes incidents assigned to it according to the schedule determined by the dispatch platform so that response teams can still work efficiently even though there are many incidents waiting to be processed.
Other than the incidents under or waiting for processing, new incidents may appear anytime and anywhere in the freeway network and response teams may have to depart from their current locations to process the newly reported incidents. If the nodes of the model, which are composed by the positions of response teams and incidents, change with time, the routes of response teams may also change to satisfy new incident response demand. Therefore, the model must be designed in a dynamic context to adapt changes in reality. This study divides the time horizon into small intervals, and a new stage will be established if one or many incidents occur in an interval.
In a new stage, the travel time for a response team to arrive at an incident is different from the former stage, so the dispatch decision may also change. If an incident assigned to a response team in the former stage is assigned to other response team in a
later stage, the workers may become confused due to such a reassignment. As a result, we need to formulate constraints to contain this situation in dispatch model. To develop the model, some assumptions are first introduced to construct freeway network and to meet the requirement of vehicle routing problem before we proceed the mathematic formulation of the model.
3.3.1 Assumptions
There are six assumptions made for model development:
i. Response teams only use the freeway network to travel to the locations of incidents;
ii. The travel speed of response team is limited to the speed of large-sized vehicles and the travel speed of shoulders on freeways;
iii. The time required for a response team to change direction by using any interchange is set equal;
iv. The preparation time of each response team at the stationary point is equal;
v. An incident must be processed by one response team;
vi. A response team can serve another incident without going back to its stationary point.
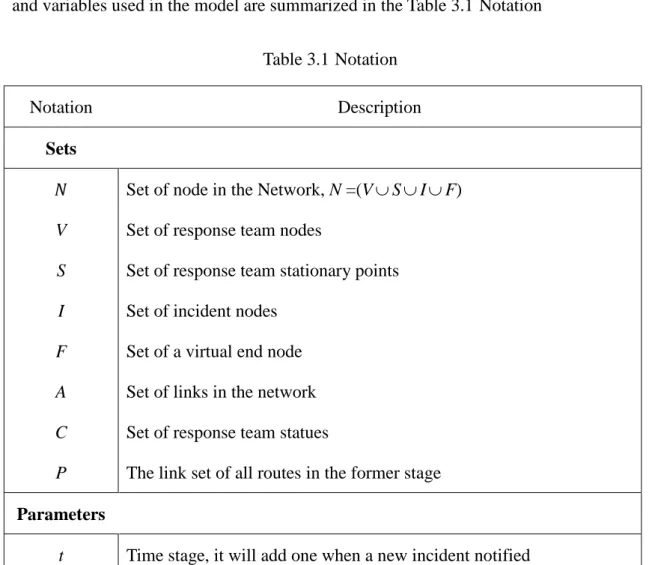
3.3.2 Notation
The network of vehicle routing problem is represented with a graph G (N, A) with node set N and link set A. The node set consists of three types of subsets: the subset of response team nodes V, the subset of incident nodes I and a virtual end node F, which is a dummy node connected to all nodes with links of zero travel time. Response teams have their corresponding stationary points which are represented as a set S. Each link (i, j)∈ A is characterized by its link travel time. The network notation, sets, parameters and variables used in the model are summarized in the Table 3.1 Notation
Table 3.1 Notation
Notation Description
Sets 𝑁𝑁 V S I F A C P
Set of node in the Network, N =(V∪S∪I∪F) Set of response team nodes
Set of response team stationary points Set of incident nodes
Set of a virtual end node Set of links in the network Set of response team statues
The link set of all routes in the former stage Parameters
t Time stage, it will add one when a new incident notified
𝑃𝑃𝑖𝑖 𝑇𝑇𝑇𝑇𝑖𝑖𝑖𝑖(𝑡𝑡)
𝑤𝑤𝑘𝑘(𝑡𝑡)
𝑃𝑃𝑇𝑇𝑖𝑖𝑖𝑖 𝑃𝑃𝑇𝑇𝑘𝑘0
𝑃𝑃𝑃𝑃 𝑉𝑉𝑘𝑘𝑘𝑘
𝜏𝜏 𝑃𝑃𝑘𝑘0
𝐵𝐵1
𝐵𝐵2
The weight of priority order of incident i
The travel time cost from node i to node j at time stage t
The waiting time interval between current time and depart time of response team k at time stage t.
The processing time cost from node i to node j
The remaining processing time cost of the last incident processed by response team k
The average preparation time for response teams The initial status of response team k, if
c = 0, the response team k is waiting at its stationary point c = 1, the response team k is moving to an incident location c = 2, the response team k is processing an incident
c = 3, the response team k is going back to its stationary point The weight of response team reassignment
The number of reassigning response team k; it would be zeroed after response team k goes back to stationary point.
A large value A large value Variable
𝑌𝑌𝑖𝑖𝑖𝑖𝑘𝑘(𝑡𝑡)
𝑃𝑃𝑘𝑘 (𝑡𝑡)
𝑧𝑧
Binary variable, if response team k is not assigned to pass through link (i, j) both on current time stage t and its former stage, 𝑌𝑌𝑖𝑖𝑖𝑖𝑘𝑘
equals to 1; otherwise, it equals to 0.
Binary variable, if any 𝑌𝑌𝑖𝑖𝑖𝑖𝑘𝑘 in the route equals to 1 for response team k at time stage t, 𝑃𝑃𝑘𝑘(𝑡𝑡) equals to 1 ; otherwise, it equals to 0.
Continuous variable, this variable is equal to the largest total operation time of a response team.
𝑋𝑋𝑖𝑖𝑖𝑖𝑘𝑘 (𝑡𝑡) Binary variable, if response team k is assigned to pass through link (i, j) at time stage t, 𝑋𝑋𝑖𝑖𝑖𝑖𝑘𝑘 equals to 1; otherwise, it is 0.
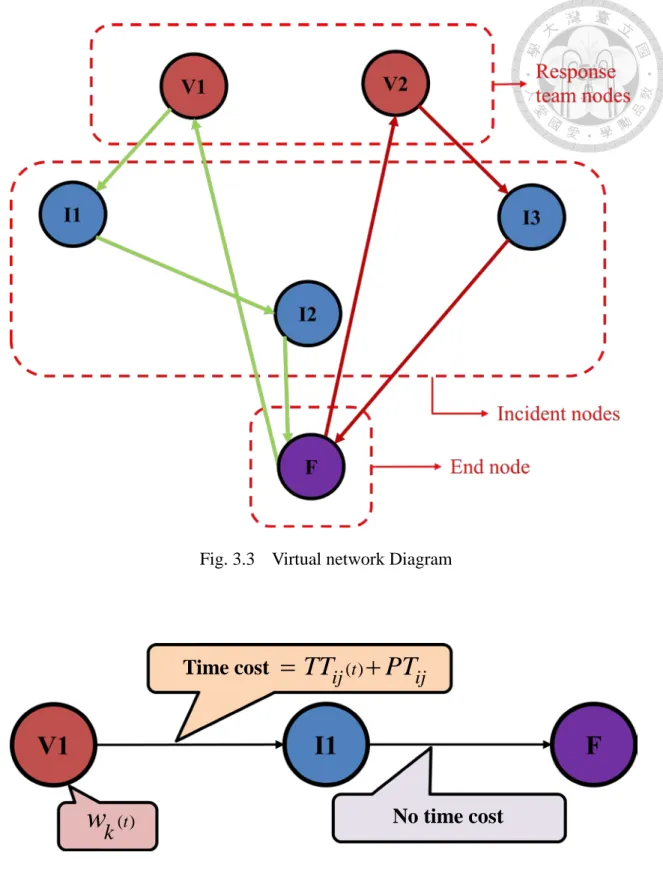
Fig 3.3 shows the virtual network composing of nodes V, I and F, and the green line and red line are the possible routes the response teams may go along. The locations of the response team nodes may change in different time stage, as response teams move to other places. The number of incident node may change in different time stage, as new incident occurs and previous incident cleared. That all routes have to go to the end node and return to its origin means response teams will go back to the stationary points after they clear all incidents in their routes. Fig. 3.4 Time cost on nodes and links illustrates that we put waiting time 𝑤𝑤𝑘𝑘(𝑡𝑡) on the response team nodes and travel time and incident-processing time on the links connecting to incident nodes, and the links from incident nodes to the virtual end node have no time cost. We will discuss more details and concepts of formulations in the next section.
Fig. 3.3 Virtual network Diagram
Fig. 3.4 Time cost on nodes and links
Time cost = TT
ij( )t+ PT
ij( )t
w k No time cost
3.3.3 Problem Formulation
The aim of vehicle routing problem is to assign vehicles to meet all demand in the minimum time or cost. However, the major objective is to minimize the total response time of incidents in this study. The response time introduced in previous chapter consists of preparation time and travel time, but we should also consider the processing time as response teams may process more than one incident in a round-trip. Therefore, the objective function for each time stage is written as:
( ) ( ( ) )
( ) (
0( ) )
( )
V
I V V
ijk i ij ij
i N j N k
ijk k k
i S j k k k
t t t
t t
Min Z z N
N N N
X P TT PT
w X R R
α β
τ
∈ ∈
∈
∈ ∈ ∈ ∈
× × +
= × + ×
+ × + ×
∑ ∑ ∑
∑ ∑ ∑ ∑ +
(2.1)The objective function (2.1) can be defined as the summation of two parts: (i) the longest total operation time of a response team: the longest time of a response team to finish processing the latest incident, and (ii) the total operation time of all response teams: the total operation time of a response team which include preparation time, travel time, processing time and reassignment punishment. These two parts have different weights α andβ , and α β . Both the first part first and the second part would be satisfied simultaneously.
If several incidents are closer to a response team, the dispatcher may assign all these incidents to this team. Nevertheless, even though it is reasonable, incidents that
sorted later are processed by response teams after incidents sorted former are cleared, so the response time of incidents sorted later may be comparatively long. Hence, we design a minimax method by including the first part of objective function and combining it with Constraint (2.2) to minimize the upper limit of the total operation time of each response team.
( ) ( ( ) )
( )( ) ( 0 ( ))
,
S
ijk i ij ij k ijk k
i N j N i j N
t t t t t z
N k k V
w R
X P TT PT X
τR
∈ ∈ ∈ ∈
× × + + × + × ≤
∀ ∈
∑∑ ∑ ∑ +
(2.2)
The value of variable z must be larger or equal to the total operation time of each team. By adding this part in the objective function and including Constraint (2.2), the model may dispatch other response teams to support the response team which is close to several incidents to decrease the total response time. In addition, the work loading can be more balanced over each response team as the incidents will not be assigned to few response teams only based on distance.
To calculate the total operation time of each response team, we divided it into three parts: (i) travel and processing time: the travel time between nodes and the duration of processing incidents, (ii) waiting time: each response team has a waiting time before it can depart from its original location to the assigned incident, and (iii) reassignment punishment: the punishment time if the incident is assigned to a response team which is
not the same as the one in the former stage. The first part calculates the time cost over the used links, and we weight incidents with a priority order according to their types.
Based on the experience of the dispatchers, and the priority order is divided into three levels: high, median and low, and each level has its corresponding value. The high level means that the incident may cause serious congestion and longer delay. The median level incidents may influence the traffic and further cause an accident. The low level incidents may not affect traffic, but it still involves safety risk. If the incident has higher priority order, it should be processed as quickly as possible. This priority order can help the dispatcher assign response teams to process incidents with higher influence to traffic first and decrease overall delay on the freeway.
The second part sums the waiting time of all response teams. Each response team will be of a status(V )when a new stage is established. There are four statuses that a kc response team can be, and a response team will have waiting time only when it is waiting at its stationary point or it is processing an incident. The leader of response team should check workers and equipment before leaving its stationary point for the assigned incident. Also a response team must finish clearing the incident it is currently processing before going to process another one. These two kinds of waiting time are calculated in Constraint (2.3).
0 2
( ) 0k,
k t PR k V
k k
w
=V
× +V
×PT
∀ ∈ (2.3)The third part limits the number of assignment changes across stages. In Constraint
(2.4), if a link is not chosen for response team k in the previous stage,
X
ijk( )
t−1 willbe zero, and
Y
ijk will be one. Then, Constraint (2.5) sums allY
ijk to determine if any link in each response team’s route is changed. If a link is changed,R
k will be one and multiplied with τ, which is the filter of reassignment. τ can be a constant or a flexibly be a value equal to the duration between last stage and next stage.Appropriately setting the value of τ can avoid the model changes route frequently across stages, which may cause confusion and negatively affects response teams.
( ) ( )
1( )
1−
X
ijk t ×X
ijk t− ≤1B Y
× ijk( ),t ∀ i j k, , ∈P (2.4)(, , ) 2
( ) ,
ijk k
i j k P
t k V
Y B R
∈
≤ × ∀ ∈
∑ (2.5)
Other constraints in the model are the basic constraints in the vehicle routing problem. Constraint (2.6) limits that only one response team will be assigned to process incident j from the stationary point or from the location of another incident, and Constraint (2.7) limits that a response team can only go to another incident location or the virtual end node. Constraint (2.8) is the constraint for flow conservation, which means the in-flow number of response teams equals to the out-flow number of response teams, and the response team must be the same one. Constraint (2.9) indicates that each team is assigned to process one incident one time from the stationary point. Constraint (2.10) means that each team goes back to the end node not more than one time.
Constraints (2.11) and (2.12) are the sub-tour elimination constraints that are capable to remove all sub-tours in the solution space.
( )
,
1, ,
S I
ijk I
k V i
t j i j
N N
X N
∈
∈
= ∀ ∈ ≠
∑ ∑
(2.6)( )
,
1, ,
I F V
ijk I
j k
t i i j
N N N
X N
∈ ∈
= ∀ ∈ ≠
∑ ∑
(2.7)( ) ( )
0, ,ihk hjk
i N i N
t t h N k V
X X
∈ ∈
− = ∀ ∈ ∈
∑ ∑
(2.8)( )
1,S I
ijk
i j
t k V
N N
X
∈ ∈
≤ ∀ ∈
∑ ∑
(2.9)( )
1,S I
ijk
i j
t k V
N N
X
∈ ∈
≤ ∀ ∈
∑ ∑
(2.10)(
I) ( )
1, , , , ,V
ijk
i j S S I S I S I
k
t i j i j
u u N N
NX N N N N N N
∈
− + +
∑
≤ + − ∀ ∈ ∈ ≠(2.11)
0, 1 1
i i S I
u
≥ ∀ ≤ ≤N
+N
− (2.12)Chapter 4 Case Study
To confirm that the model can help the dispatchers more efficiently assign response teams and reduce the total response time, this study uses the real dispatch data of Northern Taiwan Freeway Network for the case study to test the model, which is detailed in the four sections of this chapter. We use Python as our tool to build the network and model and use Gurobi Optimizer as the solver to solve the model.
Section 4.1 introduces Northern Taiwan Freeway Network and the method to establish a simulation network for the case study based on the real dispatch data. In Section 4.2, we analyze test results and compare them with the original dispatch results to verify the effectiveness of the model. Section 4.3 reveals the influence of parameters to response time by changing values of parameters. Section 4.4 summarizes our findings from a series of tests.
4.1 Northern Taiwan Freeway System
Our case study focuses on the freeway system in Northern Taiwan, which is composed of four freeways (Freeway 1, Freeway 2, Freeway 3 and Freeway 5) and managed by North District Maintenance Engineering Sub-Bureau. The total length of this freeway system is about three hundred kilometers, and about fifty thousand vehicles
travels in the system per hour. There are nearby twenty thousand incidents occurring in this freeway system every year, and the number is growing. The Engineering Sub-Bureau divides this system into five duty areas, and each duty area is managed by a branch and deployed with one or two response teams to handle the incidents on the freeways. Fig. 4.1 shows the duty area for each branch and the locations of two control centers and eight stationary points of incident response teams. Table 4.1 displays the mileage of stationary point of each response team along the freeways.
Due to the number of incidents that continuously grows up every year, the Engineering Sub-Bureau distributed the assistance work of incident response to the control centers. The control centers started to check equipment and support operation of incident processing to increase work efficiency. In 2016, the Engineering Sub-Bureau started a Central Dispatch System at the control centers where a dispatch platform is established, and the dispatchers communicate with response teams to obtain the situations at the scene and accelerate the speed of incident response. The response teams on Freeway 1, Freeway 2 and Freeway 3 is dispatched by the control center at Taishan, and the response teams on Freeway 5 are dispatched by the control center at Pinglin.
According to the historic dispatch data, the incident response time decreases because Central Dispatch System can directly assign each response team to process incident or go to other duty areas to support other response teams.
Response team Freeway number Mileage
Xizhi Freeway 1 9
Wugu Freeway 1 33
Zhongli Freeway 1 55
Hukou Freeway 1 86
Mucha Freeway 3 21
Kansai Freeway 3 79
Pinglin Freeway 5 14
Touchen Freeway 5 30
Table 4.1 The mileage of stationary point of each response team Traffic control center
Response team stationary point Zhongli Branch
Neihu Branch
Kansai Branch
Mucha Branch
Toucheng Branch
Fig. 4.1 The duty areas of branches and locations of traffic control centers and stationary points of response teams
When an incident occurs, the dispatchers assign it to a response team according to the duty ranges of incident response teams. Fig. 4.2 presents the duty range of each response team using the lines with different colors. Different freeway directions are also distinguished by two lines, and the elevated freeways are separated from the surface one.
The boundaries of the duty ranges are located at interchanges for the consideration that the response teams can turn back faster by using these interchanges. Most of the incidents are assigned to response teams by this figure, but the dispatchers may assign a response team to support other response teams upon two conditions. The first condition is that a serious incident needing more than one response teams to handle occurs. The second condition is that the response team is too busy to handle all the incidents in its duty area. The dispatch for these conditions involves personal judgment and experience, and we cannot exactly understand all the dispatch rules. Each dispatcher may have different ways to assign response teams although there may be some common rules to follow. However, we still can compare the real dispatch results (in the historic data) with the dispatch strategies suggested by the proposed model. This study constructs a simulation freeway network and input the travel time according to the historic data.
Based on this simulation freeway network, we can calculate point-to-point travel time over the network and create the travel time matrix for the model.
4.1.1 Network
The simulation network is built based on map of major highways in Northern Taiwan, (see Fig. 4.3). This map shows the locations and mileages of interchanges and system interchanges. An interchange is a group of ramps connecting a freeway and a general road. A system interchange is a group of ramps connecting different freeways (either surface or elevated ones). The simulation network does not include Freeway 5 because the two response teams on Freeway 5 are purely under controlled Pinglin control center; the dispatch of these two response teams is separated from the others and
Fig. 4.2 Duty ranges of incident response teams
relatively straight forward. The freeways are divided into segments every two kilometers, and the middle points of segments and interchanges, frontage roads and the stationary points of response teams are regarded as nodes in the simulation network.
The nodes are connected with directional links, and the travel time of links is obtained from freeway traffic data base. The data base has travel time data from an interchange to the next interchange. In Table 4.2, the vertical axis is the time of a day, and the horizon axis is the road segment from an interchange to the next one. The values are the travel time of road segments for the associated time of day. In addition to general links, some links such as the travel time of link from a stationary point to a freeway node is set three minutes because the response team needs average three minutes to check workers and equipment before departing from the stationary point. A link passing through an interchange takes five minutes, and the link passing through a system interchange takes three minutes. Based on these settings, we can form the simulation freeway networks in different time of day. After establishing the network, we apply Dijkstra's algorithm to find the shortest path from a node to any other node and calculate the travel time.
Dijkstra's algorithm was proposed by Dijkstra, a Dutch computer scientist, in 1959. It solves the shortest path problem in directed graphs, finding the shortest path between two vertices. By employing Dijkstra algorithm over the simulation network, we can create the travel time matrix and enable the model to obtain the shortest travel time over