行政院國家科學委員會專題研究計畫 成果報告
分項計畫五:肺腺癌之環境因子及基因體毒理研究 —蛋白質
與肺癌及環境因子互動關係(子計畫三)
計畫類別: 整合型計畫 計畫編號: NSC91-3112-P-006-007-Y 執行期間: 91 年 05 月 01 日至 91 年 12 月 31 日 執行單位: 國立成功大學工業衛生科暨環境醫學研究所 計畫主持人: 廖寶琦 報告類型: 完整報告 處理方式: 本計畫可公開查詢 中 華 民 國 92 年 5 月 12 日計畫編號:
NSC 91-3112-P-006-007行政院衛生署九十一年度科技研究發展計畫
臺灣肺癌基因體研究及臨床應用:著重於女性肺腺癌-分項計畫五:肺腺癌之環境因子及基因體毒理研究 -蛋
白質與肺癌及環境因子互動關係(子計畫三)
研 究 報 告
執行機構:國立成功大學工業衛生科暨環境醫學研究所
計畫主持人:廖寶琦
研究人員:洪千雯、鄭貴紋、吳欣怡、陳邦維
執行期間:91 年 5 月 1 日至 91 年 12 月 31 日
**本研究報告僅供參考,不代表本署意見**
目
次
中文摘要… … … …
.. v
英文摘要… … … …
.vii
第一章 前言… … … …
..…. 1
第二章 材料與方法… … … …
...… 7
第三章 結果與討論… … … …
..11
第四章 結論與建議… … … …
..… …14
第五章 參考文獻… … … …
.… ….15
圖
次
圖 1
Six pairs of protein 2D GE pattern o
f control and BaP-treated
cells… … … …
19
圖 2 2D GE protein expression profiling of BEAS
-2B treated with
10M BaP for 48h
… ….… … … …...…..20
圖 3
The difference of the 2D GE protein pattern between control and
BaP-treated… … … …
..… …… … … … …
..21
圖 4
Six pairs of protein 2D GE pattern of control and
NNK-treated
cells… … … …
.… … … …
..22
圖 5 2D GE protein expression profiling of BEAS
-2B treated with
10M NNK for 48h… … … … …
.… … … …
..… … … … …
23
圖 6
The difference of the 2D GE protein pattern between control and
NNK -treated… … … …
.… …..… … … … …
..24
圖 7
Six pairs of protein 2D GE pattern of control and ttDDE-treated
cells… … …
.… … … …
.…..25
圖 8 2D GE protein expression profiling of BEAS
-2B treated with
10M ttDDE for 48h… … … …
.26
圖 9
The difference of the 2D GE protein pattern between control and
表
次
表 1 The 95% confidence interval of significant spots of BaP, NNK
and ttDDE treatment… … … …
..….28
附
錄
附錄一 Protein ID result of spot No. 36… … … …
...… ….30
附錄二 Protein ID result of spot No. 53… … … …
..…..31
附錄三 Protein ID result of spot No. 54… … … …
.32
附錄四 Protein ID result of spot No. 65… … … …
.…33
中文摘要
近年來台灣地區越來越重視女性肺腺癌的議題。慢性暴露於二手煙中所 含的許多致癌物質、空氣污染的主要成分多環芳香碳氫化合物 (PAH) 或是 食物烹調中的油煙都被認定是造成這種疾病的重要環境危險因子。在上述
的 環 境 危 險 因 子 中 , 有三 種 毒 性 化 學 物 質 時 常被 偵 測 到 含 有 高 含 量:
Benzo[a]pyrene (簡稱 BaP)、4-(methylnitrosamino)-1-(3-pyridyl)- 1-butanone (簡稱 NNK)、trans-trans-2,4-decadienal (簡稱 ttDDE),並且這些物質具有致 癌性。本計劃的目的是想要利用蛋白質體學的方法,研究這三種毒性化學 物質造成或是促進女性肺腺癌發生的生化機制。本研究的主要研究目標, 其一是以人類支氣管上皮細胞株 (BEAS-2B) 分別暴露這三種毒性化學物 質 BaP、NNK 與 ttDDE,並以二維膠電泳 (2D GE) 顯示受到暴露後細胞 內蛋白質量的變化情形。其二是當 BEAS-2B 細胞受到這些化學物質暴露 時,研究雌性激素對蛋白質表現情形的影響。其三是利用質譜儀鑑定出至 少九個(每一種化學物質三個)可能的生物指標的蛋白質身份。其四是收 集肺癌病人的組織,以免疫試驗的方法,確定這些蛋白質成為生物指標的 可行性。在這計劃的第一年,我們在實驗室建立了二維膠電泳的研究方法, 並且完成了三種化學物質分別處理在BEAS-2B 細胞上的 2D GE 的蛋白質圖 譜。我們發現受到 BaP 暴露的細胞,其 2D GE 的蛋白質圖譜中有五個蛋白 質的訊號呈現增加,有一個蛋白質的訊號呈現減少。而暴露於 NNK 的細 胞,也同樣發現有五個蛋白質的訊號是增加的,一個蛋白質的訊號是減少 的。對於受到 ttDDE 暴露的細胞,有二個蛋白質的量是增加的,一個蛋白 質的表現量是減少的。我們以質譜儀分析在 BaP 處理組中,有蛋白質表現 量 改 變 的 六 個 蛋 白 質 的 身 份 , 其 中 五 個 蛋 白 質 被 鑑 定 出 來 , 分 別 為 :
phosphoglycerate mutase 1、protein disulfide isomerase ER-60、triosephosphate isomerase、tryptophanyl-tRNA synthetase 與 26S protease regulatory subunit 7。
關鍵字:女性肺腺癌,蛋白質體學,質譜儀,人類支氣管上皮細胞株 (BEAS-2B),Benzo[a]pyrene,4-(methylnitrosamino)-1-(3-pyridyl)- 1-butanone,trans-trans-2,4-decadienal
英文摘要
The female lung cancer has recently been recognized as a major health concern in Taiwan. Chronic exposure of second-hand smokes containing various carcinogens, polycyclic aromatic hydrocarbons (PAHs) in air pollution, and cooking oil fumes, were considered as important environmental risk factors for this disease. Three toxic chemical compounds, benzo[a]pyrene (BaP),
4-(methylnitrosamino)-1-(3-pyridyl)- 1-b u t a n o n e ( N N K ) , a n d
trans-trans-2,4-decadienal (ttDDE), frequently detected in high quantity in aforementioned environmental risk factors, were shown to be carcinogenic. The objective of this project is to use proteomic experimental approaches to study the underlying biochemical mechanisms on how these three toxic chemical compounds may cause or promote female lung cancer. The specific aims of this project are: (1) To study the changes in protein expression profile in human bronchial epithelial BEAS-2B cells exposed to BaP, NNK, and ttDDE, using 2D-gel electrophoresis (2D GE) display. (2) To study the effects of estrogens on protein expression profile in BEAS-2B cells exposed to these toxic chemical compounds. (3) To identify by mass spectrometry at least 9 potential protein biomarkers (three for each toxic chemical compound) responded to these compounds. (4) To validate these potential protein biomarkers in tissue specimens collected from lung cancer patients using immunoassays. In the first project year, we have established 2D GE experimental setup in our laboratory. The 2D GE protein profiles of BEAS-2B cells were obtained before and after BaP, NNK, and ttDDE treatments. For BaP treatment, the levels of five proteins were considered up-regulated, and one was down- regulated. For NNK treatment, the levels of five proteins were considered up-regulated, and one was down- regulated. For ttDDE treatment, the levels of two proteins were considered
up-regulated, and one was down- regulated. Six 2D GE protein spots of which levels were found to be regulated by BaP treatment were subjected to mass spectrometry analysis for identification. The identities of five proteins were determined to be phosphoglycerate mutase 1, protein disulfide isomerase ER-60, triosephosphate isomerase, tryptophanyl-tRNA synthetase, and 26S protease regulatory subunit 7.
Keyword: female lung cancer, proteomics, mass spectrometry, BEAS-2B, benzo[a]pyrene (BaP), 4-(methylnitrosamino)-1-(3-pyridyl)- 1-butanone (NNK), and trans-trans-2,4-decadienal (ttDDE)
第一章 前言
The female lung cancer has recently been recognized as a major health concern in Taiwan. Chronic exposure of second-hand smokes containing various carcinogens, polycyclic aromatic hydrocarbons (PAHs) in air pollution, and cooking oil fumes, were considered as important environmental risk factors for this disease. Three toxic chemical compounds, benzo[a]pyrene (BaP),
4-(methylnitrosamino)-1-(3-pyridyl)- 1-b u t a n o n e ( N N K ) , a n d
trans-trans-2,4-decadienal (ttDDE), frequently detected in high quantity in aforementioned environmental risk factors, were shown to be carcinogenic. The objective of this project is to use proteomic experimental approaches to study the underlying biochemical mechanisms on how these three toxic chemical compounds ma y ca use or pro mote female lung cancer. The interaction of estrogens with the mechanism will also be studied to elucidate why females are prone to lung cancer. Based on the understanding of biochemical mechanisms derived from these efforts, discovery of novel diagnostic protein biomarkers will be attempted.
Female Lung Cancer in Taiwan and Potential Environmental Risk Factors
Lung cancer has become the leading cause of cancer death among women in
Taiwan since 1986. Although cigarette smoking is considered the most important cause of lung cancer, it cannot fully explain the high number of female lung cancer patients in Taiwan. Only 10% of female lung cancer patients smoke, where 86% of male lung cancer patients have a history of smoking (Ko et al., 2000). While an understanding of the causes of high lung ca ncer prevalence rate for females in Taiwan requires further investigation, various
potential environmental risk factors, in addition to smoking, occupational exposure to specific chemicals, and genetic characteristics, have been reported.
Three potential environmental risk factors, environmental tobacco smoke (ETS, i.e., second-hand smokes), air pollution, cooking oil fumes, and diet, are often noted (Hecht 1999; Jedrychowski et al., 1990; Ko et al., 1997; Liu et al., 1993; Tomatis, 1991; Tredaniel et al., 1994; Wu-Williams et al., 1990; Xu et al., 1989).
Benzo[a]pyrene (BaP), 4-(methylnitrosamino)-1-(3-pyridyl)-1-butanone (NNK), and trans-trans-2,4-decadienal (ttDDE)
Among the multiple components of tobacco smoke, 20 carcinogens have been shown to cause lung tumors in laboratory animals or human and they are likely to provide explanations for how direct tobacco smoke or environmental tobacco smoke (ETS) involves with lung cancer formation. Of these 20 carcinogens, polycyclic aromatic hydrocarbons (PAHs) and tobacco-specific N-nitrosamines are likely to play major roles. Benzo[a]pyrene (BaP) is the most extensively studied PAH compound, and its ability to induce lung tumors upon local administration or inhalation is well documented (Hecht 1999; IARC 1972; IARC 1983; Thyssen et al., 1981; Wolterbeek et al., 1995). Amo ng the N-nitrosamines, 4-(methylnitrosamino)-1-(3-pyridyl)-1-butanone (NNK) is a potent lung carcinogen in rats, mice, and hamsters. BaP and NNK are the only two compounds of the 20 carcinogens that induce lung tumors systemically in all three commonly used rodent models.
Six groups of carcinogens (specific PAHs, aza-arenes, NNK, metals, miscellaneous organic compounds, and free radicals/oxidative damage) have been evaluated for their relevance in human lung cancer induced by cigarette smoke (Hecht 1999). The criteria used for the evaluation included the presence
of the compounds in cigarette smoke, their pulmonary carcinogenicity in laboratory animals, their human uptake, metabolism, and adduct formation, and
their possible roles in caus ing molec ular cha nges in huma n ge nes. The evaluation indicated that PAHs and NNK demonstrated the strongest association
with the development of lung cancer (Hecht 1999).
Sidestream smoke, the material released directly into the air from the burning tip of a cigarette plus that diffuses through the cigarette paper, constitutes the major portion of ETS. BaP and NNK, among other four
carcinogens, were found in appreciable amounts in sidestream smoke (Guerin et al., 1992). The sidestream/mainstream ratios are 2.5-3.5 and 1-4 (far greater than 1) for BaP and NNK, respectively, while dilution with ambient air results that passive uptake is still less than uptake in a smoker.
BaP and NNK require metabolic activation to exert their carcinogenic effects (Cooper et al., 1983; Gelboin 1980; Hecht 1996; Hecht 1998). Bronchial epithelial cells, in addition to hepatic cells, were also shown to possess metabolic activation capacity for BaP and NNK (Mace et al., 1994; Van Agen et al., 1997). The major metabolic activation pathway of BaP is conversion to its
7,8-diol-9,10-epo xides ( BPD E). O ne o f the fo ur e na nt io me rs is highl y carcinogenic and reacts with DNA to form adduct at N2 of deoxyguanosine
(Bartsch 1996). The major metabolic activation pathway of NNK produces its ma i n me t a b o l i t e , -(methylnitrosamino)-1-(3-pyridyl)-1-butanol 4 (NNAL), by-hydroxy- lation (hydroxylation at the carbons adjacent to the N-nitroso group) (Hecht 1998). The -hydroxylation leads to the formation of two types of DNA adduct, methyl adducts (such as 7-methylguanine or O6-methylguanine) and pyridyloxobutyl adducts.
In addition to smoking habits, environmental air pollution is the main source of inhalation exposure to carcinogenic PAHs. In Taiwan, engine emissions
containing various PAHs from motorcycles and othe r auto mobiles are considered to be significant and may pose a serious health problem. Ueng et al.
benzo(g,h,I)perylene were detected in the organic solvent extracts of motorcycle exhaust particulates (MEPs).
From data collected an epidemiological case-control study, it has been suspected that exposure to fumes emitted from cooking oils, when not reduced by an extractor such as a fume hood, appeared to be an important risk factor for lung cancer in Taiwanese women nonsmokers (Ko et al., 1997). Another study provided experimental evidence and supported the epidemiological findings (Chiang et a l., 1997). I t was demonstrated that cooking oil fumes were mutagenic and contained several carcinogens including several PAHs, dibenz[a,h]anthracene (DB[a,h]A), benz[a] anthracene (B[a]A), and BaP.
Mutagenicity and identification of several mutagenic compounds in fumes from heating peanut oil have been documented (Wu et al, 2001). Oil prepared from roasted peanut (ROPO) contains a tasteful aroma and is popular in Taiwan. This oil is regarded as a “fume maker” because it has a smoke point at merely 100 C . o F o u r c o m p o u n d s ,t r a n s-trans-2,4-dec ad ie na l (ttDD E) , trans-trans-2,4-nonadienal, trans-2- d e c e na l, a nd t r a ns-2-undecenal, were identified in the cooking fumes found to be mutagenic. Among them, ttDDE, the largest portion (51.6%) in neutral fraction of methanolic extract from fumes of heating ROPO, was shown to have strongest mutagenicity. Furthermore, the ttDDE was reported to reduce cell viability, to reduce the cellular glutathione level, and to be involved in the beginning of DNA fragmentation in vitro (Nappez et al., 1996).
Emerging Proteomic Experimental Approaches
As the human genome project (HGP) is about to be completed in the near future, proteomic research is considered the next logical step to use the massive information generated by the HGP to understand how humans develop and function. It was predicated that the results of proteomic research would be
extensively applied to the elucidation of disease mechanism, diagnosis, and new
drug development (Godovac-Zimmermann and Brown, 2001; Gygi and
Aebersold, 2000; Pandey and Mann, 2000; Yates JR, 2000).
Proteomic research, or preteomics, refers to the studies of the preteome itself and the functional analysis of the proteins using technologies of large-scale protein separation and identification. The two key steps in proteomic research are the separation of proteins in a sample derived from cells or tissues, and their subsequent identification. The state-of-the-art technologies to accomplish these two steps are 2D gel electrophoresis separation and mass spectrometry for protein identification. Two-dimensional (2D) gel electrophoresis separates a mixture of proteins extracted from cells or tissues using isoelectro focusing (IEF) and sodium dodecylsulphate-polyacrylamide gel electrophoresis (SDS-PAGE) into several thousand visualized spots. 2D gel patterns derived from diseased cells or tissues can be compared with those in normally functioning states. Spots
of interest are excised from the gel and proteins are digested into peptide fragme nts by specific proteases suc h as tryps in a nd ana lyzed by mass spectrometry. The identification of protein spots on a 2D gel involves how data generated by mass spectrometry can be efficiently mapped to protein or DNA sequence databases.
The specific aims of this project are:
(1) To study t h e c hanges in protein expression profile (using 2D-gel electrophoresis display) in human bronchial epithelial BEAS-2B ce lls exposed to BaP, NNK, and ttDDE.
(2) To study the effects of estrogens on protein expression profile in BEAS-2B cells exposed to BaP, NNK, and ttDDE, to elucidate why females are prone to lung cancinogenesis.
(3) To identify by mass spectrometry at least 9 potential protein biomarkers (revealed in the 2D-gel electrophoresis display, 3 for each toxic chemical
compound) responded to these toxic chemical compounds.
(4) To validate these potential protein biomarkers in tissue specimens collected from lung cancer patients using immunoassays.
In the proposed plan, specific aim (1) was to be completed in the 1st-12th months of this project period. An additional 2D-gel electrophoresis system was to be established in the RI’s laboratory to carry out the experiments. A budget was requested in this proposal to purchase a 2D-gel electrophoresis system that allows performing multiple 2D-gel electrophoresis simultaneously and would be used for time-course and dose-response studies.
第二章 材料與方法
2.1 Cells culture and chemical treatmentThe human BEAS-2B cell lines were purchased from Food Industry Research and Development Institute(FIRDI, Taiwan), which were derived from human bronchial epithelial cell. The BEAS-2B cells were grown in 100 mm dishes using LHC-9 medium (Biofluid, Rockville, MD), at 37℃ in a humidified mixture of air: carbon dioxide (95:5) atmosphere. At ~70% of confluency, the cells were treated with 10M BaP, NNK, and ttDDE for 48 hours, respectively. The control groups were treated with DMSO for 48 h. All treatment experiments repeated six times.
2.2 Cell harvesting
After chemical treatment, cells were harvested using NP-40 lysis buffer. The adherent cells were washed twice with cold 1 × PBS, and then softly scraped off with 1 mL of NP-40 lysis buffer (50mM Tris [pH 8.0], 1% NP-40, 150mM sodium chloride and protease inhibitor cocktail) by rubber policeman. Cells were lysed in lysis buffer for another 30 min with gentle mixing at 4℃, followed by centrifugation at 13000 rpm for 20 min. And the supernatant was collected and stored at -20℃ until used. The protein concentration was determined using a Micro BCA protein reagent.
2.3 Sample preparation- Precipitation with TCA in acetone
BEAS-2B cell extract was solubilized in 11% TCA in acetone containing 20mM DTT, and kept for 15min on ice for complete protein precipitation. Following centrifugation (8500 rpm, 15 min), the supernatant was discarded and
washed pellet twice with cold acetone containing 20mM DTT*. After washing, pellet was dried at room temperature to remove residual acetone. The pellet was
solubilized in 500L rehydration buffer (6M Urea, 2M Thiourea, 2% CHAPS, 0.5% IPG buffer, bromophenol blue, 20mM DTT*)for 90 min, and the n centrifuged (13000rpm, 2h, 4℃). The supernatant was stored in aliquots at -20 ℃ until analyzed.
2.4 Two- dimensional gel electrophoresis
IEF was performed at 20℃ on the IPGphorTM Isoelectric Focusing system (Amersham Pharmacia Biotech, Uppsala; Sweden) according to the method described by manufacturer’s direction. The Immobiline Dry strips (18cm, pH 4-7; Amersham Pharmacia) were rehydrated in 350μL of the protein extract and focused according to the following protocol: (1) 30 V for 16 h (rehydration step), (2) 500 V for 1 h, (3) 1000 V for 1 h, and (4) 8000 V until 32000VHr were reached. Prior to the second- dimensional (SDS-PAGE on vertical), the IPG strips were equilibrated for 2× 15 min with gentle shaking in 10mL equilibrium
buffer (50 mM Tr is-HC l, p H 8 . 8 ; 6 M ure a , 3 0 % g l yc e ro l, 2 % S D S , bromophenol blue). DTT (1% w/v) was added to the first, and iodoacetamide (2.5% w/v) to the second equilibration step. The strips were then applied onto 12% SDS-PAGE gels and overlaid with 1% agarose. The second dimension electrophoresis were run on BioRad gel apparatus (Bio-Rad Laboratories, Sundbyberg, Sweden), running buffer was 25mM Tris (pH 8.8), 192 mM glycine, 0.1% SDS, and running condition was 15℃, 100 V constant voltage until the bromophenol blue dye front reached the bottom of the gel. Molecular weight markers were Broad Range, unstained markers (Bio-Rad, Hercules, CA, USA).
2.5 Protein visualization and image analysis
Proteins were visualized with silver staining. Gels were scanned (Umax, USA) and digitized at 300dpi using ImageMaster Labscan Version 3.0 software
compared by the ImageMaster 2D Elite software (Amersham Pharamacia Biotech, USA).
For spot detection, ImageMaster uses a specific detection algorithm where every pixel in the image is considered by constructing a matrix centered on each pixel. The algorithm compares the values on the outside of the matrix to those inside. If the average pixel value of the matrix is bigger than outside the matrix, the pixel at the center of the matrix is considered as part of spot. In the process of spot detection, four parameters need to be set, noise factor, operating size, sensitivity and background factor. For spot matching, we synthesized the master gel from 12 gels as reference gel. Spot intensity represented as normalized volume【(spot volume/ total spot volume)× 100】.
2.6 Data analysis
For ease of data processing, the intensities of undetected spots were assigned to silver-staining detection limit, which is the lowest value among the
12 gels. Because the between-run variations of protein expression were greater than the with-in run variations, we compared the ratio of protein expression in pairs (total: 6 pairs, 12 gels). Each protein spot had a set of six ratios, which were generated from six pairs (intensity of the chemical treated group/the
intensity of the control group). Following data transformation (ratio as logarithm r a t i o ) , a n e w t-distribution dataset symmetrical to zero was generated. Then we constructed the 95% confidence interval (95% C.I) of each dataset and compared to the genomic mean (GM) of the ratio value. When the GM is within the interval range, then the protein is not considered regulated with confidence. When the GM is above the interval range, the protein is considered down- regulated. When the GM is below the interval range, the protein is considered up- regulated.
2.7 In-gel digestion and protein identification by mass spectrometry
The protein spots of interest were excised, cut into small pieces, transferred into 1.5 mL polyethylene sample vial, and washed twice with deionizied water for 15 min. The gel pieces were destained by adding 1:1 solution of 30mM potassium ferricyanide and 100mM sodium thiosulfate, washed twice with deionizied water, dried under vacuum, rehydrated with 10 mM DTT/100 mM NH4HCO3 and incubated at 56℃ for 45 min. Once reduction was complete, the supernatant was discarded and 55 mM iodoacetamide/100 mM NH4HCO3 were
immediately added and incubated for 30 min at room temperature. After alkylation the supernatant was discarded and the gel pieces were washed twice
with 40% acetonitrile/0.1 M NH4HCO3 and twice with deionizied water. The gel pieces were again dried under vacuum and rehydrated in 20 μL of trypsin solution (Boehringer Mannheim, sequencing grade). Protein digestion was performed overnight at 37℃. The supernatant was removed and the gel pieces were extracted twice with 10 μL 50% acetonitrile. The extracts were combined, dried under vacuum centrifuge and stored at -20 °C until use.
The protein identity was determined using a API QSTAR Pulsar i instrument (MDS Sciex, Ontario, Canada) equipped with a nanoESI source. The peptide tandem-MS data were searched using PepSea software, against a h u ma n database (NCBI).
第三章 結果與討論
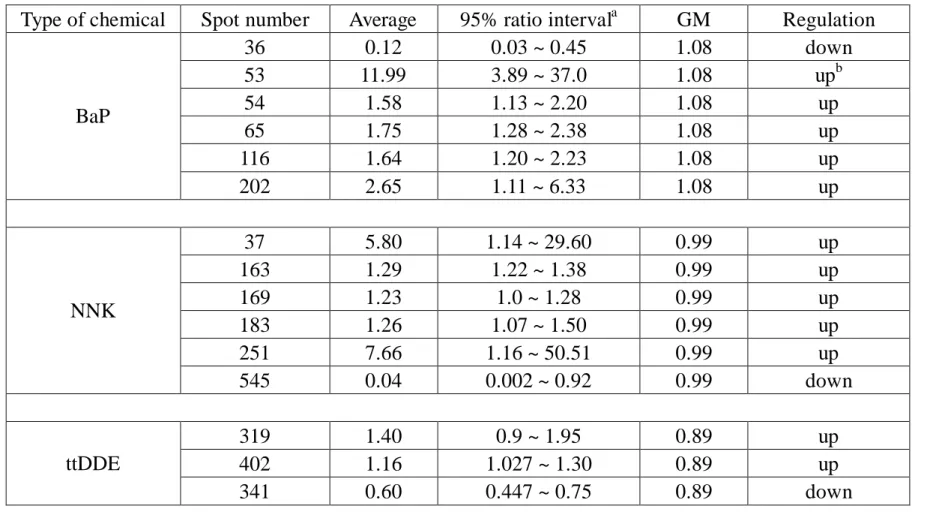
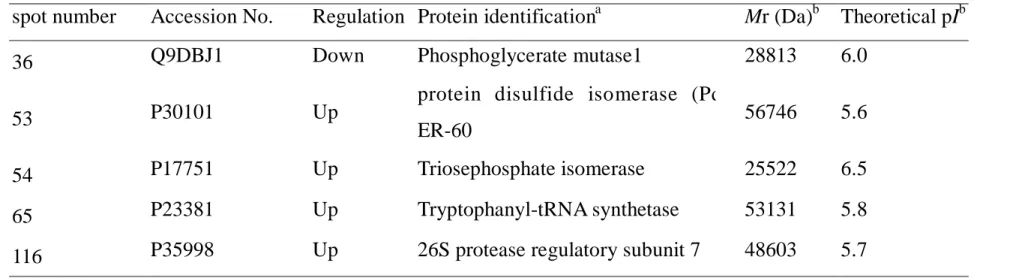
3.1 2D GE protein profiling of BEAS-2B cells before and after BaP treatment Figure 1 shows the six repeats of 2D GE of BEAS-2B cells, treated with 10M of BaP and its carrier control (DMSO), respectively. We observed that the between-run variations of silver-stained protein signals were found to be much greater than within-run variations w he n 2D GE were performed us ing a multiple-gel system, so we decided to compare the ratio of protein signals in pairs. More than 500 protein spots were detected on each 2D GE gel. Figure 2 is a 2D GE image derived from one of the BaP-treated 2D GE visualized with silver staining, in which 175gproteins were loaded onto the pH 4-7 strip. The horizontal axis represented the direction of isoelectric focusing (IEF), and the vertical direction separated protein according to the molecular weight. The boxes in Figure 2 were protein signals considered regulated with confidence, either up or down-regulated by the BaP treatment. Six proteins were revealed significant differences between the carrier control and BaP-treated group from the data analysis result, as displayed in Figure 3. Five of 6 were considered up-regulated, and 1 of 6 was down- regulated. Noteworthy, spot no.53 only appeared in the 2D GE when BaP was treated in BEAS-2B cells. Table 1 summarized the 95% confidence interval of these 6 regulated proteins treated with BaP. Due to the silver staining variation, in stead of value “1”, the genomic mean (GM) of “1.08” was calculated in this experiment. Five of the six proteins were identified by mass spectrometry as phosphoglycerate mutase 1, protein disulfide isomerase (Pdi) ER-60, triosephosphate isomerase (TIM), tryptophanyl-t-RNA synthetase and protease regulatory subunit 7, see Table 2
and the appendix. The molecular weight and the theoretical isoelectric point (pI) of the identified proteins were matched to those revealed on 2D GE, and the score of matched peptides were high, thus we had confident in protein identification result. But one protein (No. 202) was unable to be identified due to the low abundance.
3.2 2D GE protein profiling of BEAS-2B cells before and after NNK treatment Figure 4 shows six pairs 2D GE protein pattern obtained from BEAS-2B treated with 10M NNK for 48h. We observed that between-run variations of protein pattern were greater than the with-in run variations, so we compared the ratio of protein (spot) expression to minimized variation of between-run.
Figure 2 shows the 2D GE proteins pattern obtained from NNK-treated cell. Average of spot number of 12 gels about 400 ~500 less than treated with BaP 2D-exiperiment. Figure 6 shows difference of the 2D GE protein pattern between control (without NNK treatment) cells and NNK-treated cells. We also
found six proteins that have significant difference between control and experiment group by data analysis. The 95% confidence intervals of protein level changes were displayed in Table1. The levels of five proteins were up-regulated and one protein down-regulated.
3.3 2D GE protein profiling of BEAS-2B cells before and after ttDDE treatment Figure 7 shows six pairs 2D GE protein pattern obtained from BEAS-2B treated with 10M ttDDE for 48h. Figure 8 shows the 2D GE proteins pattern obtained from ttDDE -treated cell. Average of spot number of 12 gels about 300~400. Figure 9 shows difference of the 2D GE protein pattern between control (without ttDDE treatment) cells and ttDDE -treated cells. We found three
proteins that have significant difference between control and experiment group by data analysis. The 95% confidence intervals of protein level changes were
displayed in Table1. The levels of two proteins were up-regulated and one protein down-regulated.
3.4 Protein identification
By comparison protein expression levels betwee n control ce lls and BAP-treated cells, six different proteins were identified using 2D-PAGE and
mass spectrometry (Table 2) . They included among the identified proteins, two protein belong to the same protein family, known to be involved in protein synthesis and degradation.
第四章 結論與建議
In the first project year, we have established 2D GE experimental setup in our laboratory. The 2D GE protein profiles of BEAS-2B cells were obtained before and after BaP, NNK, and ttDDE treatments. For BaP treatment, the levels of five proteins were considered up-regulated, and one was down- regulated. For NNK treatment, the levels of five proteins were considered up-regulated, and one was down- regulated. For ttDDE treatment, the levels of two proteins were considered up-regulated, and one was down- regulated. These results were summarized in Table 1. Six 2D GE protein spots of which levels were found to be regulated by BaP treatment were subjected to mass spectrometry analysis for identification. The identities of five proteins were listed in Table 2.
第五章 參考文獻
Bartsch H. DNA adducts in human carcinogenesis: etiological relevance and structure-activity relationship. Mutation Research, 1996, 340, 67-69.
Chen, S.H., Sung, W.C., Lee, G.B., Lin, Z.Y., Chen, P.W., Liao, P.C. A
disposable poly(methylmethacrylate)-based microfluidic module for protein identification by nano-electrospray ionization tandem mass spectrometry.
Electrophoresis, 2001, 22, 3972-3977.
Chiang, T.A., Wu, P.F., Wang, L.F., Lee, H., Lee, C.H & Ko, Y.C. Mutagenicity
and polycyclic aromatic hydrocarbon content of fumes from heated cooking oils produced in Taiwan. Mutation Research, 1997.381(2), 157-61.
Cooper, C.S., Grover, P.L. & Sims, P. The metabolism and activation of
Benzo[alpha]pyrene. In Bridges J.W.Chasseaud,L.F. editors. Progress in drug metabolism. New York (NY): John Wiley & Sons; 1983.p 295-396.
Gelboin, H.V. Benzo[alpha]pyrene metabolism, activation and carcinogenesis:
ro l e a n d re g u l a t i o n o f m i x e d-function oxidases and related enzymes.
Physiological Reviews, 1980.60(4), 1107-66.
Godovac-Zimmermann J, Brown LR Perspectives for mass spectrometry and
functional proteomics. Mass Spectrometry Rveiew, 2001, 20, 1-57.
Goshe, M.B., Conrads, T.P., Panisko, E.A., Angell, N.H., Veenstra, T.D. & Smith R.D., Phosphoprotein isotope-coded affinity tag approach for isolating
and quantitating phosphopeptides in proteome-wide analyses. Analytica l
Chemistry, 2001, 73, 2578-2586.
Guerin,M.R., Jenkins, R.A. & Tomkins, B.A. The chemistry of environmental tobacco smoke: composition and management. Chelsea (MA): Lewis Publisher;
1992.
Gygi SP, Aebersold R Mass spectrometry and proteomics. Curr. Opin. Chem. Biol., 2000, 4, 489-94.
Hecht, S.S. Carcinogenesis due to tabacco: molecular mechanisms. In: Bertino JR, editor. Encyclopedia of cancer. San Diego (CA): Academic Press; 1996. p220-32.
N-nitrosamines. Chemical Research in Toxicology, 1998.11(6), 559-603.
Hecht, S.S. Tobacco smoke carcinogens and lung cancer. Journal of the National Cancer Institute, 1999.91(14), 1194-210.
International Agency for Research on Cancer (IARC). Certain polycyclic aromatic hydrocarbons and heterocyclic compounds. IARC Monographs on the Evaluation of Carcinogenic Risk of Chemicals to Man. Lyon (France): IARC, 1972. 3, p 45-268.
International Agency for Research on Cancer (IARC). Polunuclear aromatic compounds, part 1,chemical, environmental, and experimental data. IARC Monographs on the Evaluation of Carcinogenic Risk of Chemicals to Humans. Lyon (France): IARC, 1983. p 33-451.
Jedrychowski, W., Becher H. & Wahrendorf J. A case-control study of lung cancer with special reference to the effect of air pollution in Poland. Journal of Epidemiology & Community Health, 1990.44(2), 114-20.
Ko, Y.C., Lee, C.H. & Chen,M.J. Risk factors for primary lung cancer among
non-smoking women in Taiwan. International Journal of Epide miology, 1997.26(1), 24-31.
Ko, Y.C., Cheng, L.S.C., Lee, C.H., Huang, J.J., Huang, M.S., Kao, E.L., Wang, H.Z. & Lin, H.J., Chinese food cooking and lung cancer in women nonsmokers. American Journal of Epidemiology, 2000.151(2), 140-7.
Lewis, T.S., Hunt, J.B., Aveline, L.D., Jonscher, K.R., Louie, D.F., Yeh, J.M., Nahreini, T.S., Resing, K.A., & Ahn, N.G., Identification of novel MAP kinase
pathway signaling targets by functional proteomics and mass spectrometry.
Molecular Cell, 2000, 6, 1343–54.
Liu, Q., Sasco,A.J.& Riboli, E. Indoor air pollution and lung cancer in Guangzhou, People's Republic of China. American Journal of Epidemiology, 1993.137(2), 145-54.
Mace, K., Gonzalez, F.J., McConnell, I.R., Garner, R.C., Avanti, O., Harris, C.C. & Pfeifer, M.A. Activation of promutagens in a human bronchial epithelial cell
line stably expressing human cytochrome P450 1A2. Molecular Carcinogenesis,
1994.11(2), 65-73.
Nappez, C., S. Battu, & J.L. Beneytout, trans,trans-2,4-decadienal: cytotoxicity
Pandey A, Mann M. Proteomics to study genes and genomes. Nature, 2000, 405, 837-46.
Pandey A, Podtelejnikov AV, Blagoev B, Bustelo XR, Mann M, Lodish HF.
Analysis of receptor signaling pathways by mass spectrometry: identification of vav-2 as a substrate of the epidermal and platelet-derived growth factor receptors. Proc. Natl. Acad. Sci. U.S.A. 2000, 97, 179-84.
Thyssen, J., Althoff, J., Kimmerle, G. & Mohr, U. Inhalation studies with benzo[a]pyrene in Syrian golden hamsters. Journal of the National Cancer Institute, 1981.66(3), 575-7.
Tomatis, L. Outdoor air pollution and lung cancer. Annals of Oncology, 1991.2(4), 265-7.
Tredaniel, J., Boffetta, P. & Saracci, R. Exposure to environmental tobacco smoke and risk of lung cancer: the epidemiological evidence. European Respiratory Journal, 1994.7(10), 1877-88.
Ueng, T.-H., Hu, S,-H., Chen, R.-M., Wang, H.-W. and Kuo, M.-L. Induction of
cytochrome P450 1A1 in human hepatoma HepG2 and lung carcinoma NCI-H322 cells by exhaust particulate. J. Toxicol. Environ. Health, Part A, 2000,
60, 101-119.
Van Agen, B., Maas, L.M., Zwingmann, I.H., Van Schooten, F.J. & Kleinjans, J.C.S. B[a]P-DNA adduct formation and induction of human epithelial lung cell
transformation. Environmental & Molecular Mutagenesis, 1997.30(3), 287-92.
Wolterbeek, A.P., Schoevers, E.J., Rutten, A.A. & Feron, V.J. A critical
appraisal of intratracheal instillation of benzo[a]pyrene to Syrian golden hamsters as a model in respiratory tract carcinogenesis. Cancer Letters, 1995.89(1), 107-16.
Wu, S.C., Yen, G.C. & Sheu F. Mutagenicity and identification of mutagenic compounds of fumes obtained from heating peanut oil. Jo urna l o f Foo d Protection, 2001. 64(2), 240-245.
Wu-Williams, A.H., Da, X.A. & Blot, W. Lung cancer among women in north-east China. British Journal of Cancer, 1990.62(6), 982-7.
Xu, Z.Y., Blot, W.J.& Xiao, H.P. Smoking, air pollution, and the high rates of
lung cancer in Shenyang, China. Journal of the National Cancer Institute, 1989.81(23), 1800-6.
Yates JR 3rd. Mass spectrometry: From genomics to proteomics. Trends Genet., 2000, 16, 5-8.
Zhou, H., Watts, J.D. & Aebersold, R. A systematic approach to the analysis of
Fig1. Six pairs 2D GE protein pattern of control and BaP-treated cells (B: benz(a)pyrene,D:DMSO as control). 2D GE image of column mean that a pair.
SDS
-P
AGE
Fig2. 2D GE protein expression profiling of BEAS-2B treated with 10M BaP for 48h. The total amount of protein is 175g. The x-coordinate is pH gradient range from 4 to 7. The Y-coordinate is molecular weight of protein range from 15kDa to 250kDa. The red grids mean that protein signals were up-reguated and the blue one is down-regulated.
Fig3. The difference of the 2D GE protein pattern between control (with DMSO treatment) cells and BaP-treated. Following data analysis, we found five protein belong to up-regulation (red grid) and one is down-regulation (blue grid).
Fig4. Six pairs 2D GE protein pattern of control and NNK-treated cells (N: NNK,D:DMSO as control). 2D GE image of column mean that a pair.
SDS
-P
AGE
Fig5. 2D GE protein expression profiling of BEAS-2B treated with 10M NNK for 48h. Total amount of protein is 175g. The x-coordinate is pH gradient range from 4 to 7. The Y-coordinate is molecular weight of
protein range from 15kDa to 250kDa.The red grid mean that up-reguation and the blue is down-reulation.
Fig6. The difference of the 2D GE protein pattern between control (with DMSO treatment) cells and NNK-treated. Following data analysis, we found five protein belong to up-regulation (red grid) and one is down-regulation (blue grid).
Fig7. Six pairs protein 2D GE pattern of control and ttDDE-treated cells (T: ttDDE,D:DMSO as control). 2D GE image of column mean that a pair.
Fig8. 2-D protein expression profiling of BEAS-2B treated with 10M t,t-DDE for 48h. Total amount of protein is 175g. The x-coordinate is pH gradient range from 4 to 7. The Y-coordinate is molecular weight of protein range from 25kDa to 250kDa.The red grid mean that up-reguation and the blue is down-reulation.
Fig9. The difference of the 2-D protein pattern between control (with DMSO treatment) cells and
t,t-DDE-treated. Following data analysis, we found five protein belong to up-regulation (red grid) and one is down-regulation (blue grid).
402
319
341
Treated with t,t-DDE
Treated with DMSO
402
319
Table 1 The 95% confidence internal of significant spots of BaP, NNK and ttDDE treatment
Type of chemical Spot number Average 95% ratio intervala GM Regulation
36 0.12 0.03 ~ 0.45 1.08 down 53 11.99 3.89 ~ 37.0 1.08 upb 54 1.58 1.13 ~ 2.20 1.08 up 65 1.75 1.28 ~ 2.38 1.08 up 116 1.64 1.20 ~ 2.23 1.08 up BaP 202 2.65 1.11 ~ 6.33 1.08 up 37 5.80 1.14 ~ 29.60 0.99 up 163 1.29 1.22 ~ 1.38 0.99 up 169 1.23 1.0 ~ 1.28 0.99 up 183 1.26 1.07 ~ 1.50 0.99 up 251 7.66 1.16 ~ 50.51 0.99 up NNK 545 0.04 0.002 ~ 0.92 0.99 down 319 1.40 0.9 ~ 1.95 0.89 up 402 1.16 1.027 ~ 1.30 0.89 up ttDDE 341 0.60 0.447 ~ 0.75 0.89 down a
up-regulation: the protein over-expression of BEAS-2B following chemical treatment. Down-regulation: the protein over-expression of BEAS-2B following chemical treatment.
Table 2 Protein ID results treated with BaP in BEAS-2B cells
spot number Accession No. Regulation Protein identificationa Mr (Da)b Theoretical pIb
36 Q9DBJ1 Down Phosphoglycerate mutase1 28813 6.0
53 P30101 Up
protein disulfide isomerase (Pdi)
ER-60 56746 5.6
54 P17751 Up Triosephosphate isomerase 25522 6.5
65 P23381 Up Tryptophanyl-tRNA synthetase 53131 5.8
116 P35998 Up 26S protease regulatory subunit 7 48603 5.7
a
Protein identification was performed by MALDI-TOF b
附錄一 Protein ID result of spot No. 36
Matched pepides MW Charge
SYDVPPPPMEPDHPFYSNISK 2415.6642 3
ALPFWNEEIVPQIK 1682.6141 2
FSGWYDADLSPAGHEEAK 1978.437 3
1 MAAYKLVLIR HGESAWNLEN RFSGWYDADL SPAGHEEAKR
51 EFDICFTSVQ KRAIRTLWTV LDAIDQMWLP VVRTWRLNER
101 AETAAKHGEA QVKIWRRSYD VPPPPMEPDH PFYSNISKDR
151 PSCESLKDTI ARALPFWNEE IVPQIKEGKR VLIAAHGNSL
201 SEEAIMELNL PTGIPIVYEL DKNLKPIKPM QFLGDEETVR
251 KVKK
NO. 36
PHOSPHOGLYCERATE MUTASE 1
Nominal mass (Mr): 28813; Calculated pI value:6.0 Sequence Coverage: 20.9%
附錄二 Protein ID result of spot No. 53 M a t c h e d p e p i d e s M W C h a r g e D A S I V G F F D D S F S E A H S E F L K 2 3 4 7 . 4 0 7 8 3 F L Q D Y F D G N L K R 1 5 1 4 . 9 4 7 5 2 G F P T I Y F S P A N K 1 3 4 0 . 8 4 1 7 2 D L L I A Y Y D V D Y E K 1 6 1 9 . 0 0 8 7 2 M D A T A N D V P S P Y E V R 1 6 6 3 . 9 7 7 5 2 T F S H E L S D F G L E S T A G E I P V V A I R 2 5 7 4 . 6 6 3 6 3 E L S D F I S Y L Q R 1 3 6 9 . 8 6 1 2 F L Q D Y F D G N L K R 1 5 1 4 . 9 5 2 7 3 F V M Q E E F S R 1 1 7 1 . 6 8 0 3 2 F L Q D Y F D G N L K 1 3 5 8 . 8 1 7 7 2 1 M R L R R L A L F P G V A L L L A A A R L A A A S D V L E L T D D N F E S R I S D T G S A G L M L V 5 1 E F F A P W C G H C K R L A P E Y E A A A T R L K G I V P L A K V D C T A N T N T C N K Y G V S G Y 1 0 1 P T L K I F R D G E E A G A Y D G P R T A D G I V S H L K K Q A G P A S V P L R T E E E F K K F I S 1 5 1 D KD A S I V G F F D D S F S E A H S E F L KA A S N L R D N Y R F A H T N V E S L V N E Y D D N G 2 0 1 E G I I L F R P S H L T N K F E D K T V A Y T E Q K M T S G K I K K F I Q E N I F G I C P H M T E D 2 5 1 N K D L I Q G KD L L I A Y Y D V D Y E KN A K G S N Y W R N R V M M V A K K F L D A G H K L N F A 3 0 1 V A S R KT F S H E L S D F G L E S T A G E I P V V A I RT A K G E KF V M Q E E F S R 3 5 1 RF L Q D Y F D G N L K RY L K S E P I P E S N D G P V K V V V A E N F D E I V N N E N K D V L I E 4 0 1 F Y A P W C G H C K N L E P K Y K E L G E K L S K D P N I V I A KM D A T A N D V P S P Y E V R G F 4 5 1 P T I Y F S P A N K K L N P K K Y E G G R E L S D F I S Y L Q R E A T N P P V I Q E E K P K K K K K 5 0 1 A Q E D L N o . 5 3 N o m i n a l m a s s ( Mr) : 5 6 7 4 6; C a l c u l a t e d p I v a l u e : 5 . 6 S e q u e n c e C o v e r a g e : 2 1 . 0 % P R O T E I N D I S U L F I D E I S O M E R A S E A 3 P R E C U R S O R ( D I S U L F I D E I S O M E R A S E E R - 6 0 )
附錄三 Protein ID result of spot No. 54 M a t c h e d p e p i d e s MW C h a r g e H V F G E S D E L I G Q K 1 4 5 7 . 3 9 4 5 3 V T N G A F T G E I S P G M I K 1 6 2 0 . 4 6 4 2 2 V V L A Y E P V W A I G T G K 1 6 0 1 . 5 1 8 7 2 V V L A Y E P V W A I G T G K 1 6 0 1 . 4 6 2 9 3 H V F G E S D E L I G Q K 1 4 5 7 . 3 7 4 4 2 F F V G G N W K 9 5 3 . 2 6 5 1 2 1 A P S R KF F V G G N W KM N G R K Q S L G E L I G T L N A A KV P A D T E V V C A P P T A Y I D F 5 1 A RQ K L D P K I A V A A Q N C Y KV T N G A F T G E I S P G M I KD C G A T W V V L G H S E R R H 1 0 1 V F G E S D E L I G Q KV A H A L A E G L G V I A C I G E K L D E R E A G I T E K V V F E Q T K V I 1 5 1 A D N V K D W S KV V L A Y E P V W A I G T G KT A T P Q Q A Q E V H E K L R G W L K S N V S D A V 2 0 1 A Q S T R I I Y G G S V T G A T C KE L A S Q P D V D G F L V G G A S L K P E F V D I I N A K
N O . 5 4
T R I O S E P H O S P H A T E I S O M E R A S E ( T I M )
N o m i n a l m a s s ( Mr) : 2 2 6 9 5; C a l c u l a t e d p I v a l u e : 6 . 5 S e q u e n c e C o v e r a g e : 4 2 . 7 %附錄四 Protein ID result of spot No. 65 M a t c h e d p e p i d e s M W C h a r g e M S A S D P N S S I F L T D T A K 1 7 8 3 . 4 8 3 2 2 D Y T S G A M L T G E L K 1 3 8 4 . 3 1 7 5 2 D L T L D Q A Y S Y A V E N A K 1 7 9 9 . 4 9 3 3 2 D M N Q V L D A Y E N K 1 4 3 8 . 2 9 0 3 2 T F I F S D L D Y M G M S S G F Y K 2 1 0 7 . 4 9 0 6 2 A L I E V L Q P L I A E H Q A R 1 7 9 9 . 5 9 7 1 3 W L Q D V F N V P L V I Q M T D D E K 2 2 8 9 . 6 1 2 8 2 K L S F D F Q 8 8 3 . 2 7 5 8 2 I S F P A I Q A A P S F S N S F P Q I F R2 3 2 4 . 6 8 5 6 3 1 M P N S E P A S L L E L F N S I A T Q G E L V R S L K A G N A S K D E I D S A V K M L V S L K M S Y 5 1 K A A A G E D Y K A D C P P G N P A P T S N H G P D A T E A E E D F V D P W T V Q T S S A K G I D Y 1 0 1 D K L I V R F G S S K I D K E L I N R I E R A T G Q R P H H F L R R G I F F S H RD M N Q V L D A Y 1 5 1 E N KK P F Y L Y T G R G P S S E A M H V G H L I P F I F T KW L Q D V F N V P L V I Q M T D D E K 2 0 1 Y L W KD L T L D Q A Y S Y A V E N A K D I I A C G F D I N KT F I F S D L D Y M G M S S G F Y K 2 5 1 V V K I Q K H V T F N Q V K G I F G F T D S D C I G KI S F P A I Q A A P S F S N S F P Q I F RD R 3 0 1 T D I Q C L I P C A I D Q D P Y F R M T R D V A P R I G Y P K P A L L H S T F F P A L Q G A Q T K 3 5 1 S A S D P N S S I F L T D T A KQ I K T K V N K H A F S G G R D T I E E H R Q F G G N C D V D V S F 4 0 1 M Y L T F F L E D D D K L E Q I R KD Y T S G A M L T G E L KKA L I E V L Q P L I A E H Q A RR K 4 5 1 E V T D E I V K E F M T P RK L S F D F Q N O . 6 5 T R Y P T O P H A N Y L - T R N A S Y N T H E T A S E N o m i n a l m a s s ( Mr) : 5 3 1 3 1; C a l c u l a t e d p I v a l u e : 5 . 8 S e q u e n c e C o v e r a g e : 2 9 . 5 %
附錄五 Protein ID result of spot No. 116 M a t c h e d p e p i d e s M W C h a r g e A U L I F F D E I D A I G G A R 1 7 6 6 . 6 8 9 4 2 F V V D L S D Q V A P T D I E E G M R 2 1 1 9 . 7 5 0 6 3 T M L E L I N Q L D G F D P R 1 7 6 0 . 6 3 8 3 3 E S D T G L A P P A L W D L A A D K 1 8 6 8 . 7 4 2 1 2 K I E F S L P D L E G R 1 4 0 2 . 5 8 9 2 F V N L G I E P P K 1 1 1 2 . 4 9 4 2 2 E V V E T P L L H P E R 1 4 1 7 . 6 2 9 9 2 A L D E G D I A L L K 1 1 5 6 . 5 0 5 6 2 I E F S L P D L E G R 1 2 7 4 . 5 1 6 6 2 G V L L F G P P G T G K 1 1 4 1 . 5 2 8 7 2 Y Q I H I P L P P K 1 2 0 4 . 5 8 9 8 2 E V V E T P L L H P E R 1 4 1 7 . 6 7 3 3 1 M P D Y L G A D Q R K T K E D E K D D K P I RA L D E G D I A L L KT Y G Q S T Y S R Q I K Q V E D 5 1 D I Q Q L L K K I N E L T G I KE S D T G L A P P A L W D L A A D KQ T L Q S E Q P L Q V A R C T K 1 0 1 I I N A D S E D P K Y I I N V K Q F A K F V V D L S D Q V A P T D I E E G M RV G V D R N KY Q I H 1 5 1 I P L P P KI D P T V T M M Q V E E K P D V T Y S D V G G C K E Q I E K L RE V V E T P L L H P E R 2 0 1 F V N L G I E P P K G V L L F G P P G T G KT L C A R A V A N R T D A C F I R V I G S E L V Q K Y V 2 5 1 G E G A R M V R E L F E M A R T K K A C L I F F D E I D A I G G A R F D D G A G G D N E V Q RT M L 3 0 1 E L I N Q L D G F D P RG N I K V L M A T N R P D T L D P A L M R P G R L D R K I E F S L P D L E G 3 5 1 R TH I F K I H A R S M S V E R D I R F E L L A R L C P N S T G A E I R S V C T E A G M F A I R A R 4 0 1 R K I A T E K D F L E A V N K V I K S Y A K F S A T P R Y M T Y N N O . 1 1 6 2 6 S P R O T E A S E R E G U L A T O R Y S U B U N I T 7 N o m i n a l m a s s ( Mr) : 4 8 6 0 3; C a l c u l a t e d p I v a l u e : 5 . 7 S e q u e n c e C o v e r a g e : 2 7 . 5 %