ORIGINAL PAPER
Simultaneous quantitation of urinary cotinine and acrylonitrile-derived mercapturic acids
with ultraperformance liquid chromatography –tandem mass spectrometry
Chia-Fang Wu
&Shi-Nian Uang
&Su-Yin Chiang
&Wei-Chung Shih
&Yu-Fang Huang
&Kuen-Yuh Wu
Received: 20 October 2011 / Revised: 6 December 2011 / Accepted: 13 December 2011
# Springer-Verlag 2012
Abstract Acrylonitrile (AN), a widely used industrial chemical also found in tobacco smoke, has been classified as a possible human carcinogen (group 2B) by the Interna- tional Agency for Research on Cancer. AN can be detoxified by glutathione S-transferase (GST) to form glutathione (GSH) conjugates in vivo. It can be metabolically activated by cytochrome P450 2E1 to form 2-cyanoethylene oxide, which can also be detoxified by GST to generate GSH conjugates. The GSH conjugates can be further metabolized to mercapturic acids (MAs), namely, N-acetyl-S-(2-cya- noethyl)cysteine (CEMA), N-acetyl-S-(2-hydroxyethyl)cys- teine (HEMA), and N-acetyl-S-(1-cyano-2-hydroxyethyl) cysteine (CHEMA). This study developed an ultraperform- ance liquid chromatography coupled with tandem mass spectrometry (UPLC-MS/MS) method to quantitatively pro- file the major AN urinary metabolites (CEMA, HEMA, and CHEMA) to assess AN exposure, as well as analyze urinary
cotinine (COT) as an indicator for tobacco smoke exposure.
The limits of quantitation were 0.1, 0.1, 1.0, and 0.05 μg/L for HEMA, CEMA, CHEMA, and COT, respectively. This method was applied to analyze the three AN-derived MAs in 36 volunteers with no prior occupational AN exposure.
Data analysis showed significant correlations between the level of COT and the levels of these MAs, suggesting them as biomarkers for exposure to low levels of AN. The results demonstrate that a highly specific and sensitive UPLC-MS/
MS method has been successfully developed to quantita- tively profile the major urinary metabolites of AN in humans to assess low AN exposure.
Keywords Acrylonitrile . Ultraperformance liquid chromatography –tandem mass spectrometry. Cotinine . Mercapturic acids
Introduction
Acrylonitrile (AN) is a monomer widely used to manufac- ture various household articles such as artificial fibers, res- ins, rubbers, and plastics. The number of AN-exposed workers was estimated to be 35,000 in Europe and 80,000 in the USA [1]. AN is reported to be present in tobacco smoke, a major source for nonoccupational AN exposure, at about 3-15 μg per cigarette [ 2] and was classified as a possible human carcinogen (group 2B) by the International Agency for Research on Cancer in 1999 [1]. Upon absorp- tion, AN can be detoxified by glutathione S-transferase (GST) to form glutathione (GSH) conjugates, which can be further metabolized to N-acetyl-S-(2-cyanoethyl)cysteine (CEMA). Otherwise, AN can be metabolized by Chia-Fang Wu and Shi-Nian Uang are co-first authors
C.-F. Wu : W.-C. Shih : Y.-F. Huang : K.-Y. Wu ( *)
Department of Public Health & Institute of Occupational Medicine and Industrial Hygiene, College of Public Health,
National Taiwan University, Rm. 721, No.17, Shiujou Rd, Taipei 100, Taiwan
e-mail: [email protected] S.-N. Uang
Division of Analytical Chemistry, Institute of Occupational Safety and Health & Department of Public Health, Fu Jen Catholic University, Council of Labor Affairs, Executive Yuan, Taipei 22143, Taiwan
S.-Y. Chiang
School of Chinese Medicine, China Medical University, Taichung 40402, Taiwan
DOI 10.1007/s00216-011-5661-4
cytochrome P450 2E1 to 2-cyanoethylene oxide (CEO), which can also be detoxified by GST to generate CEO–
GSH conjugates. The GSH conjugates can be further me- tabolized to mercapturic acids (MAs), namely, N-acetyl-S- (2-hydroxyethyl)cysteine (HEMA) and N-acetyl-S-(1-cya- no-2-hydroxyethyl)cysteine (CHEMA) [3] (Fig. 1).
Analysis of three MAs can be used to confirm AN expo- sure and to serve as a chemically specific biomarkers for AN exposure [4–9]. The presence of urinary CEMA in exposed human subjects suggests detoxification of AN by GST [6]. An online solid-phase-extraction high-performance liquid chro- matography (HPLC) coupled with tandem mass spectrometry (MS/MS) method was developed to analyze CEMA in urine samples collected from the general public with a limit of detection (LOD) of 1 μg/L [10]. HEMA could be derived from ethylene oxide, vinyl chloride, or AN exposure [11].
Several liquid chromatography (LC)–MS/MS methods have been established to analyze urinary HEMA with excellent selectivity and sensitivity [12 – 15]. CHEMA was identified as a specific urinary metabolite of AN in an animal study [9]; nevertheless, a method to analyze CHEMA has not been reported.
Quantitatively profiling these MAs will shed light on AN metabolic mechanisms in detail and interindividual
differences in AN metabolism [16]. Cotinine (COT) has frequently been analyzed to serve as a biological marker for tobacco smoke exposure [17] and can be applied to evaluate the relationships between the levels of MAs and exposure to AN in tobacco smoke. This study thus developed an ultraperformance LC (UPLC) coupled with MS/MS method for simultaneously and quantitatively profiling urinary CEMA, HEMA, CHEMA, and COT.
Urine samples collected from volunteers were analyzed to validate whether these urinary MAs can serve as biomarkers for AN exposure.
Materials and methods
Chemicals and reagents
AN (LC/mass spectrometry grade, 100%) was purchased from J.T. Baker (USA). Formic acid (98-100%) and ammo- nium formate (minimum 98%) were obtained from Riedel- de Haën (Germany). HEMA [N-acetyl-S-(2-hydroxyethyl)-
L
-cysteine dicyclohexylammonium salt, 98%], CEMA [N- acetyl-S-(2-cyanoethyl)-
L-cysteine, 98%], d
4-HEMA [N-
N Acrylonitrile (AN)
G-SH
GS N
HO S N
O
NH H3C
O
N-acetyl-S-(2-cyanoethyl)cysteine (CEMA)
CYP2E1
O
N 2-cyanoethylene oxide (CEO)
G-SH HO S
N O
NH H3C
O
N-acetyl-S-(1-cyano-2-hydroxyethyl)cysteine (CHEMA)
OH
CN- cyanide
HO S
O
NH H3C
O
N-acetyl-S-(2-hydroxyethyl)cysteine (HEMA)
OH
Fig. 1 Metabolism of acrylonitrile. G-SH glutathione
acetyl-S-(2-hydroxyethyl-d
4)-
L-cysteine dicyclohexy)am- monium salt, 98%], d
3-CEMA [N-acetyl-d
3-S-(2-cya- noethyl)-
L-cysteine, 98%], and CHEMA [N-acetyl-S-(1- cyano-2-hydroxyethyl)-
L-cysteine dicyclohexylamine salt, 98%] were bought from TRC (Canada). COT and d
3-COT were supplied by Sigma (USA). Deionized water was pre- pared with a Milli-Q system supplied by Millipore (USA).
The stock solution (500 μg/mL) of each standard was prepared in 50% acetonitrile in water and stored at - 20 °C. The working solutions were prepared by diluting the stock solutions with ammonium formate buffer (50 mM) to 50 μg/L, and were then subjected to serial dilutions to their calibration curve solutions. The stock solution of each isotope-labeled standard was also pre- pared in 50% acetonitrile in water at a concentration of 100 μg/L for d
4-HEMA and d
3-CEMA, and 500 μg/L for d
3-COT, and the stock solutions were then subjected to dilution to 50 μg/L with ammonium formate buffer to their corresponding working solutions.
Sample collection and preparation
Spot urine samples were collected randomly in the morning from 36 volunteers and stored at -20 °C until analysis. All participants were graduate students of the National Taiwan University and none had previous history of occupational AN exposure. Information regarding age, gender, and smok- ing status was collected using questionnaires. The study was approved by the Institutional Review Board committee of the College of Public Health, National Taiwan University.
All subjects provided written informed consent prior to their participation.
Creatinine levels were determined as the creatinine–
picrate complex according to the Jaffe [18] method using an automated method. Urine samples with a creat- inine level less than 30 mg/dL or greater than 300 mg/dL were excluded from further data analysis. Three subjects were excluded because their creatinine levels were out of the range. The final study population consisted of 31 nonsmokers and two smokers from 22 to 26 years old.
Sample preparation
Spot urine samples from nine nonexposed nonsmokers were pooled to serve as the urine blank solution and were stored at -20 °C until analysis. The urine blank was thawed and mixed rigorously with a vortex mixer. One hundred micro- liters of the urine was transferred into an Eppendorf tube (1.5 mL), and 100 μL of the internal standard was then added to each sample. Twenty microliters of formic acid (98-100%) was then added and mixed rigorously. The sam- ple was diluted with ammonium formate buffer (50 mM) to a final volume of 1,000 μL. The solution was mixed,
allowed to stand for 5 min, then centrifuged at 10,000 rpm for 5 min. The supernatant was filtered through a 0.22-μm poly(vinylidene difluoride) membrane filter, and was trans- ferred to a 1.5-mL sample vial. The pH of each sample was adjusted to 2.5 with formic acid (98-100%) before analysis.
UPLC-MS/MS analysis
The UPLC-MS/MS system was equipped with a Thermo Scientific Accela pump, an Accela autosampler, and a TSQ Quantum Access system with a heated electrospray ioniza- tion (H-ESI) interface. The spray voltage was set at 2,500 V, the vaporizer temperature was set at 200 °C, the capillary temperature was set at 203 °C, the sheath gas (N
2) pressure was set at 40 (arbitrary units), the auxiliary gas (N
2) pressure was set at 5 (arbitrary units), and the collision gas (Ar) pressure was set at 1 (arbitrary unit). The H-ESI ion source was operated in negative mode for HEMA, d
4-HEMA, CEMA, d
3-CEMA, and CHMEA and in positive mode for COT and d
3-COT. The LC-MS/MS parameters were opti- mized with an infusion system, with each working solution being delivered at a flow rate of 10 μL min
-1, and the mobile phase (50% acetonitrile solution in water) being delivered at a flow rate of 200 μL min
-1with a Hamilton 500-μL syringe. The mass-to-charge ratio (m/z) range for full scan was set at 50-500 for each standard. The parameters for quadrupole 1 were optimized for precursor ions and those for quadrupole 3 were optimized for product ions automat- ically. Pairs of precursors and product ions with maximum intensities were selected for monitoring in selected reaction monitoring (SRM) mode. The ion pairs were monitored at 205.88→77.18m/z for HEMA, 209.88→81.18m/z for d
4- HEMA, 214.84→162.28m/z for CEMA, 217.84→165.28 m/z for d
3-CEMA, 231.30→213.10 m/z for CHEMA, 177.04→80.39m/z for COT, and 180.04→80.39m/z for d
3- COT. The collision energy for each ion pair was optimized to -14 V for HEMA and d
4-HEMA, -12 V for CEMA and d
3-CEMA, -10 V for CHEMA, and 24 V for COT and d
3- COT. The tube lens offset parameter was set at -61 (arbitrary units) for HEMA and d
4-HEMA, -57 for CEMA and d
3- CEMA, -41 for CHEMA, and +64 for COT and d
3-COT.
Liquid-chromatographic separation was performed with a Waters Acquity UPLC high-strength silica (HSS) T3 1.8 μm (2.1 mm×100 mm) column with a Waters Acquity Van- Guard HSS T3 1.8 μm (2.1 mm×5 mm) precolumn. The mobile phase consisted of 0.1% formic acid in acetonitrile (solvent A) and 0.1% aqueous formic acid (solvent B) and was delivered as follows: 0.00-1.23 min (3% solvent A, 250 μL min
-1), 1.24-1.80 min (3% solvent A, 200 μL min
-1), 1.81-2.00 min (3% solvent A, 100 μL min
-1), 2.01-3.00 min (3-30% solvent A, 100-150 μL min
-1), 3.01-5.00 min (30- 80% solvent A, 150-100 μL min
-1), 5.01-6.00 min (80%
solvent A, 100-250 μL min
-1), 6.01-8.00 min (3% solvent
A, 250 μL min
-1). The total run time was 8 min, including the last 2 min for column conditioning.
Validation and quality control
For quality assurance and quality control, four sets of cali- bration curves were prepared to evaluate the accuracy, pre- cision, recovery, matrix effect, and effect of the pH of the sample solution for this method. The first set (set 1) of solutions was prepared in deionized water. The second set (set 2) of solutions was prepared in the blank urine, and the standards were added before the sample preparation. The third set (set 3) of solutions was prepared similarly to the second set, but formic acid was not added and the pH was not adjusted during the sample preparation to evaluate the pH effect. The fourth set (set 4) of solutions was also prepared similarly to the second set, but the standards were added after sample preparation to evaluate the recovery during the sample preparation procedure. Linear calibration curves were constructed by plotting the quotients of the peak areas for HEMA, CEMA, and COT and those of their corresponding d
3- or d
4-labeled internal standards versus the concentrations of these standards. For CHEMA, the calibra- tion curve was established by plotting the peak area versus concentration, and its correlations with d
4-HEMA and d
3- CEMA were also checked.
The matrix effect was evaluated by comparing the slope of set 2 with that of set 1 [19], and the recovery was determined by comparison of the slope of set 2 with that of set 4 [20]. The lower limit of quantitation (LLOQ) was estimated by following US Food and Drug Administration (FDA) [21] guidelines for bioanalytical method validation with a signal-to-noise ratio of 10 or greater, and the LOD was defined as half of the LLOQ. Samples for quality control were also prepared according to the FDA ’s guide- lines [21]. The accuracy and precision of this method were assessed by repeated analysis of the second set of calibration standard solutions. Intraday (n030) and interday (n018) standard solutions at low (10 μg/L), medium (100 μg/L), and high (1,000 μg/L) concentrations were prepared. An- other six duplicates of the low, medium, and high concen- tration samples were also prepared and underwent a freeze–
thaw cycle on the first, third, seventh, and 14th days for analysis to evaluate sample stability [21, 22].
Results and discussion
Optimization of UPLC-MS/MS conditions
The MS/MS parameters were optimized manually, and the ion pairs monitored for quantitation in SRM mode were the fragments with maximum intensities. The precursor-ion
scan showed the most abundant fragment of HEMA was at m/z 205.88, and the product-ion scan showed the most abundant fragment ion was at m/z 77.18 (2-mercaptoetha- nol) [10 ]. For CEMA, the precursor ion was at m/z 214.84, and the product ion was at m/z 162.28 by loss of one sulfur- bonded AN molecule [15]. For CHEMA, the most abundant ion appeared at m/z 231.30 for the precursor ion and at m/z 213.10 for the product ion by loss of one molecule of H
2O.
The ion pair at m/z 231.30→213.10 was monitored for CHEMA in SRM mode, as shown in Fig. 2. To save instru- mentation time, COT was simultaneously analyzed by pre- vious methods [23–30 ]. The ion pair at m/z 177.04→80.39 was monitored for COT in SRM mode to achieve the max- imum sensitivity [24, 28].
An HSS T3 column was applied to perform chromatog- raphy. The HSS T3 column is a reversed-phase column coated with a trifunctional C
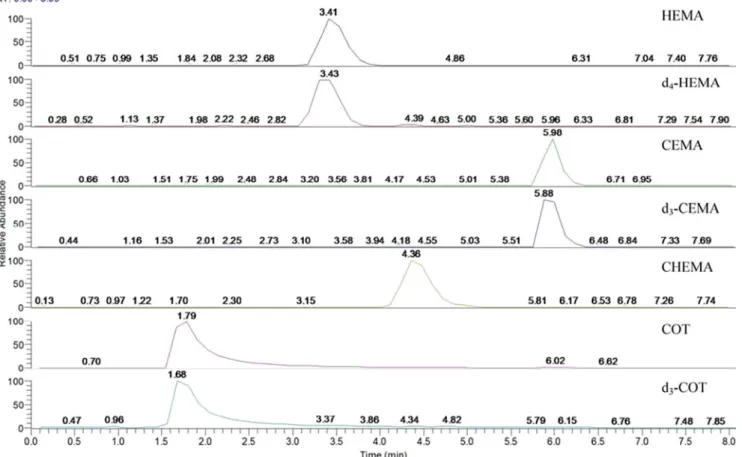
18ligand, and can be used in the pH range 2-8 to retain and separate polar organic com- pounds, such as MAs. Since the chemical and physical characteristics of HEMA, CEMA, and CHEMA are very similar, these MAs and COT could be separated by modu- lating both the composition of the mobile phase and the flow rate. The retention times were 1.7, 3.4, 4.4, and 5.9 min for COT, HEMA, CHEMA, and CEMA, respectively, as shown in Fig. 3.
Method performance
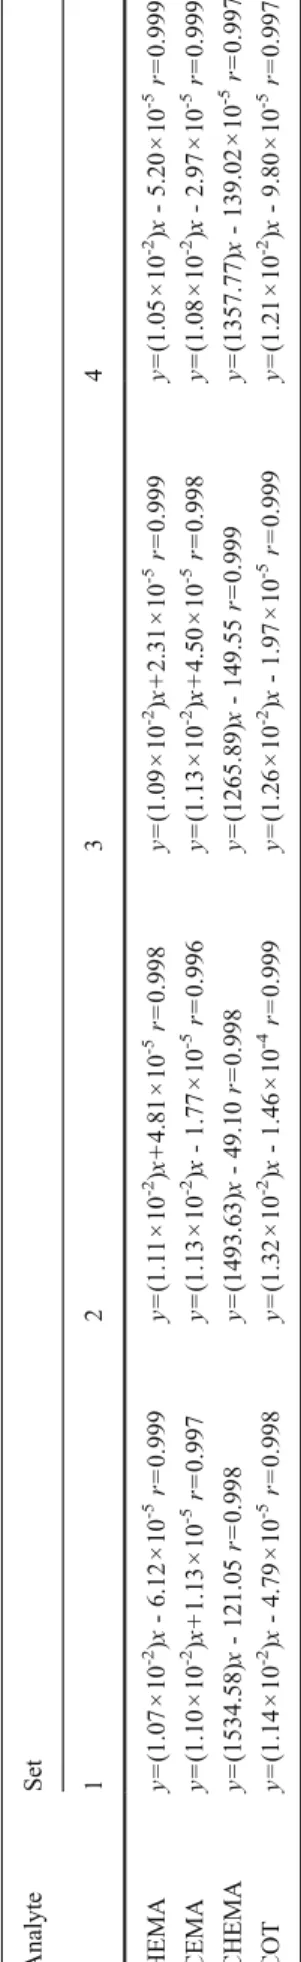
Four sets of calibration curves were prepared to assess the performance of this method. Each calibration curve was calculated by a weighted (1/y
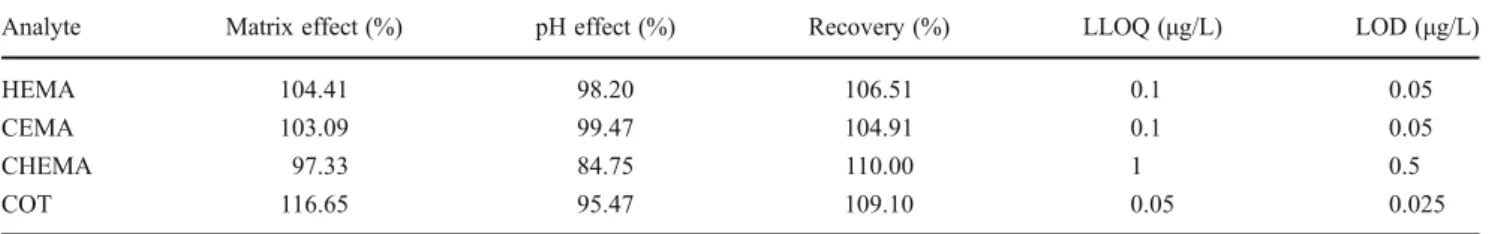
2) linear regression method, and the results are shown in Table 1. By comparing the slope of each set, we evaluated various effects on quantitation of these analytes, which included the matrix effect (set 2/set 1), the pH effect (set 3/set 2), and recovery (set 4/set 2), as shown in Table 2.
The matrix effect was defined as the interference due to the presence of unintended analytes [22], and was assessed by comparing the slope of set 2 with that of set 1. There was no manifest matrix effect for HEMA (104.41%), CEMA (103.09%), and CHEMA (97.33%), but there was one for COT (116.65%). The matrix effects of HEMA, CEMA, and COT slightly higher than 100% might be caused by their presence as a background in the urine of our study subjects.
The effect of pH was evaluated by comparing the slope of
set 3 with that of set 2. Adjustment of the pH would not
significantly affect quantitation of HEMA (98.20%), CEMA
(99.47%), and COT (95.47%), but may influence quantita-
tion of CHEMA (84.75%). This might be due to the absence
of an isotope-labeled internal standard for quantitation of
CHEMA. On the other hand, the calibration curves for
HEMA, CEMA, and COT were established by the relative
ratios of an individual standard to its isotope-labeled
Fig. 2 Mass spectra of the product-ion scan of CHEMA. The most abundant ion was observed at m/z 213.10, which represents the loss of one H
2O molecule from the precursor ion (m/z 231.30)
Fig. 3 Representative chromatograms generated from analysis of a urine blank sample spiked with 100 μg/L HEMA, d
4-HEMA, CEMA,
d
3-CEMA, CHEMA, cotinine (COT), and d
3-COT
standard, and the pH would have a similar effect on both synthetic and isotope-labeled standards.
Recovery was defined as the efficiency of an analytical procedure or sample preparation [22], and was determined by comparing the slope of set 2 with that of set 4. The sample preparation procedures for both sets were the same, except that the standard was added before sample prepara- tion for set 2 and after for set 4. The results indicated no apparent difference between the slopes of both calibration curves. The recoveries were 106.51%, 104.91%, 110.00%, and 109.10% for HEMA, CEMA, CHEMA, and COT, respectively. Similarly, recoveries of analytes slightly over 100% might arise from their presence as a background in urine of our study subjects.
The calibration curves were established by analyzing the set 2 standard solution for quantitation of the intended analytes in human samples. The LLOQs for HEMA, CEMA, CHEMA, and COT were estimated as 0.1, 0.1, 1.0, and 0.05 μg/L, respectively, and the LODs were 0.05, 0.05, 0.5, 0.025 μg/L, respectively. These results were com- pared with those obtained by previous LC-MS/MS methods.
Our method for HEMA is not as sensitive as a previous method with an LOD of 0.03 μg/L [15], but is more sensi- tive than other methods [12–14]. CEMA was first analyzed with HPLC –electrospray ionization–MS/MS with an LOD of 1 μg/L. Our method with an LOD of 0.05 μg/L is more sensitive than previous methods [9–11]. Our method is the first to be used to analyze CHEMA, not to mention to simultaneously quantitate urinary HEMA, CEMA, CHEMA, and COT in one sample preparation and one injection. The relationships between the three AN-derived MAs and COT could be evaluated simultaneously.
Quality assurance and quality control
According to the FDA guidelines [21], precision represents the closeness between individual measurements and should not exceed 15% of the coefficient of variation, and accuracy is defined as the deviation of the mean from the true value with an acceptable coefficient of variation within 15%.
Table 3 shows the concentrations of standard solutions
(10, 100, 1,000 μg/L) prepared to evaluate the accuracy
and precision of this method. Accuracy and precision were
all within 3% for the four analytes at all concentrations. For
the test of sample stability, six duplicates at the three differ-
ent concentrations of the standard solutions (10, 100,
1,000 μg/L) were also prepared. These samples were ana-
lyzed on the first, third, seventh, and 14th days. The results
revealed that the four urinary analytes were relatively stable,
at least up to 14 days of storage at –20 °C. The variations
were within 15% for the three concentrations of each analyte
compared with the initial concentrations prepared on the
first day. Reproducibility was evaluated by repeated analysis
T able 1 Calibration curves constructed in the four sets of method-development tests Analyte Set 12 34 HEMA y 0 (1.07 × 1 0
-2)x - 6.12 × 1 0
-5r0 0.999 y 0 (1.1 1 × 10
-2)x + 4.81 × 1 0
-5r0 0.998 y 0 (1.09 × 1 0
-2)x + 2.31 × 1 0
-5r0 0.999 y 0 (1.05 × 1 0
-2)x - 5.20 × 1 0
-5r0 0.999 CEMA y 0 (1.10 × 1 0
-2)x + 1.13 × 1 0
-5r0 0.997 y 0 (1.13 × 1 0
-2)x - 1.77 × 1 0
-5r0 0.996 y 0 (1.13 × 1 0
-2)x + 4.50 × 1 0
-5r0 0.998 y 0 (1.08 × 1 0
-2)x - 2.97 × 1 0
-5r0 0.999 CHEMA y 0 (1534.58) x - 121.05 r0 0.998 y 0 (1493.63) x - 49.10 r0 0.998 y 0 (1265.89) x - 149.55 r0 0.999 y 0 (1357.77) x - 139.02 × 1 0
-5r0 0.997 COT y 0 (1.14 × 1 0
-2)x - 4.79 × 1 0
-5r0 0.998 y 0 (1.32 × 1 0
-2)x - 1.46 × 1 0
-4r0 0.999 y 0 (1.26 × 1 0
-2)x - 1.97 × 1 0
-5r0 0.999 y 0 (1.21 × 1 0
-2)x - 9.80 × 1 0
-5r0 0.997 HEMA N -acetyl- S -(2-hydroxyethyl)cysteine, CEMA N -acetyl- S -(2-cyanoethyl)cysteine, CHEMA N -acetyl- S -(1-cyano-2-hydroxyethyl)cysteine, COT cotinine
of HEMA, CEMA, CHEMA, and COT in all concentrations in the set 2 calibration standard solutions. For HEMA, CEMA, CHEMA, and COT, the intraday variations were 1.35-1.73%, 0.98-1.54%, 1.03-1.89%, and 0.40-1.29%, respectively, and the interday variations were 1.19- 1.78%, 0.86-2.32%, 1.38-1.46%, and 0.58-2.29%, re- spectively. These results demonstrate that this method simultaneously quantitated three AN-derived MAs and COT with excellent sensitivity, specificity, precision, accuracy, and reproducibility, and these analytes were very stable for 14 days at –20 °C.
Concentrations of urinary metabolites
In total, 36 samples were analyzed, and the creatinine levels in 33 samples fell in the range 30-300 mg/dL. Analysis of all 33 samples showed that HEMA, CEMA, CHEMA, and COT were detectable in 45.45%, 69.70%, 96.97%, and 100% of the samples, respectively. For those samples with urinary metabolites below the LOD, their contents were designed as half of the LOD. The data are summarized in Table 4 as the percentage of detectable HEMA, CEMA, CHEMA, and COT and their corresponding geometric mean and range concentrations. Compared with the geometric mean (range) of urinary HEMA and CEMA levels, our results with a geometric mean (range) of 1.04 (not detectable to 61.83 μg/g creatinine) for HEMA and 2.59 (not detect- able to 111.70 μg/g creatinine) for CEMA are comparable with those of previous studies [8, 10, 14]. To assess the relationships between COT and MAs, the values for the
MAs were log-transformed and analyzed with linear regres- sion. There was high correlation between CEMA concen- tration and COT concentration (r
p00.801, p<0.001), and this correlation was consistent with that in previous studies [10, 31]. These results suggest that CEMA can serve as a biomarker for very low AN exposure in the general popu- lation and indicate that tobacco smoke could be the major source of nonoccupational AN exposure for our study sub- jects. The correlation between the summation of the HEMA and CHEMA concentrations and the COT concentration was highly significant (r
p00.780, p<0.001), but COT concen- tration was not significantly correlated with either HEMA concentration or CHEMA concentration. These results dem- onstrated that AN is indeed metabolized to CEO in humans.
The presence of HEMA could also represent the internal dose of coexposure to AN, ethylene, and ethylene oxide in tobacco smoke. Our study showed that there was insignifi- cant correlation between HEMA concentration and COT concentration, and this was inconsistent with the findings of a previous study [32]. One of the reasons could be that our study subjects were mainly nonsmokers and included only two smokers. In contrast, there were 40 smokers in the previous study, and HEMA data of smokers and non- smokers were combined for statistical analysis to achieve a significant correlation. Another reason could be that HEMA was not detectable in a great portion of samples, and the true correlation between HEMA concentration and COT concen- tration might not be obtained by using statistical analysis in this study. Interpretation of no significant correlation be- tween CHEMA concentration and COT concentration Table 2 The matrix effect, pH effect, and recovery
Analyte Matrix effect (%) pH effect (%) Recovery (%) LLOQ ( μg/L) LOD ( μg/L)
HEMA 104.41 98.20 106.51 0.1 0.05
CEMA 103.09 99.47 104.91 0.1 0.05
CHEMA 97.33 84.75 110.00 1 0.5
COT 116.65 95.47 109.10 0.05 0.025
Matrix effect 0(slope of set 2/slope of set 1)×100%, pH effect0(slope of set 3/slope of set 2)×100%, recovery0(slope of set 2/slope of set 4)×
100%
LLOQ lower limit of quantitation, LOD limit of detection
Table 3 Results of intraday and interday quality-control samples
Precision 0(standard error/nomi- nal concentration) ×100%
Analyte Precision (%)
Intraday (n030) Interday (n018)
1,000 μg/L 100 μg/L 10 μg/L 1,000 μg/L 100 μg/L 10 μg/L
HEMA 1.51 1.35 1.73 1.19 1.77 1.78
CEMA 0.98 1.01 1.54 0.86 1.35 2.32
CHEMA 1.39 1.03 1.89 1.46 1.38 1.45
COT 0.40 0.71 1.29 0.58 1.10 2.29
would need further study of the kinetics. However, the summation of the HEMA and CHEMA concentrations was significantly correlated with the COT concentration in urine, and this suggests that the summation of the HEMA and CHEMA concentrations may serve as an indicator for ex- posure to tobacco smoke. Although CEMA is a good bio- marker of AN exposure, our data show that CHEMA is a poor AN biomarker. However, the combined analysis of CEMA, HEMA, and CHEMA could be useful in estimating the dose of alkylating agents in cigarette smoke.
Conclusions
A method for simultaneous quantitation of three AN- derived MAs (CEMA CHEMA, and HEMA) and COT has successfully been developed with excellent reliability, sen- sitivity, and specificity with easy sample preparation proce- dures. To our knowledge, the method presented is the first to simultaneously quantitate the three AN-derived MAs in one sample preparation. Additionally, CEMA can serve as a biomarker for AN exposure, and the summation of the HEMA and CHEMA concentrations may be a biomarker for exposure to tobacco smoke. This method can be used to analyze the three AN-derived MAs in urine collected from AN-exposed workers to study occupational AN exposure from multiple routes.
Acknowledgements The authors gratefully appreciate the technical support and assistance with the UPLC-MS/MS analyses provided by Dr. Wei-Chung Shih. This study was supported in part by grants from the Institute of Occupational Safety and Health, Council of Labor Affairs (grant no. IOSH98-A313), the National Sciences Council (no.
NSC98-2314-B-002-082-MY3), and the Environmental and Occupa- tional Health Center at National Taiwan University, Taiwan.
References
1. IARC (1999) Summary of data reported and evaluation. Re- evaluation of some organic chemicals, hydrazine and hydrogen peroxide, vol 71. IARC, Lyon, France
2. Hoffmann D, Hoffmann I, El-Bayoumy K (2001) Chem Res Toxicol 14:767–790
3. Léonard A, Gerber GB, Stecca C, Rueff J, Borba H, Farmer PB, Sram RJ, Czeizel AE, Kalina I (1999) Mutat Res 436:263 –283 4. National Research Council (1995) Biologic markers in urinary
toxicology. National Academies Press, Washington
5. Sumner SC, Selvaraj L, Nauhaus SK, Fennell TR (1997) Chem Res Toxicol 10:1152 –1160
6. Jakubowski M, Linhart I, Pielas G, Kopecký J (1987) Br J Ind Med 44:834 –840
7. Vermeulen NP, de Jong J, van Bergen EJ, van Welie RT (1989) Arch Toxicol 63:173 –184
8. Calafat AM, Barr DB, Pirkle JL, Ashley DL (1999) J Expo Anal Environ Epidemiol 9:336 –342
9. Linhart I, Smejkal J, Novák J (1988) Arch Toxicol 61:484 –488 10. Schettgen T, Musiol A, Alt A, Ochsmann E, Kraus T (2009) Anal
Bioanal Chem 393:969–981
11. De Rooij BM, Commandeur JNM, Vermeulen NPE (1998) Bio- markers 3:239–303
12. Barr DB, AshleyDL J (1998) Anal Toxicol 22:96–104
13. Haufroid V, Merz B, Hofmann A, Tschopp A, Lison D, Hotz P (2007) Cancer Epidemiol Biomarkers Prev 16:796 –802
14. Schettgen T, Musiol A, Kraus T (2008) Rapid Commun Mass Spectrom 22:2629 –2638
15. Ding YS, Blount BG, Valentin-Blasini L, Applewhite HS, Xia Y, Watson CH, Ashley DL (2009) Chem Res Toxicol 22:1018 –1025 16. Schulte PA, Waters M (1999) Ann N Y Acad Sci 895:101 –111 17. Benowitz NL (1996) Epidemiol Rev 18:188 –204
18. Jaffe M (1886) Hoppe-Seylers Z Physiol Chem 10:391
19. Matuszewski BK, Constanzer ML, Chavez-Eng CM (2003) Anal Chem 75:3019 –3030
20. Matuszewski BK, Constanzer ML, Chavez-Eng CM (1998) Anal Chem 70:882 –889
21. Food and Drug Administration (2001) Guidance for industry bio- analytical method validation. CVM & CDER, FDA, US DOH 22. Chung CC (2004) Analytical method validation and instrument
performance verification. John Wiley & Sons, Inc., Publication, Hoboken
23. Kataoka H, Inoue R, Yagi K, Saito K (2009) J Pharm Biomed Anal 49:108 –114
24. Fan Z, Xie F, Xia Q, Wang S, Ding L, Liu H (2008) Chromatog- raphia 68:623 –627
25. Chadwick CA, Keevil B (2007) Ann Clin Biochem 44:455 –462 26. Hoofnagle AN, Laha TJ, Rainey PM, Sadrzadeh SM (2007) Am J
Clin Pathol 126:880 –887
27. Heavner DL, Richardson JD, Morgan WT, Ogden MW (2005) Biomed Chromatogr 19:312 –328
28. Xu X, Iba MM, Weisel PC (2004) Clin Chem 50:2323 –2330 29. Moyer TP, Charlson JR, Enger RJ, Dale LC, Ebbert JO, Schroeder
DR, Hurt RD (2002) Clin Chem 48:1460 –1471
30. Tuomi T, Johnsson T, Reijula K (1999) Clin Chem 452:2164 –2172 31. Minet E, Cheung F, Errington G, Sterz K, Scherer G (2011)
Biomarkers 16:89–96
32. Eckert E, Schmid K, Schaller B, Hiddemann-Koca K, Drexler H, Goen T (2011) Int J Hyg Environ Health 214:196–204
Table 4 Biological monitoring results ( n033) Analyte Above LOD (%) Geometric mean
( μg/g creatinine) Range
( μg/g creatinine)
HEMA 45.45 1.04 ND
ato 61.83
CEMA 69.70 2.59 ND
ato 111.70
CHEMA 96.97 2.41 ND
bto 23.09
COT 100 11.47 0.86-889.11
ND not detectable
a
Below 0.05 μg/L
b