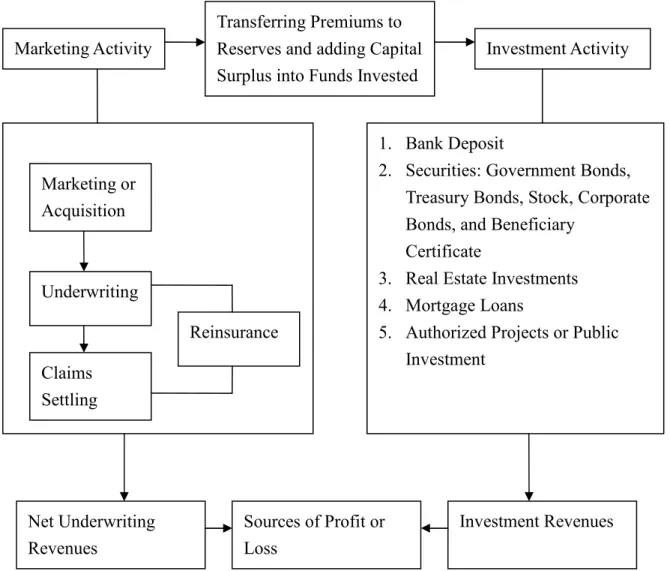
The Meaning and Development of Life Insurance Industry in Taiwan
19
0
0
全文
(2)
(3)
(4)
(6)
(7)
(8)
(9)
(10)
(11)
(12)
(13)
(14)
(15)
(16)
(17)
(18)
(19)
數據
相關文件
Promote project learning, mathematical modeling, and problem-based learning to strengthen the ability to integrate and apply knowledge and skills, and make. calculated
Wang, Solving pseudomonotone variational inequalities and pseudocon- vex optimization problems using the projection neural network, IEEE Transactions on Neural Networks 17
Hope theory: A member of the positive psychology family. Lopez (Eds.), Handbook of positive
Define instead the imaginary.. potential, magnetic field, lattice…) Dirac-BdG Hamiltonian:. with small, and matrix
Master Taixu has always thought of Buddhist arts as important, the need to protect Buddhist arts, and using different forms of method to propagate the Buddha's teachings.. However,
Continue to serve as statements of curriculum intentions setting out more precisely student achievement as a result of the curriculum.
The difference resulted from the co- existence of two kinds of words in Buddhist scriptures a foreign words in which di- syllabic words are dominant, and most of them are the
• elearning pilot scheme (Four True Light Schools): WIFI construction, iPad procurement, elearning school visit and teacher training, English starts the elearning lesson.. 2012 •
