A systematic approach for developing a foot size information
system for shoe last design
Feng-Tsung Cheng, Der-Baau Perng*
Department of Industrial Engineering and Management, National Chiao Tung University, Hsinchu, Taiwan, 30050, ROC Received 7 January 1998; received in revised form 12 June 1998; accepted 10 September 1998
Abstract
The property of a shoe last design signi"cantly impacts the "tness of the shoes thus produced. Traditionally, a shoe last is designed by using numerous foot measure data. Among all the items of foot measure information, the foot length and joint girth are further identi"ed as principle factors a!ecting shoe last design. In this paper, foot length and joint girth are analyzed by using a bi-variate normal distribution to obtain a more e$cient foot size grading system. A set of 2486 adult male samples collected in Taiwan area are used in this analysis to establish the norm for the foot length and joint girth. A foot size information system (FSIS) providing shoe last related information such as the percentage of population that a last can "t in is established from the analysis results. This study contributes designers the grading information that is helpful for shoe last design.
Relevance to industry
Shoe last design is the basis for footwear design. The foot size information system derived in this paper provides shoe making industry with a more e$cient and economical size grading system to design shoe lasts. This grading system also promotes customer satisfaction with better "tness in foot size. ( 1999 Elsevier Science B.V. All rights reserved. Keywords: Shoe last design; Bi-variate normal distribution; Foot size information system (FSIS); Foot size grading system
* Corresponding author. Tel.: 00 886 3 5712121 57 319; fax: 00 886 3 5722392; e-mail: [email protected].
1. Introduction
The design of new shoes starts with the design of a new shoe last. A shoe last is a wooden or metal model of the human foot on which shoes are
shaped. In shoe making processes, the shoe last design plays an important role since the appro-priateness of its design signi"cantly impacts the "tness of the "nal products, namely, the shoes. A pair of new shoes should not only keep pace with fashion in its appearance, but should also satisfy the biomechanic requirements of the foot shape. Therefore, the objectives of designing a new shoe last are to make the shoes thus produced "t the
0169-8141/99/$ - see front matter ( 1999 Elsevier Science B.V. All rights reserved PII: S 0 1 6 9 - 8 1 4 1 ( 9 8 ) 0 0 0 9 8 - 5
Fig. 1. Foot bones.
consumers' feet properly and let them feel comfort-able. To achieve this goal, the shoemaker's last is designed based on the basic data of the foot shape. Through iterative design and re"nement, the last designer can turn the irregular three-dimensional data of the foot shape into a solid model of the last. One of the di$culties in this shoe last making process is to identify useful data for building a stan-dard last from numerous foot measurements. To-ward this e!ort, this paper presents an approach to systematically establish a Foot Size Information System (FSIS) based on the measured foot data using bi-variate normal distribution.
In the following sections, the foot structures and measures are "rst reviewed, then di!erent foot size systems are presented and compared. Finally a set of 2486 adult male samples collected in Taiwan area is analyzed according to the proposed model and an e$cient sizing approach is presented.
2. A review on the foot structure and measures
Shoes are subordinate to the feet and are bound to protect them. As the mold for shoe making, the shoe last should be designed in accordance to the foot shape. A thorough understanding of the foot structure and its biomechanic characteristics, there-fore, is important for foot measurement, last design, and shoemaking.
2.1. Foot structure and biomechanics
A human foot is composed of muscles, bones, and nerves. It supports the body and helps us keep balance and move forward or backward. There are 26 bones in each foot. The top view of foot bones is illustrated in Fig. 1. In terms of functions, the foot bones can be categorized into three groups: the malleolus bones, the metatarsal bones, and the phalanges (Meister, 1981).
The malleolus bones are also called the tarsal bones, which are located at the back part of a foot. When designing a shoe last, no matter how drasti-cally the style of the forepart of the shoe last is changed, the back part of a shoe last almost re-mains the same. In general, the back part of a shoe last is entitled to functional design whereas the fore
part fashion design. The metatarsal bones are com-posed of "ve long bones. They cover the part from the inner and outer waists to the waist girth of the last. Finally, the phalanges consist of 14 bones, of which two belong to the big toe, and three belong to each of the other four toes. This part is located at the forepart, the front tip of the shoe last.
Despite the large body of information available, biomechanics is still a developing research "eld with a wide variety of focus points producing new theoretical and practical results (Kroemer et al., 1987). Biomechanics rely much on anthropometric data, adapted and often simpli"ed to "t the mech-anical approach (Cha$n and Anderson, 1984; NASA/Webb, 1978). In such a simpli"ed model, the musculoskeletal system is represented as a lever system and the human movements are considered as kinematic chains of this lever system. Similar to the mechanical situations, there are three classes of lever systems depending on the location of the joint (fulcrum) in relation to the points of force and resistance (Tayyari and Smith, 1997):
Fig. 2. Class II lever of foot.
Fig. 3. Anatomical and free-body diagram of foot during weight bearing.
1. Class I: The joint (fulcrum) lies between the force point and resistance point.
2. Class II: The resistance is between the joint (fulcrum) and the force point.
3. Class III: The force point lies between the joint (fulcrum) and the resistance point.
Obviously, the foot in walking is an example of the Class II lever in Fig. 2. With this lever class in mind, the joint reaction force and the net muscle moment at the ankle created by the ground reac-tion force due to body weight can be therefore represented in Fig. 3 and calculated by using link segment equations.
Given: ax, ay "acceleration of segment center of mass
a "angular acceleration of segment of movement
Rxd, Ryd "reaction forces acting
at distal end of segment
Md "net muscle moment acting at distal joint
M, m "body weight and foot weight respectively
Assume the body is in a static situation, deriva-tion of Ry2 and M2 can be shown as follows: 1. RFx"max, Rx2#Rx1"max"0. 2. RFy"may,
Ry2#Ry1!mg"may,
Ry2#Mg!mg"0, Ry2"(!M#m)g(0.
3. About the center of mass,RM"I0a, M2!Ry1 ) d1!Ry2 ) d2"0,
M2"Ry1 ) d1#Ry2 . d2(0.
The negative sign for Ry2 means the force acting on the foot at the ankle joint is downward. This is not surprising because the entire body weight, less that of foot, must be acting downward on the ankle joint. The negative sign for M2 means that the real direction of the muscle moment acting on the foot at the ankle joint is clockwise, which means that the plantar-#exors are active at the ankle joint to main-tain the static position. These muscles have created an action force that resulted in the ground reaction force that was measured, and whose center of pressure was (d2}d1) anterior to the ankle joint (Winter, 1990).
This approach, for the sake of simpli"cation, considers body segments as rigid parts (Ayoub et al., 1980; Tayyari and Smith, 1997). However, al-though the skeletal framework of the foot gives strength and supports the weight of the body is quite rigid, muscles attach to the bones and softer tissue such as tendons and ligaments are more #exible. Therefore, the foot shape changes dynam-ically during walking or running due to the forces distributed and moments applied on the foot skel-etal system varying in accordance to time. For example, the arch of the foot changes the shape as the weight loaded on the foot changes. When the weight of body applies to both feet, the lateral arch and medial arch lower a couple of millimeter while the forefeet extend about 12.5 mm. This change can help the foot to absorb shocks when contacting surfaces under large impacts. The phenomenon dis-cussed has strong implications on shoe making in terms of biomechanic design.
Many shoe makers, especially athletic footwear makers have tried to take advantage of the foot
arch, which is also considered as the `springa in human feet. Some of the investigations suggest that `energy returna can be achieved through designing footwear that can store `elastic strain energya in the strain of the shoes (Alexandra et al., 1987). Other than being the spring in human feet, the change of shape of foot arch strongly suggests that the match between shoe size and feet needs to take body weight into considerations. If the shoes are for special working/sporting conditions in which extra weights are put on human, then the match between shoe size and feet needs to take these weights into considerations as well.
2.2. Foot deformities and lesions caused by ill-,tting footwear
It is generally agreed that ill-"tting footwear can develop many foot problems. Many deformities can be eliminated if the o!ending footwear is discarded early enough (Browne et al., 1990). While foot de-formities can be caused by ill-"tting footwear, foot deformities and lesions can signi"cantly a!ect shoe "t as well. Some of the foot deformities and lesions may be caused by footwear "t are discussed below. Hallux Valgus: The great toe is de#ected towards the other toes at the "rst metatarso-phalangeal joint. There is often some additional enlargement of the joint. In severe cases, the big toe either overlaps or underlies the second toe and the big toe joint dislocates. The condition is considered greatly in#uenced by shoe "t. Shoes should not be too narrow or too short which may squash the toes together. The situation can be corrected for children if more toe room is provided when selecting footwear. However, with adult feet, the chances for correction are remote but further damage and discomfort can be prevented by appro-priate "tting.
Pes Planus (Flat foot): The bones at the back of the foot tip forward, causing the arch disappear and the forefoot to rotate outwards. The lack of arch reduces the shock absorbing capability of foot which may cause some discomfort. The discomforts can be relieved to some extend by wearing shoes with soft soles and heels. In terms of foot size, the #at foot does not extend as much as normal foot during walking and running.
Hallux Rigidus: This condition is characterized by the limited movement at the big toe joint, mak-ing normal gait impossible. In advanced cases, the toe is #exed downwards. It can be caused by con-tinual stubbing of the big toe when footwear is too short.
There are several other well-de"ned abnormal-ities associated with toes, including hammer toe, clawed toe, and retracted toe, all of which can be caused by ill-"tting footwear. As for the foot lesions such as callouses, corns, and blisters are mostly due to ill-"tting footwear and can be corrected by proper selection of footwear. Since many of the foot problems are due to "tting and the most signi"cant factor a!ecting "tting is shoe size, it is therefore expected that a well-de"ned shoe size system can improve the "tting property to a certain extend. Nevertheless, all the foot size information is based on the anthropometric data of foot measurement, the follow section will review the current situation of foot measurement in the Asia area.
2.3. The related work of foot measurement
The anthropometric research in Taiwan started back in 1964 which focused on the height and weight. It was not until 1982 that the foot and shoes measurements were formally brought into action. The main research topics included marketing re-search, function, and quality study of sports wear, and particularly, the static and dynamic test and analysis of the foot. From 1986 to 1990, research about foot measurement was followed. The measurement items, however, seemed not enough, and the measure techniques were di!erent. Re-cently, from 1993 to 1995, research about foot measurement and shoe last design for the people in the Taiwan area was carried out. Emphases were placed on foot shape data collection and analysis, shoe last making, as well as sample footwear mak-ing and re"nmak-ing. Five shoe lasts and a database for the foot shape were derived from this study (Wei, 1995).
China also conducted several investigations re-garding foot shape from 1980 to 1982. They investi-gated the relationships between various features of the foot, sole design, and the size speci"cation of the shoe last. Upon completion of the research a shoe
Fig. 4. Shoe last measurements.
size speci"cation system and standard shoe last series for Mainland China were developed (Fan, 1982).
The Japanese Shoe Making Association (Wagi, 1982) did research on the benchmarking of shoe sample making from 1980 to 1982, in which the shoe last analysis was proceeded. In 1988, a tech-nical report about the foot shape research and development investigated the di!erences of the foot of Japanese using computerized measurement equipment. The change of the foot shape in several decades was explored in 1988 (Wagi, 1988).
3. The size speci5cation system of shoe last
Popular culture dictates shoe options including elegance, fashionable, and comfortable as well as lifestyle, etc. The generalities of the pattern and size of the shoe last are the two most important require-ments. Basically, the shoe last size speci"cation consists of foot length, girth, bottom width, and the like dimensions. Because people vary in foot shape in gender, age, race, habits of living, and even dur-ing day or night, the size speci"cation systems of shoe last are di!erent around the world (Chen, 1994, 1995)
3.1. The main dimensions of shoe lasts
A shoe last can be categorized by the material, style, production method and usage occasion. From the style point of view, the front part of the shoe last determines the fashion of the shoe, while the rear part belongs to the function of the shoe. The rear part of a shoe last will not be changed no matter what the style is.
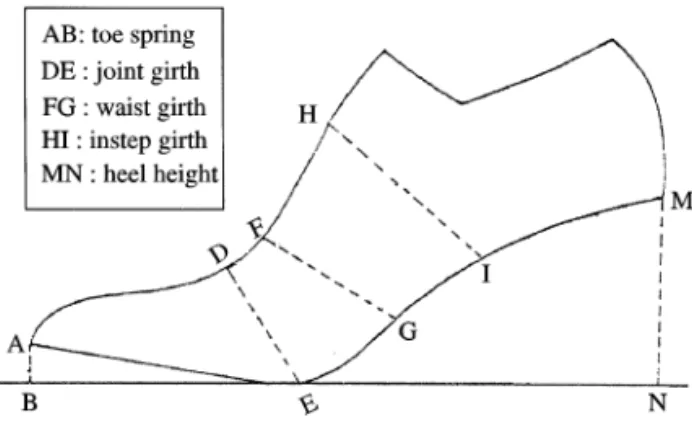
Generally, there are several important measures for a shoe last. These measures will be increased or decreased according to the change of last sizes. These major measurements as shown in Fig. 4 in-clude: (1) foot length, BN (2) joint, waist, and instep girth labeled, DE, FG, HI, respectively (3) heel height, MN and (4) toe spring, AB and (5) bottom width (Chao, 1989).
The foot length is the horizontal distance be-tween the front tip of the last and the end point of the heel. The girth means the circumscription
around a cross section on a speci"c point and can be categorized into three types, namely, joint girth, waist girth, and instep girth. If not explicitly men-tioned, the girth often means the joint girth. The bottom width de"nes the straight distance between the joint of outer waist and that of the inner waist. The heel height means the perpendicular distance from the bottom of the rear point of the shoe last to the ground. Finally, the toe spring speci"es the perpendicular distance from the front tip of the shoe last to the ground (Chao, 1989; Chen, 1985).
For mass production, the shoe makers usually group the feet into classes in terms of sizes while providing satisfactory "tting qualities. Tradition-ally, foot length and joint girth are the two foot dimensions used for the classi"cation of feet. Foot length is obviously the most important dimensions that must be accommodated in the proper "tting of a shoe. In practice the length of a last is made longer than the foot in order to prevent contact between the end and the upper of toes during weight bearing and walking. Foot length is vir-tually used as the basic measurement in nearly all shoe size systems.
A study of the correlation among foot dimen-sions indicates that even when foot length is con-trolled there are still variations in each of the other critical dimensions over small or moderate ranges. This result shows that control of foot length alone does not adequately control the size and shape of the foot, nor the last. The joint, waist and instep girth dimensions generally correlate well with each other, but they do not correlate as well with the foot length. On the other hand, joint girth not only is
highly correlated with other principal dimensions, but also is the dominant girth that cannot be ad-justed by means of lacing in footwear. Therefore, the foot length and joint girth dimension would be that the best control factor of the dimensions of a last. As a result, joint girth is, used in most present standard last systems (Browne and Rason, 1995; Chen, 1994).
3.2. The major shoe size specixcation systems in the world
There are two categories of the size speci"cation system of shoes. One is based upon the stick length of the shoe last such as the current systems used in French, American, and British; the other is based upon the actual foot length. These systems include those used in Japan, Mainland China, as well as the Mondo Point System.
The French system, also known as German sys-tem, was evolved from the Paris Point System. It is popular in Italy, western and northern European countries. In this system, the stick length for the shoe last of size zero is 0 mm. Each increase of one number in shoe size adds 6.67 mm to the shoe last length. An increase or decrease of one size in the girth means 5 mm plus or minus in girth circum-scription, or, 1.67 mm plus or minus in the shoe bottom width. It is rare to use half size in the French system.
Among all systems, the British system was de-veloped earliest and is currently applied to the British England, Australia, South Africa, and Euro-pean Continent. The stick length for the shoe last of size zero is 4 in, and each increase of one size adds 8.46 mm, or, there are three sizes in each inch. In terms of girth, every one size will increase or de-crease 6.35 mm, or, four sizes in one inch. Transfer-ring the girth size to bottom width results in each size corresponding to 2.12 mm. Speci"cally, half sizes are used in the British system.
The American shoe size system was from the British system and is commonly used in the United States. The stick length for the shoe last of size zero is 100 mm. Each growth of one size adds 8.46 mm to the last length. The size changes in the girth and bottom width are the same as British system except that the stick length of the shoe last for American
system is shorter than that of British system by 1/12 in.
The Japanese shoe size speci"cation is based upon the real foot length when wearing shoes. For example, size 22 if for foot length of 220 mm. The actual length of size 22 shoes usually falls between the range of 230}240 mm. The di!erence between any two adjacent sizes is 10 mm. The change of one size in the girth is 7.5 mm, which, in terms, means 2.5 mm change of one size in the bottom width. Half sizes are equal to the midway of the full sizes. The Mondo Point System was developed by SATRA in Britain for the purpose of establishing an international standard. The system is based on the real foot length and width, and each size speci-"cation is formed by two number, namely, the foot length/the width. For example, for a pair of shoes with a size of 260/98 means that the shoes can "t in a person whose feet are 260 mm long and 98 mm wide. The di!erences between any two adjacent sizes are 7.5 mm for foot length and 2.8 mm for the foot width (Browne et al., 1990; Liao, 1984).
The shoe size speci"cation system currently used in Taiwan is somewhat confusing. It is composed of the Mainland China system (mainly of Shanghai system) and the Taiwan system (Taiwan scale sys-tem). Conventionally, a Taiwan inch is about 30.3 mm, and a Shanghai meter is about 28.5 mm. The size speci"cation system ranges from 42 to 94. The di!erence between two neighboring sizes may be 3 or 6 mm for the shoes for male dress shoes, it is 10 mm for sport wears. As for the joint girth, the unit size is 4 mm for size 42 to size 62, and 5 mm for size 64 to size 94. Finally each size growth increases bottom width in 6 mm. The size interval for these shoe size speci"cation systems are sum-marized in Table 1 (Ye, 1994).
4. The analysis of foot shape data and shoe last design
To meet the requirement of batch production and to satisfy the consumer's needs, we wish to establish a reasonable series of shoe last size system by applying statistic theory to analyze the foot shape data. In order to develop and establish the Foot Size Information System (FSIS), the original
Table 1
Major shoe size speci"cation systems. The unit of size interval is mm
Measure features Foot length increment Joint girth increment Bottom width increment System name
French 6.67 5.00 1.67
British 8.46 6.35 2.12
USA 8.46 6.35 2.12
Japan 10.00 7.50 2.50
Mondo point 7.50 Unspeci"ed 2.80
Taiwan 3 or 6 4 or 5 6
foot shape database in Taiwan area is used as samples to verify the "tness and e!ectiveness of the proposed method.
4.1. Theoretical background
In the original foot measure database, there are 31 measure items for each foot. Since foot length is the dominant factor for determining the size of shoes, and joint girth is the only variable that cannot be controlled by fastening the shoe tie, the combination of these two variables are generally su$cient for most shoe last designs. To support the shoe last design and shoe making, the present paper explored the relationship between the variables of foot length and joint girth. Moreover, the shoe size speci"cation and the degree of con"dence of the consumer are further investigated from the view point of economic e!ectiveness (Chen, 1993).
In designing the shoe last, the foot length is often used to determine the suitable size "rst. The joint girth will then be employed to ascertain the obesity of the shoes. Because the foot data collected for this research is from a single population, the foot length and joint girth in general follow the pattern of normal distributions. Hence, when we put together the two normal distribution curves of foot length and joint girth, a bell-shaped bi-variate normal distribution will be formed. Follow the bi-variate normal distribution theory, the probabilities and the levels of con"dence of the distribution can be obtained.
For a given point, where two features of the variables are combined, using a bi-variate normal distribution, the probability function p(c) can be
obtained by the following formula (Olkin et al., 1994):
p(c)" 1
2npxpyJ1!r2e
c2
2(1~r2)*x*y , (1)
where px and py are the standard deviations of the variable x (foot length) and y (joint girth), re-spectively; *x and *y represents the increment of variable x, and variable y, respectively; r is the cor-relation coe$cient of variable x and variable y; and
c2"(x!xN )2 p2x ! 2r(x!xN )(y!yN) pxpy # (y!yN )2 p2y , From formula (1), a discrete bi-variate normal dis-tribution, Z*x*y, can be represented as:
Z*x*y"2npx)py)J1!r21 )e~1@(2(1~r2))
[
(x~xN)2 p2x ~2r(x~x N)(y~yN) pxpy `(y~y N)2 p2y]
)*x*y (2)If we substitute*x*y by *1*2, then *1"*x/px is the normalized di!erence of the foot length, and *2"*y/py is the normalized di!erence of the joint girth. Using P(x1, x2) to replace Z*x*y, then x1 rep-resents the foot length, and x2 the joint girth after normalization. P(x1, x2) becomes the probability function for the discrete bi-variate normal distribu-tion. Formula (2) can be transformed into
P(x1, x2)"2n ) J1!r21 ) e~1@(2(1~r2))*x21~2!x1x2`x22+
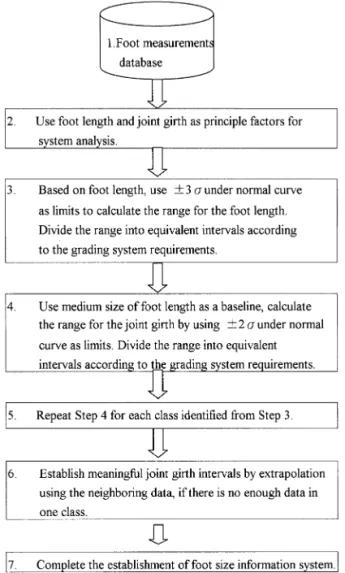
Fig. 5. Flowchart for establishing a foot size speci"cation sys-tem.
4.2. The analysis of foot shape data and the degree of conxdence
The foot shape data of 6700 samples in Taiwan area are collected to calculate and analyze the levels of con"dence using SAS version 6.11. Four groups of data are obtained from the statistical analysis: (a) Male aged 16}54, (b) Male aged 3}15, (c) Female aged 16}54, and (d) Female aged 3}15.
In this research, however, for the purpose of homogeneity, only the data collected from group (a) (male, 16}54 years of age) are used for further analysis. The analysis for other three groups can be found in another technical report (Perng and Cheng, 1997). For group (a), the sample size is 2486; the average foot length is 253.2 mm (standard devi-ation is 11.5 mm); and the average joint girth is 246.3 mm (standard deviation is 13.2 mm). If the data fall beyond $3p are considered as outliers, the sample size drops to 2475.
Because the number of total classes in di!erent foot size systems varies, the interval between two consequent sizes may di!er. Take the foot length within $3p for instance, there will be 22 classes from the minimum length of 222 mm to the max-imum length of 285 mm with class interval of 3 mm. If we choose 252 mm as the base of the normal distribution to further analyze the joint girth within $2p, the class interval will be 10 mm for 5 classes, and 6 mm for 7 classes.
Accordingly, for the foot length within $3p, if we divide the data into 17 classes, the class interval is 4 mm. Taking 254 mm as the base of the normal distribution to analyze the joint girth within $2p, the class interval will be 10 mm for 5 classes, and 6 mm for 7 classes. This analysis procedure can be shown in Fig. 5.
The outputs of the classes of foot length and joint girth are listed in Tables 2}5 Tables 6}9 represent their degrees of con"dence, respectively. The corre-sponding top views of the output foot size are outlined in Figs. 6 and 7 for 17-class and 22-class size system, respectively. Note that Fig. 6 only rep-resents the grading for C size of joint girth taken from Table 2 while Fig. 7 represents the same grad-ing from Table 4. The results re#ect the followgrad-ing essential facts:
1. When the foot length is divided into 22 classes, the class interval is 3 mm, whereas it is 4 mm for 17 classes. On the other hand, the class interval of joint girth will remain the same even though the number of classes of foot length is di!erent. That is to say, whether the foot length is grouped into 22 or 17 classes, the class interval of joint girth will be 10 mm for 5 classes, and 6 mm for 7 classes. The "nding reveals that there will be a regular pattern for the class assignment of joint girth for a given foot length.
2. Transforming the data in Table 6 into a bi-variate cumulative frequency polygon, we can get an approximate normal distribution diagram as shown in Fig. 8.
Table 2
The rank data of foot length (17) and joint girth (5) for the foot shape of adult males in Taiwan area (units: mm). ft"foot length, jg"joint girth, n"sample size
ft 222 226 230 234 238 242 246 250 254 258 262 266 270 274 278 282 286 jg A 212 213 214 215 218 220 225 225 225 230 235 238 240 240 244 248 252 B 222 223 224 225 228 230 235 235 235 240 245 248 250 250 250 258 262 C 232 233 234 235 238 240 245 245 245 250 255 258 260 260 264 268 272 D 242 243 244 245 248 250 255 255 255 260 265 268 270 270 274 278 282 E 252 254 254 255 258 260 265 265 265 270 275 278 280 280 284 288 292 n 13 14 55 86 158 228 294 358 354 292 219 176 107 75 29 16 1 Table 3
The rank data of foot length (17) and joint girth (7) for the foot shape of adult males in Taiwan area (units: mm). ft"foot length, jg"joint girth, n"sample size
ft 222 226 230 234 238 242 246 250 254 258 262 266 270 274 278 282 286 jg A 210 213 216 219 222 222 225 228 230 231 234 234 243 243 245 246 247 B 216 219 222 225 228 238 231 234 236 237 240 240 249 249 251 252 253 C 222 225 228 231 234 234 237 240 242 243 246 246 255 255 257 258 259 D 228 231 234 237 240 240 243 246 248 529 252 252 261 261 263 264 265 E 234 237 240 243 246 246 249 252 254 258 258 258 267 267 269 270 271 EE 240 243 246 249 252 252 255 258 260 261 264 264 273 273 275 276 277 EEE 246 249 252 251 258 258 261 264 266 267 270 270 279 279 281 282 283 n 13 14 55 86 158 228 294 358 354 292 219 176 107 75 29 16 1
The mathematical function of Fig. 8 can be expressed as:
P(x1, x2)"2nJ1!r21 e~1@(2(1~r2) *x21~2rx1x2`x22+
*1*2 , (4)
Where r is the correlation coe$cient of foot length and joint girth (r "0.50369),
*1 "*xpx" 4
11.50"0.3478,
*2 "*ypy " 10
13.19"0.7582.
The height in each grid can be considered as proportion to be manufactured in correspond-ing size. The point A represents the foot size with
minimum foot length and joint girth; point B for the maximum foot length and joint girth; point
C for the minimum foot length and maximum
joint girth, and point D for the maximum foot length and the minimum joint girth.
3. From Fig. 8, we can tell that the joint probabil-ity of foot length and joint girth will be de-creased gradually when we move away from the center of the distribution. The change rate is sluggish at "rst, and will be increased gradually when the o!set is larger. The bi-variate fre-quency distribution shows that, it is more cost e!ective for the manufacturer who produces only the central part of the shoe last rather than all sizes in Table 6. This not only meets the requirement of the majority but also relieves the burden of the manufacturer. If we choose the area within $2 sizes (246}262 mm) from the
Tab le 4 Th e rank d ata o f foo t length (2 2 ) a n d jo in t g ir th (5) fo r the fo o t shap e o f adu lt m al es in Tai w an ar ea (u ni ts : m m ).ft " fo ot le n g th , jg " jo in t g ir th , n " sa m p le si ze ft 22 2 2 2 5 22 8 2 3 1 23 4 2 3 4 24 0 2 4 3 24 6 2 4 9 25 2 2 5 5 25 8 2 6 1 26 4 2 6 7 27 0 2 7 3 27 6 2 7 9 28 2 2 8 5 jg A 2 10 2 1 0 2 11 2 1 2 2 14 2 1 5 2 20 2 2 0 2 20 2 2 4 2 25 2 3 0 2 30 2 3 0 2 35 2 3 5 2 40 2 4 0 2 40 2 4 5 2 48 2 5 2 B 2 20 2 2 0 2 21 2 2 2 2 24 2 2 5 2 30 2 3 0 2 30 2 3 4 2 35 2 4 0 2 40 2 4 0 2 45 2 4 5 2 50 2 5 0 2 50 2 5 5 2 58 2 6 2 C 2 30 2 3 0 2 31 2 3 2 2 34 2 3 5 2 40 2 4 0 2 40 2 4 4 2 45 2 5 0 2 50 2 5 0 2 55 2 5 5 2 60 2 6 0 2 60 2 6 5 2 68 2 7 2 D 2 40 2 4 0 2 41 2 4 2 2 44 2 4 5 2 50 2 5 0 2 50 2 5 4 2 55 2 6 0 2 60 2 6 0 2 65 2 6 5 2 70 2 7 0 2 70 2 7 5 2 78 2 8 2 E 2 50 2 5 0 2 51 2 5 2 2 54 2 5 5 2 60 2 6 0 2 60 2 6 4 2 65 2 7 0 2 70 2 7 0 2 75 2 7 5 2 80 2 8 0 2 80 2 8 5 2 88 2 9 2 n 1 0 71 64 95 89 7 1 2 4 1 9 3 1 9 2 2 8 1 2 5 1 2 8 2 1 9 1 2 2 1 1 4 0 1 3 57 87 83 52 01 3 4 Tab le 5 Th e rank d ata o f foo t length (2 2 ) a n d jo in t g ir th (7) fo r the fo o t shap e o f adu lt m al es in Tai w an ar ea (u ni ts : m m ). ft " fo o t le ngt h , jg " jo in t g ir th , n " sam p le si ze ft 22 2 2 2 5 22 8 2 3 1 23 4 2 3 4 24 0 2 4 3 24 6 2 4 9 25 2 2 5 5 25 8 2 6 1 26 4 2 6 7 27 0 2 7 3 27 6 2 7 9 28 2 2 8 5 jg A 2 08 2 1 0 2 13 2 1 6 2 19 2 1 9 2 21 2 2 2 2 24 2 2 5 2 28 2 2 8 2 28 2 3 4 2 34 2 3 4 2 35 2 3 6 2 40 2 4 5 2 48 2 5 2 B 2 14 2 1 6 2 19 2 2 2 2 25 2 2 5 2 27 2 2 8 2 30 2 3 1 2 34 2 3 4 2 34 2 4 0 2 40 2 4 0 2 41 2 4 2 2 46 2 5 1 2 54 2 5 8 C 2 20 2 2 2 2 25 2 2 8 2 31 2 3 1 2 33 2 3 4 2 36 2 3 7 2 40 2 4 0 2 40 2 4 6 2 46 2 4 6 2 47 2 4 8 2 52 2 5 7 2 60 2 6 4 D 2 68 2 2 8 2 31 2 3 4 2 37 2 3 7 2 39 2 4 0 2 42 2 4 3 2 46 2 4 6 2 46 2 5 2 2 52 2 5 2 2 53 2 5 4 2 58 2 6 3 2 66 2 7 0 E 2 32 2 3 4 2 37 2 4 0 2 43 2 4 3 2 45 2 4 6 2 48 2 4 9 2 52 2 5 2 2 52 2 5 8 2 58 2 5 8 2 59 2 6 0 2 64 2 6 9 2 72 2 7 6 EE 23 8 2 4 0 24 3 2 4 6 24 9 2 4 9 25 1 2 5 2 25 4 2 5 5 25 8 2 5 8 25 8 2 6 4 26 4 2 6 4 26 5 2 6 6 27 0 2 7 5 27 8 2 8 2 E E E 2 44 2 4 6 2 49 2 5 2 2 55 2 5 5 2 57 2 5 8 2 60 2 6 1 2 64 2 6 4 2 64 2 7 0 2 70 2 7 0 2 71 2 7 2 2 76 2 8 1 2 84 2 8 8 n 1 0 7 1 64 95 89 7 1 2 4 1 9 3 1 9 2 2 8 1 2 5 1 2 8 2 1 9 1 2 2 1 1 4 0 1 3 57 87 83 52 01 3 4
Table 6
The degree of con"dence of foot length (17) and joint girth (5) for the foot shape of adult males in Taiwan area (units:mm). ft"foot length, jg"joint girth, n"sample size
222 230 234 238 242 246 250 254 258 262 266 270 274 278 282 28 6 0.04 0.09 0.16 0.25 0.47 0.67 1.29 1.09 0.79 1.10 1.30 1.02 0.63 0.26 0.17 0.09 0.04 0.11 0.24 0.47 0.81 1.43 2.09 3.29 3.32 2.85 3.25 3.11 2.32 1.46 0.73 0.40 0.19 0.08 0.12 0.29 0.63 1.20 2.02 3.02 3.87 4.67 4.79 4.44 3.45 2.44 1.57 0.94 0.46 0.19 0.07 0.06 0.16 0.39 0.83 1.32 2.02 2.11 3.04 3.73 2.81 1.77 1.19 0.71 0.56 0.24 0.09 0.03 0.01 0.04 0.11 0.27 0.40 0.63 0.53 0.92 1.34 0.82 0.42 0.27 0.18 0.15 0.06 0.02 0.01 Total 0.34 0.82 1.76 3.36 5.64 8.43 11.09 13.04 13.5 12.42 10.05 7.24 4.63 2.64 1.33 0.58 0.23 Grand total"97.1%. Table 7
The degree of con"dence of foot length (17) and joint girth (7) for the foot shape of adult males in Taiwan area (units: mm). ft"foot length, jg"joint girth, n"sample size
222 230 234 238 242 246 250 254 258 262 266 270 274 278 282 286 1 0.02 0.05 0.13 0.27 0.48 0.54 0.78 0.99 0.99 0.76 0.68 0.35 0.53 0.23 0.01 0.04 0.01 2 0.04 0.11 0.24 0.48 0.86 1.06 1.49 1.85 1.87 1.53 1.33 0.77 0.83 0.41 0.20 0.08 0.03 3 0.06 0.16 0.35 0.68 1.16 1.59 2.17 2.60 2.67 2.32 1.95 1.25 1.00 0.55 0.27 0.12 0.04 4 0.07 0.18 0.38 0.71 1.19 1.81 1.39 1.78 2.89 2.67 2.17 1.56 0.91 0.55 0.28 0.13 0.05 5 0.06 0.15 0.31 0.57 0.92 1.56 1.00 2.48 2.37 2.33 1.84 1.46 0.63 0.43 0.22 0.11 0.04 6 0.04 0.10 0.20 0.35 0.54 1.02 1.26 1.38 1.48 1.54 1.18 1.04 0.33 0.25 0.13 0.07 0.03 7 0.02 0.05 0.09 0.16 0.24 0.51 0.61 0.64 0.70 0.77 0.57 0.56 0.13 0.11 0.06 0.03 0.02 Total 0.31 0.8 1.7 3.22 5.39 8.09 10.7 12.72 12.97 11.92 9.72 6.99 4.36 2.53 1.17 0.58 0.22 Grand total"93.4%.
medium size (254 mm of the foot length), the degree of con"dence can reach 60.5%. For the area within $3 sizes from the medium size, the degree of con"dence will be increased to 76.1%. It will be up to 86.4% if we select $4 sizes from the medium one.
4. As can be seen from Tables 6}9, when the num-ber of the class of foot length remains the same, the smaller the class interval of the joint girth, the less the percentage of the population covered. In the case of 17-class foot length, the percentage of the population covered in the 5-class joint girth will be 97.1%, and 93.4% for the joint girth of 7 classes. If the foot length is divided into 22 classes, the population covered will be 97.2% for 5-class joint girth, and 93.4% for that of 7 classes.
5. Figs. 9}11 can be derived from the database of Tables 7}9, respectively, of which the di!erences in the mathematical functions are the
standard-ized value for foot length and joint girth. The mathematical functions of Figs. 8}10 are the same as Eq. (4) except that the values of*1 and *2 are (i) 0.35 and 0.45 for Fig. 8, (ii) 0.26 and 0.76 for Fig. 9, and (iii) 0.26 and 0.45 for Fig. 10. The smaller the group of the foot length, the smoother the bell-shaped curve will be. On the contrary, the bell-shaped curve will be less smooth for the bigger class interval of the foot length.
6. Finally, we can tell from Tables 2}5 that the closer the foot length comes to the medium size, the smaller the di!erence of joint girth will be. Sometimes there is no di!erence for the joint girth, e.g., the joint girth in Table 2 is the same for the foot lengths of 246, 250, and 254 mm. It means that when the foot shape approaches the mode, the change of joint girth is not so obvious. Therefore, the categories and number of shoe lasts can be reduced while customers can still be satis"ed.
Tab le 8 T h ed eg re eo fc o n " d ence o f foo t len gth (22) a n d jo in t gir th (5) fo r the fo o t sh a p e o f a du lt m a les in T a iw a n a re a (u n it s: m m ). ft " fo ot le ng th ,j g " jo in t g ir th , n " sa m p le siz e 22 2 2 2 5 22 8 2 3 1 23 7 2 4 0 24 3 2 4 6 24 9 2 5 2 25 5 2 5 8 26 1 2 6 4 26 7 2 7 0 27 3 2 7 6 27 9 2 8 2 28 5 1 0 .0 3 0 .0 4 0 .0 6 0 .1 0 0 .1 6 0 .2 1 0 .4 9 0 .5 0 0 .4 6 0 .7 5 0 .7 1 1 .1 4 0 .8 3 0 .5 5 0 .7 2 0 .4 3 0 .4 7 0 .2 5 0 .1 2 0 .1 1 0 .0 7 0 .0 4 2 0 .0 7 0 .1 2 0 .2 1 0 .3 4 0 .5 6 0 .7 8 1 .4 1 1 .6 2 1 .7 0 2 .3 5 2 .3 6 2 .9 3 2 .4 4 1 .8 5 1 .8 9 1 .2 8 1 .0 9 0 .6 6 0 .3 6 0 .2 6 0 .1 5 0 .0 8 3 0 .0 9 0 .1 8 0 .3 3 0 .5 6 0 .9 0 1 .3 3 1 .8 7 2 .4 6 2 .9 4 3 .4 1 3 .6 2 3 .5 0 3 .3 3 2 .8 9 2 .2 9 1 .7 7 1 .1 8 0 .8 1 0 .5 1 0 .2 8 0 .1 0 .0 7 4 0 .0 5 0 .1 2 0 .2 4 0 .4 3 0 .6 7 1 .0 5 1 .1 5 1 .7 2 2 .3 6 2 .2 9 2 .5 8 1 .9 4 2 .1 1 2 .0 9 1 .2 9 1 .1 4 0 .5 9 0 .4 6 0 .3 3 0 .1 4 0 .0 7 0 .0 3 5 0 .0 2 0 .0 4 0 .0 8 0 .1 5 0 .2 3 0 .3 8 0 .3 3 0 .5 6 0 .8 7 0 .7 1 0 .8 5 0 .5 0 0 .6 2 0 .7 0 0 .3 3 0 .3 4 0 .1 4 0 .1 2 0 .1 0 0 .0 3 0 .0 1 0 .0 1 To ta l 0 .2 6 0 .5 0. 92 1. 58 2. 52 3. 75 5. 25 6. 86 8. 33 9. 51 10 .1 10 .0 9. 33 8. 08 6. 52 4. 96 3. 47 2. 3 1 .4 2 0 .8 2 0 .4 4 0 .2 3 Gr a n d to ta l " 97 .2%. Tab le 9 T h ed eg re eo fc o n " d ence o f foo t len gth (22) a n d jo in t gir th (7) fo r the fo o t sh a p e o f a du lt m a les in T a iw a n a re a (u n it s: m m ). ft " fo ot le ng th ,j g " jo in t g ir th , n " sa m p le siz e 22 2 2 2 5 22 8 2 3 1 23 4 2 3 7 24 0 2 4 3 24 6 2 4 9 25 2 2 5 5 25 8 2 6 1 26 4 2 6 7 27 0 2 7 3 27 6 2 7 9 28 2 2 8 5 1 0 .0 1 0 .0 2 0 .0 5 0 .1 1 0 .2 0 0 .2 4 0 .3 4 0 .4 0 0 .5 1 0 .5 2 0 .6 6 0 .5 1 0 .3 6 0 .5 9 0 .3 8 0 .2 2 0 .1 4 0 .0 8 0 .0 7 0 .0 6 0 .0 4 0 .0 3 2 0 .0 3 0 .0 5 0 .1 1 0 .2 0 0 .3 7 0 .4 7 0 .6 7 0 .8 2 1 .0 2 1 .0 8 1 .3 0 1 .0 9 0 .8 4 1 .1 1 0 .7 7 0 .4 9 0 .3 2 0 .1 9 0 .1 5 0 .1 9 0 .0 7 0 .0 4 3 0 .0 4 0 .0 8 0 .1 7 0 .3 0 0 .5 1 0 .7 1 1 .0 0 1 .2 6 1 .5 6 1 .7 1 1 .9 3 1 .7 6 1 .4 6 1 .5 9 1 .2 0 0 .8 2 0 .5 5 0 .3 5 0 .2 5 0 .1 7 0 .0 9 0 .0 5 4 0 .0 5 0 .1 1 0 .2 0 0 .3 4 0 .5 4 0 .8 1 1 .1 3 1 .4 7 1 .8 0 2 .0 4 2 .1 7 2 .1 5 1 .9 4 1 .7 3 1 .4 1 1 .0 5 0 .7 3 0 .4 7 0 .3 1 0 .1 8 0 .0 9 0 .0 4 5 0 .0 5 0 .1 0 0 .1 8 0 .2 9 0 .4 3 0 .7 1 0 .9 7 1 .3 1 1 .5 7 1 .8 5 1 .8 6 1 .9 9 1 .9 4 1 .4 2 1 .2 5 1 .0 1 0 .7 3 0 .4 9 0 .2 8 0 .1 5 0 .0 7 0 .0 3 6 0 .0 5 0 .0 7 0 .1 2 0 .1 6 0 .2 7 0 .4 6 0 .6 3 0 .8 8 1 .0 4 1 .2 7 1 .2 0 1 .3 9 1 .4 7 0 .8 9 0 .8 5 0 .7 4 0 .5 5 0 .3 8 0 .2 0 0 .0 9 0 .0 4 0 .0 2 E E E 0 .0 2 0 .0 4 0 .0 6 0 .1 0 0 .1 2 0 .2 3 0 .3 1 0 .4 5 0 .5 2 0 .6 6 0 .5 9 0 .7 4 0 .8 5 0 .4 2 0 .4 3 0 .4 1 0 .3 2 0 .2 3 0 .1 1 0 .0 5 0 .0 2 0 .0 1 To ta l 0 .2 4 0 .4 7 0 .8 9 1 .5 2. 44 3. 63 0. 05 6. 59 8. 02 9. 13 9. 71 9. 63 8. 86 7. 75 6. 29 4. 74 3. 34 2. 19 1. 37 0. 89 0. 42 0. 22 Gr a n d to ta l " 93 .4 % .
Fig. 6. Top view for foot with 17 classes grading.
Fig. 7. Top view for foot with 22 classes grading.
Fig. 8. The bi-variate normal distribution of 17-class foot length and 5-class joint girth.
Fig. 9. The bi-variate normal distribution of 17-class foot length and 7-class joint girth.
4.3. Comparison of the result and related research
As far as foot shape measurement and shoe last design are concerned, we compare the research
with that of TFRI (Browne, 1995) and Mainland China in three aspects of research method, foot length and joint girth analysis, and regression ana-lysis.
Fig. 11. The bi-variate normal distribution of 22-class foot length and 7-class joint girth.
Fig. 10. The bi-variate normal distribution of 22-class foot length and 5-class joint girth.
4.3.1. Comparison of the research method
(1) All the three studies are to derive the principle for shoe last design based on the basic foot shape database. The statistic methods are used to calculate the relationship between foot shape and shoe last.
(2) The study done by the TFRI emphasized on the correlation among the feature data, and the study by Mainland China focused upon various shoe lasts, including all sorts of materials such as rubber, leather, cloth, and plastic. On the other hand, this study analyzes di!erent class intervals of the foot length and joint girth to get an appropriate design that covers maximum percentage of the
popu-lation in a speci"c range of foot length and joint girth. The linear regression functions for diverse foot lengths and joint girths are provided in Table 10.
4.3.2. Foot length and joint girth analysis
The result of foot length and joint girth analysis is listed in Table 10 below.
4.3.3. Regression analysis
The following linear regression functions are based upon the medium size of the foot length and the joint girth.
Mainland China: joint girth(mm)"0.89 * foot length(mm)#21.0 , (5) TFRI: joint girth(mm)"0.636 * foot length(mm)
#87.54. (6) Cheng and Perng: joint girth(mm)"0.648 * foot
length(mm)#83.70. (7) By substituting the foot length into Eq. (7), the result of the joint girth is close to the original joint girth within the tolerance of 0.36 mm.
5. Conclusions
In this paper, the foot shape data in Taiwan area were analyzed in a systematic approach. A foot size information system (FSIS) was developed and es-tablished after analyzing the levels of con"dence of the probability function for foot length and joint girth. The FSIS provides the basic information for the design and manufacturing of shoe lasts. The shoe last was classi"ed into di!erent classes by considering various incremental intervals of the foot length. Each class shows di!erent grading by considering the combination of foot length and joint girth. The FSIS then can provide the percent-age of each class and grading that is "t for people. The information can be used as a guideline to evaluate and determine the feasible parameter for shoe last design and manufacturing, and especially, to develop the reasonable and comfortable shoe last and foot wear. To achieve the mass produc-tion's objective of mass production, it is necessary for us to set up the standard size speci"cation system. The method used in this research can be
Table 10
Foot length and joint girth analysis
Research Feature item Mainland China (1982) TFRI (1985) Cheng & Perng (1997)
Foot length: mean 251.34 mm 253.3 mm 253.21 mm
STD 10.91 mm (Not Available) 11.50 mm
Number of classes 14 17 17
class interval 5.0 mm 4.0 mm 4.0 mm
Joint length: mean 247.39 mm 246.4 mm 246.28 mm
STD 11.70 mm (Not Available) 13.19 mm
Number of classes 5 (Not Available) 5
class interval 7.0 mm (Not Available) 10.0 mm
applied to other related anthropometric items in a wide variety of practical cases.
In addition to the major factors of foot length and joint girth, there are some other measurements essential to the shoe last design, including waist girth, instep girth, bottom width, heel height, and toe spring. To make a pair of shoes that thoroughly "t an individual's foot shape and taste, we need to care more about 3D factors of foot and the style of the appearance of shoes. Hence a 3D solid model for shoe lasts is worthwhile to develop for the shoe making industry.
Acknowledgements
The authors would like to thank the funding support of National Science Council under con-tract NSC 87-2212-E-009-018 and Mr. Y.T. Wei, General Manager and the sta! members of Taiwan Footwear Research Institute, Taiwan, R.O.C. for their kind help and valuable information.
References
Alexandra, 1987. The spring in your step. New Scientist, UK. Ayoub, M.M., Mital, A., Asfour, S.S., Bethea, N.J., 1980. Review,
evaluation and comparison of models for predicting lifting capacity. Human Factors 22, 257}269.
Browne, R., Clayton, C., Hanley, J., 1990. In: Larcombe Peter (Ed.), Modern Shoemaking No29: Lasts. SATRA Footwear Technology Center, UK.
Browne, R., Rason, K., 1995. Taiwan Anthropometric Project. SATRA Footwear Technology Center, UK. pp. 1}22. Cha$n, D.B., Andersson, G.B.J., 1984. Occupational
Bio-mechanics. Wiley, New York.
Chao, P.-Y., 1989. The Signi"cance to Taiwan of Changes in Last Design and Production for the Footwear Industry. Leicester Polytechnic, UK. pp 93}112.
Chen, F.-S., 1985. Manufacturing Shoe and Paper Board De-sign. Taiwan Footwear Research Institute, Taiwan, ROC. Chen, R., C.-C., 1993. An investigation into shoe-last design in
relation to foot measurement and shoe "tting for orthopaedic footwear Ph.D Thesis King's College London, UK. pp. 79}120. Chen, R., C.-C., 1994. Feasibility study of shell shoe "tting for orthopaedic footwear. The 3rd Pan-Paci"c Conference on Occupational Ergonomics. Korea.
Chen, R., C-C., 1995. A comparison of trial shoe and shell shoe "tting techniques. Journal of Prosthetics and Orthotics In-ternational Denmark.
Fan, C.-Y., 1982. Chinese Shoe Size Speci"cation System and Standard Shoe Last Series. Light Industry Ministry and Chemical Industry Ministry of China (PROC). pp. 145}166. Kroemer, K.H.E., Snook, S.H., Meadows, S.K., Deutsch, S. (Eds), 1987. Ergonomic Models of Anthropometry, Human Biomechanics and Operator- equipment interfaces. National Academy Sciences, Washington, D.C.
Liao, W.K., 1984. Export Shoe Dimension and Last. Taiwan Footwear Research Institute, Taiwan, ROC.
Meister, 1981. Human Factors: Theory and Practice. USA. NASA/Webb (Eds.), 1978. Anthropometric SourceBook (3 vols).
NSAS Reference Publication 1024. Houston, TX: L.B.J. Space Center, NASA (NTIS, Spring"eld, VA 22161, Order No. 79 11 734).
Olkin, I., Gleser, L.J., Derman, C., 1994. Probability Models and Applications USA. pp. 554}573.
Perng, D.-B., Cheng, F.-T., 1997. Shoe last solid model construc-tion and feature data measurement. Technical report, NSC 87-2212-E-009-018.
Tayyari, F., Smith, J.L., 1997. Occupational Ergonomics Prin-ciples and Applications, USA.
Wagi, Kawa-Kino, 1982. The Benchmark of Shoe Sample. Ja-panese shoe making association, Japan.
Wagi, Kawa-Kino, 1988. Foot Shape Research and Develop-ment Report. Japanese shoe making association, Japan. Wei, Y.-T., 1995. The foot Measurement and Shoe Last Design
for the people in Taiwan. Taiwan Footwear Research Insti-tute, Taiwan, ROC. pp. 484}514.
Winter, D.A., 1990. Biomechanics and Motor control of Human Movement, USA.
Ye, S.-R., 1994. Shoe Last Design, Ministry of Economic A!airs Industrial Development Bureau, Taiwan, ROC. pp. 36}71.