商業計劃:韓國米酒在台灣新市場的發展 - 政大學術集成
57
0
0
全文
(2) 商業計劃:韓國米酒在台灣新市場的發展 Business Plan: New Market Development for Korean Rice Wine in Taiwan. 研究生:金民惠. Student: Minhye Kim. 指導教授:劉助. Advisor: James Liu. 政 治 大. 學. ‧ 國. 立. 國立政治大學. ‧. 商學院國際經營管理英語碩士學位學程 碩士論文. sit. y. Nat. er. io. A Thesis. n. a l to International MBA Program Submitted iv n. C. i U e n g c hUniversity NationalhChengchi. in partial fulfillment of the Requirements for the degree of Master in Business Administration. 中華民國一百年八月 August 2011 i.
(3) Acknowledgement. I would like to express all my gratitude to all those who encouraged me during the process of finishing this thesis. I am deeply indebted to my advisor Prof. James Liu whose help, stimulating suggestions and encouragement supported and helped me in all the time of research for the thesis. I would like to thank as well to everyone in the IMBA program at NCCU. They made my stay very pleasant and comfortable.. 政 治 大 possible for me to accomplish a degree in Taiwan. Finally, I want to point out Daniel Andres 立. I would like to thanks in a special way to my family who always supported me. They made Silva Navarro‟s patient encouragement and assistance which enabled me to complete this. ‧. ‧ 國. 學. io. sit. y. Nat. n. al. er. work.. Ch. engchi. ii. i Un. v.
(4) Abstract. Business Plan: New Market Development for Korean Rice Wine in Taiwan By Minhye Kim Bon Ju (本酒) is a company which imports Korean traditional fermented rice wine called Makgeolli to distributors and wholesales in Taiwan. The business plan based on Bon Ju‟s experience will target mainly Korean customers in Taiwan that miss the flavor of Korea, as. 治 政 大some time in Korea. Taiwanese Korean companies or the ones that have traveled and spent 立 rice wine market is monopolized by Taiwan Tobacco and Liquor Corporation for a long time, well as Taiwanese who are accustomed to Korean flavor such as the ones employed in. ‧ 國. 學. and other types of wine in Taiwan‟s market are completely controlled by the major wine production countries. However, the idea it to position Bon Ju (本酒) with an unique flavor. ‧. and differential middle price. Our sales projections for the first year are $9,144,000. We are. y. Nat. seeking an operating line of $394,000 to finance our first year growth. Our initial investment. sit. from co-owners is $210,000 to meet working capital requirements. Bon Ju‟s financial. er. io. statements have demonstrated continuous increases in sales, operating profit and net income. n. al. i n C U for opportunities to acquaint foreignershwith i e nKorean g c hculture.. v. growth ratios from year 1 to year 3. Regarding to this business plan, Bon Ju (本酒) will seek. iii.
(5) Table of Contents Acknowledgement ....................................................................................................................ii Abstract ................................................................................................................................... iii Table of Contents .................................................................................................................... iv List of Figures and Tables ...................................................................................................... vi Executive summary .................................................................................................................. 1. Objective ................................................................................................................... 3. 1.2.. Mission ...................................................................................................................... 3. 1.3.. Keys to Success ......................................................................................................... 3. 2.1.. Company Location and Facilities ........................................................................... 5. 2.2.. Company Ownership ............................................................................................... 5. 2.3.. Start-up Summary ................................................................................................... 5. 立. Situation Analysis............................................................................................................. 8 Product Description ................................................................................................. 8. 3.2.. Market Summary ..................................................................................................... 9. ‧. 3.1.. Nat. 3.2.2.. Market Needs ................................................................................................... 12. 3.2.3.. Market Growth ................................................................................................. 13. sit. y. Market Demographics ...................................................................................... 11. io. 3.2.1.. al. n. 3.3.. Ch. i Un. v. SWOT Analysis ...................................................................................................... 14. engchi. 3.3.1.. Strengths .......................................................................................................... 14. 3.3.2.. Weaknesses ...................................................................................................... 15. 3.3.3.. Opportunities.................................................................................................... 15. 3.3.4.. Threats.............................................................................................................. 16. 3.4.. Competition ............................................................................................................ 17. 3.5.. Buying Patterns and Needs ................................................................................... 18. 3.6.. Products Offered .................................................................................................... 19. 3.6.1. 3.7. 4.. 政 治 大. Company Summary ......................................................................................................... 5. 學. 3.. 1.1.. er. 2.. Introduction ...................................................................................................................... 3. ‧ 國. 1.. Delivery............................................................................................................ 20. Keys to Success ....................................................................................................... 21. Market Analysis Summary ........................................................................................... 22 4.1.. Mission .................................................................................................................... 22 iv.
(6) 4.3.. Gap Dashboard ...................................................................................................... 23. 4.4.. Target Markets....................................................................................................... 24. 4.5.. Positioning .............................................................................................................. 24. 4.6.. Strategies ................................................................................................................. 25. 4.6.1.. Marketing Materials ......................................................................................... 25. 4.6.2.. Referrals ........................................................................................................... 25. 4.6.3.. Advertising ....................................................................................................... 26. 4.6.4.. Web plan .......................................................................................................... 26. 4.6.5.. Distribution Channels ...................................................................................... 27. 4.6.6.. Marketing Calendar ......................................................................................... 28. 5.1.. Sales Strategies ....................................................................................................... 31. 5.2.. Sales Forecast ......................................................................................................... 31. 5.3.. Marketing Expenses Budget ................................................................................. 35. 5.4.. Key Marketing Metrics ......................................................................................... 36. ‧. y. sit. Financial Plan ................................................................................................................. 38 General Assumptions ............................................................................................. 38. 7.2.. Break-even Analysis............................................................................................... 38. 7.3.. Projected Profit and Loss ...................................................................................... 39. 7.4.. Projected Cash Flow .............................................................................................. 41. 7.5.. Projected Balance Sheet ........................................................................................ 42. 7.6.. Business ratios ........................................................................................................ 43. n. al. er. 7.1.. io. 9.. Personnel Plan ........................................................................................................ 37. Nat. 8.. 立. Management Summary ................................................................................................. 37 6.1.. 7.. 政 治 大. Strategy and Implementation Summary ..................................................................... 31. 學. 6.. Marketing Objectives ............................................................................................ 22. ‧ 國. 5.. 4.2.. Ch. engchi. i Un. v. Regulatory Overview ..................................................................................................... 44 8.1.. Duties/Taxes............................................................................................................ 44. 8.2.. Regulatory and Licensing Restrictions or Difficulties ........................................ 44. Summary and Conclusion ............................................................................................. 45. Reference ................................................................................................................................ 47 Appendix 1 .............................................................................................................................. 49 Appendix 2 .............................................................................................................................. 49. v.
(7) List of Figures and Tables Graph 1: Start-up Funding ......................................................................................................... 6 Table 1: Start-up Funding .......................................................................................................... 6 Figure 1: Korean Rice Wine ...................................................................................................... 8 Table 2: Comparison Calorie and Alcoholicity (%) of different alcohol .................................. 9 Table 3: Alcoholic Beverage Market in Taiwan (2002) .......................................................... 11 Table 4: Target Customers ....................................................................................................... 12 Graph 2: Korean Population in Taiwan ................................................................................... 12 Table 5: Taiwanese visitors in Korea....................................................................................... 12 Graph 3: Consumption of imported wine in Taiwan ............................................................... 13. 政 治 大. Table 6: Value Report Global Summary Regional Structure by Quality Segment ................. 18 Figure 2: Plastic bottle ............................................................................................................. 19. 立. Figure 3: Glass bottle ............................................................................................................... 20. ‧ 國. 學. Figure 4: Can............................................................................................................................ 20 Graph 4: Supply Chain system ................................................................................................ 21. ‧. Table 7: Gap Dashboard .......................................................................................................... 24 Graph 5: Retail distribution of Spirits by type of outlet 2003 ................................................. 28. Nat. sit. y. Table 8: Monthly Marketing Calendar .................................................................................... 29. al. er. io. Table 9: Milestone ................................................................................................................... 30. n. Graph 6: Sales Forecast ........................................................................................................... 31. Ch. i Un. v. Table 10: Sales Forecast .......................................................................................................... 32. engchi. Table 11: First Year of Unit Sales Forecast by Customers ...................................................... 32 Table 12: Second Year of Unit Sales Forecast by Customers ................................................. 33 Table 13: Third Year of Unit Sales Forecast by Customers .................................................... 33 Table 14: Yearly Sales Forecast by markets ............................................................................ 34 Table 15: Delivery Cost ........................................................................................................... 34 Graph 7: Annual Expense Budget............................................................................................ 35 Table 16: Marketing Expense Budget...................................................................................... 35 Table 17: Key Marketing Metrics ............................................................................................ 36 Table 18: Personnel-General.................................................................................................... 37 Table 19: General Assumptions for Financial Plan ................................................................. 38 Graph 8: Break-even Analysis ................................................................................................. 39 vi.
(8) Graph 9: Gross Margin Yearly ................................................................................................ 39 Graph 10: Profit Yearly ........................................................................................................... 40 Table 20: Pro Forma Profit and Loss ....................................................................................... 40 Table 21: Pro forma Cash Flow ............................................................................................... 41 Table 22: Pro Forma Balance Sheet......................................................................................... 42 Table 23: Ratio Analysis .......................................................................................................... 43. 立. 政 治 大. ‧. ‧ 國. 學. n. er. io. sit. y. Nat. al. Ch. engchi. vii. i Un. v.
(9) Executive summary Introduction Bon Ju (本酒) offers one of the best quality Korean fermented types of rice wine, also known as Makgeolli, for imports to distributors or wholesales in Taiwan. The target customers in this case are Korean people in Taiwan, who miss the traditional foods and drinks of Korea, and also those Taiwanese who enjoy or have a preference for a unique type of liquor and might be somehow interested in Korean culture. Makgeolli has a deep and rich flavor based on rice, with a sour taste as its main characteristic due to its fermented condition. Currently this type of Korean rice wine is sold over 13 countries around the world. In Japan the ratio of imports of Korean rice wine has seen relevant growth over the past four years. It became popular. 治 政 market research has shown that overall tons of exports 大 of Makgeoulli to Japan have been 立 increasing every year: 3,393tons in 2006, 3,900tons in 2007, 4,891tons in 2008 and 2,909tons there due to the belief of Japanese girls that Korean rice wine may help improve the skin. Our. ‧ 國. 學. in 2009, July. Nevertheless, the Korean rice wine market has not developed yet in Taiwan. Bon Ju (本酒)‟s marketing strategy is to introduce brand new rice wine and broaden the. ‧. drinking markets in Taiwan, since wine culture is widely developed in Taiwan, but the idea in. y. sit. io. n. al. er. rice wine.. Nat. this case is to try to diversify Taiwanese taste by introducing Makgeolli or Korean fermented. The Company. Ch. engchi. i Un. v. Bon Ju (本酒) has a limited number of private investors and does not plan to go public. The company has its main offices in Taipei city, Taiwan. The facilities include conference rooms and office spaces. The company owns a refrigerated truck and warehouse. The company expects to begin offering its services in February 2012.. The Operation Bon Ju (本酒) offers a complete package of imported Korean rice wines. The company‟s operation includes the following:. 1.
(10) . Supplier/buyer identification. . Purchasing, contracting and consulting. . Shipping. . Warehousing. . Delivery. As noted before, Bon Ju (本酒) is able to accomplish all this thanks to its networking experience and because it possesses the necessary facilities to do so (refrigerated truck and warehouse). 政 治 大 Bon Ju (本酒) will be concentrating on servicing just two types of clients, namely distributors 立 and/or wholesales. For both market segments we have secured exclusive contracts or The Market. ‧ 國. 學. endorsements putting us in a unique position to service these niche firms and their needs. Profitability in these two markets is expected to be very good; however we remain realistic. ‧. and expect to have only modest profits in the first three years of operations with a constant. n. al. er. io. sit. y. Nat. and steady increase in the following years.. Financial Considerations. Ch. engchi. i Un. v. Start-up assets required for this business project will include expenses and capital in cash needed to support operations until revenues reach an acceptable level. Most of the company's liabilities will come from outside private investors and management investment. However, we have also considered borrowing from the banking sector as an alternative or complementary option. Thus we have already obtained a loan from the Bank of Kook Min, which is due to be paid off in two years after the operation begin. In addition a long-term loan provided by the Bank of Nong Hyup is also being taken into consideration and it has a due date to be paid off in five years. It is worth noting again that company expects to reach decent profitability in the second year of operation and thus it does not anticipate any serious cash flow problems. We expect that about 1,791 units in sales of our product per month will guarantee a break-even point. 2.
(11) 1. Introduction 1.1.. Objective. The three-year goals for Bon Ju (本酒) are the following: . To achieve break-even point by year 1.. . To retain long-term contracts with local distributors and restaurants in Taiwan, through the emphasis in customer service.. . At this stage, Koreans remain the focal point for target customers.. 1.2.. Mission. 立. 政 治 大. ‧ 國. 學. Our main mission it is based on the import and provision of Korean rice wine. The company will concentrate on the particular and traditional wine from Korea and focus on bringing it into the Taiwanese market. Bon Ju (本酒) offers the best quality rice wine from South Korea. ‧. to Taiwan.. y. Nat. sit. As a long-term goal we have established the objective of becoming the preferred company for. er. io. the import and distribution of Korean rice wine in Taiwan. Bon Ju (本酒) understands that. al. n. iv n C h eandnalso the great Korean population in the island i U people. Our philosophy is to g cforh Taiwanese. the liquor shops and restaurants in Taiwan have demand for this type of unique alcohol for. try to create a long-term relationship with clients so that the delivery of the products becomes a seamless experience that promotes loyalty.. 1.3.. Keys to Success. 1. Unique-new products for Taiwanese market 2. “Healthy” Marketing through current and potential customers, emphasis in targeted efforts, and thanks to our position as a differentiated provider.. 3.
(12) Last decade the so called “healthy” marketing strategy has been positioned in the center of marketing strategies for many companies especially in the food industry, since the notable increment of fat people all over the world. Recently the most prominent movements in Taiwan also try to promote a healthy lifestyle such as the campaigns promoting riding bicycles launched by the Taipei City government. Another example is the high amount of organic food in the market that today prevails in Taiwan. Thus, Bon Ju (本酒) will try to emphasize itself as the provider of the finest Korean rice wine which is believed to be beneficial for those who worry about the negative effects of drinking alcohol in human health.. 立. 政 治 大. ‧. ‧ 國. 學. n. er. io. sit. y. Nat. al. Ch. engchi. 4. i Un. v.
(13) 2. Company Summary 2.1.. Company Location and Facilities. Bon Ju (本酒) will have a refrigerated warehouse located in the Taiwanese northern city and port of entrance for Korean imports, Keelung, within its industrial district. The company will also own a refrigerated truck to guarantee the cold chain is not broken. The administrative office will be located in the Xinyi district of Taipei City.. 2.2.. Company Ownership. 政 治 大. As mentioned briefly, the company expects to have a number of outside private investors. 立. who will own 35% of the company's shares. The rest will be owned by the senior. ‧ 國. 學. management staff, including Ms. Yongja Kim, (30% of ownership), Mr. Yongjae Kim (15% of ownership), Mr. Minjung Kim(15% of ownership), and Ms. Okgeun Ki (5% of ownership).. ‧. According to what was described before, all other financing will come from loans acquired in the Korean banking sector.. er. io. sit. y. Nat Start-up Summary a. n. iv l C n hengchi U Based on the size of our market and our defined market area, our sales projections for the first 2.3.. year are NT $9,144,000. The salary for each of the co-owners will be NT $60,000 per month. We are seeking an operating line of NT $394,000 to finance our first year growth. Altogether, the co-owners will have invested NT $210,000 to meet working capital requirements. It is important to note here that we have acquired already commitments with over 100 clients and plan to aggressively build our client base through referrals. The loving on-site professional care that Bon Ju (本酒) will provide is sure to appeal to Taiwanese people as well as, especially the ones seeking for new experiences in the wine market. The following graph and table depicts the point made above.. 5.
(14) $350,000 $300,000 $250,000 $200,000 $150,000 $100,000 $50,000 $0 Expense. Assets. Investments. Loans. Graph 1: Start-up Funding Table 1: Start-up Funding. 政 治 大. Requirements. Start-up Expenses Legal. 立. NT$30,000. ‧ 國. 學. Insurance. NT$10,000 NT$10,000. Rent. NT$48,000. Accounting and bookkeeping fees. ‧. Utilities. Expensed equipment. NT$103,000. NT$30,000. sit. y. Nat. io. Other. NT$40,000. n. al. er. Advertising. Total Start-up Expenses. Start-up Assets. Ch. engchi U. v ni. NT$35,000. NT$306,000. Cash Required. NT$50,000. Other Current Assets. NT$15,000. Long-term Assets. NT$10,000. Total Assets. NT$75,000. Total Requirements. NT$381,000. Start-up Funding. Start-up Expenses to Fund. NT$306,000. Start-up Assets to Fund. NT$75,000. 6.
(15) Total Funding Required. NT$381,000. Assets Non-cash Assets from Start-up. (NT$25,000). Cash Requirements from Start-up. NT$50,000. Additional Cash Raised. NT$0. Cash Balance on Starting Date. NT$50,000. Total Assets. NT$75,000. Liabilities and Capital. Liabilities. 政 治 大. Current Borrowing Long-term Liabilities. 立. NT$10,000 NT$50,000 NT$20,000. Other Current Liabilities (interest-free). NT$20,000. ‧ 國. 學. Accounts Payable (Outstanding Bills). Total Liabilities. NT$100,000. ‧. Capital. y. Nat. sit. Planned Investment Mrs. Youngja Lee. NT$100,000. er. io. Mr. Yongjae Kim. n. a Ms. Minjung Kim l Ms. Okgeun Ki. Ch. Others. engchi. Additional Investment Requirement. i Un. v. NT$50,000 NT$50,000 NT$10,000 NT$0 NT$0. Total Planned Investment. NT$210,000. Loss at Start-up (Start-up Expenses). (NT$138,000). Total Capital. (NT$250,000). Total Capital and Liabilities. NT$75,000. Total Funding. NT$213,000. 7.
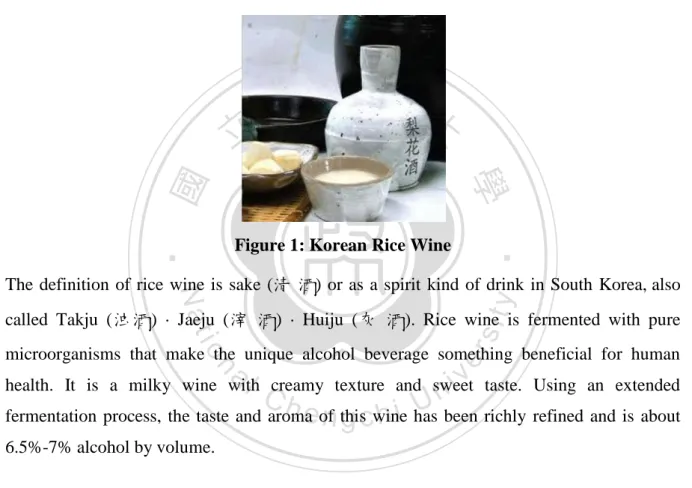
(16) 3. Situation Analysis Bon Ju (本酒) plans to develop a new market and alcohol-based business in Taiwan. In order to do so marketing becomes a significant key to elaborate the business. The basic market need is to supply high-quality rice wine that exceeds other existing products in the market.. 3.1.. Product Description. 政 治 大. 立. ‧ 國. 學 ‧. Figure 1: Korean Rice Wine. y. Nat. The definition of rice wine is sake (淸 酒) or as a spirit kind of drink in South Korea, also. er. io. sit. called Takju (浊酒) · Jaeju (滓 酒) · Huiju (灰 酒). Rice wine is fermented with pure microorganisms that make the unique alcohol beverage something beneficial for human. n. al. i Un. v. health. It is a milky wine with creamy texture and sweet taste. Using an extended. Ch. engchi. fermentation process, the taste and aroma of this wine has been richly refined and is about 6.5%-7% alcohol by volume. The most popular of its kind, also known as Makgeolli, is a type of takju wine that has the longest history among the traditional Korean wines, and it is enjoyed by a broad range of consumers, from urban to rural areas. Most rice wine production brews the wine in a rather high temperature of 30°C so they can shorten the brewing duration down to 3 to 4 days; furthermore, they bottled the uncompleted wine and try to ferment them in bottles during distribution process. As a result, and especially since its fermented condition, Makgeolli contains large amount of gas and has a bitter aftertaste, not to mention the side effect when drunk in excess. 8.
(17) But what is more relevant for this project is that this type of rice wine contains proteins and vitamin B that improves the healthy condition of the skin particularly. Also the appropriate amount of alcohol in the wine helps to improve blood circulation and body metabolism. Rice wine is known to help out in driving impure substances out from a person‟s body thanks to its organic acids like citric and lactic acids that are contained in the wine. There are two main effects that these acids have in a person‟s body. Firstly, their consumption helps the digestion of food. Secondly, it also helps out in breaking down the nutrients in the stomach. In other words, by improving the function of stomach, drinking this type of rice wine can help human body to create energy more easily and drive out impure substances. Studies have revealed that rice wine can have a much healthier effect on human body than other alcohols. A study conducted by Professor Joo, JinSoon and Yu, Taejong from Korea‟s. 政 治 大 increase alcohol level in the blood 立and affects cholesterol level which becomes major reasons Nutrient Research Institute has proven that “regular liquors put pressure on people‟s liver and. ‧ 國. 學. for high blood pressures and other adult diseases. But rice wine, as opposed to other alcohols, contains large amount of protein, sugar, vitamin B2, and etc. Also, as the nutrient value of fermented food is being emphasized, the raw yeast in rice wine is view to lower the. ‧. cholesterol level in blood.”. y. Nat. sit. Commercially, Makgeolli is most commonly available in plastic bottles or aseptic box. er. io. containers. As it is an unfiltered beverage, it is generally shaken before consumption, as the. al. n. iv n C The following table helps to illustratehthe comparison between different types of alcoholic engchi U drinks.. cloudy white portion tends to settle to the bottom, leaving a pale yellow-clear liquid on top.. Table 2: Comparison Calorie and Alcoholicity (%) of different alcohol Alcohol. 3.2.. Calorie per 100ml. Alcoholicity (%). Rice wine. 46. 6. Beer. 37. 4.5. Red wine. 70. 12. Sake. 107. 16. Brandy. 237. 40. Whisky. 250. 43. Market Summary 9.
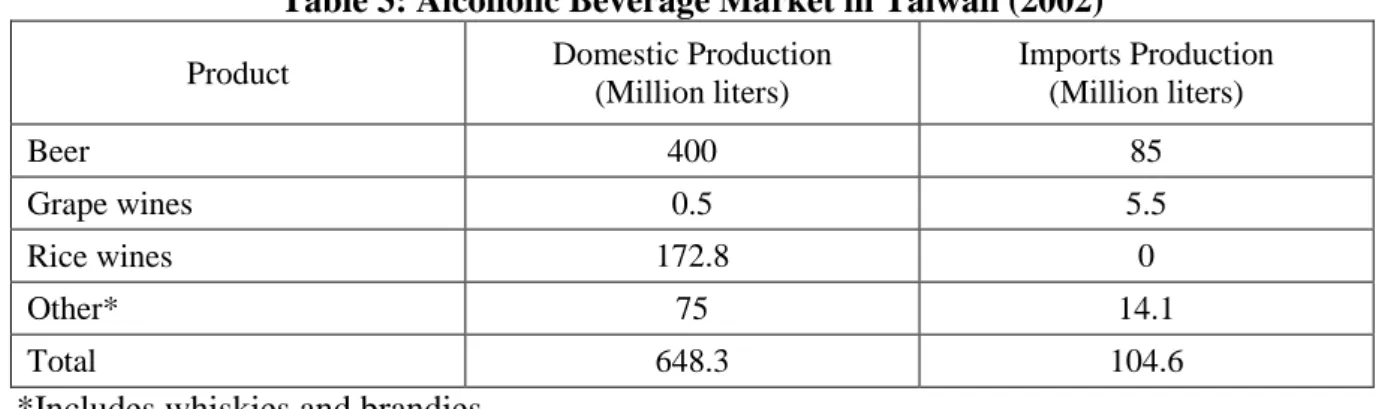
(18) Alcohol Market in Taiwan Several Taiwan food manufacturers, such as Uni- President, Kuang Chuan, Hey Song, Country House, and King Car are looking to capitalize under the current process of liberalization of Taiwan‟s alcohol market to claim a share of Taiwan‟s US$2 billion alcohol market. The Taiwan Tobacco and Wine Board (TTWB), formerly known as Taiwan Tobacco and Wine Monopoly Bureau (TTWMB) has been the only manufacturer of alcohol and tobacco for over 46 years. However, this situation is changing as Taiwan is gradually liberalizing its alcohol market in preparation for its entry into the WTO. The Taiwan authorities passed the administrative regulation for tobacco and liquor in June, 1999. Private firms were allowed to manufacture fruit wines since January 2000, and later on the production of other alcoholic beverages was also allowed, becoming effective in January. 政 治 大. 2001. The manufacture of hard liquor drinks became effective in January 2002, and finally. 立. the manufacture of beer was allowed and became effective by the end of 2002.. ‧ 國. 學. Since they have not yet been granted a license to manufacture alcohol, many companies, as mentioned above, have started to sell imported alcoholic beverages or have asked foreign. ‧. manufacturers to brew alcohol under license for them. The strategy of these companies is to. y. Nat. sell imported alcohol in order to better understand the market in the meantime, while they. sit. prepare themselves for manufacturing their own alcoholic beverages when the market is. er. io. completely liberalized. The fact that these food companies have already strong distribution. al. n. iv n C convenience stores, e.g. Uni-Presidenth (7-Eleven) andi Kuang e n g c h U Chuan (Hi-Life). According to channels helps them to a great extend in this process. In addition, many of them own large. TTWB statistics, currently, the market is around US$2 billion, with beer accounting for the. largest share at US$758 million. The TTWB has a market share of US$1,212 million and imported alcohol has a share of US$909 million. The following table illustrates this.. 10.
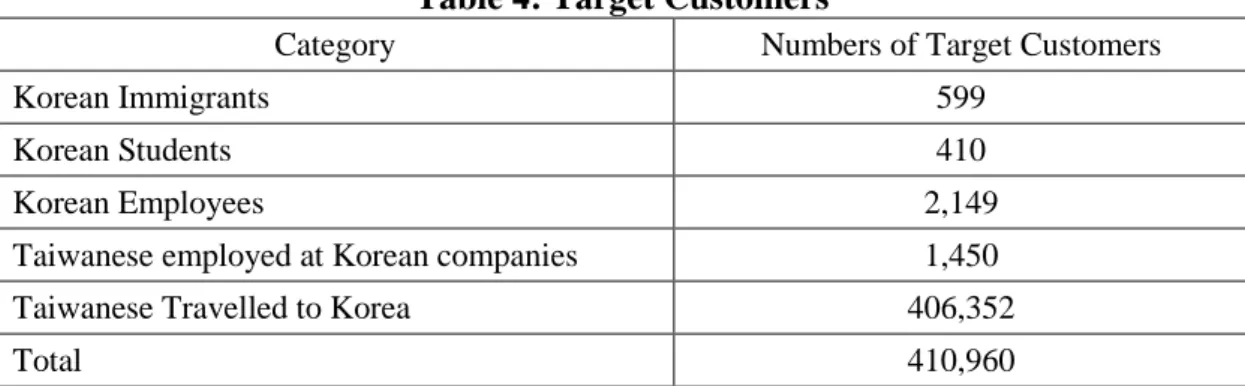
(19) Table 3: Alcoholic Beverage Market in Taiwan (2002) Domestic Production (Million liters). Imports Production (Million liters). Beer. 400. 85. Grape wines. 0.5. 5.5. 172.8. 0. 75. 14.1. 648.3. 104.6. Product. Rice wines Other* Total. *Includes whiskies and brandies. Sourced by Agexporter. 3.2.1. Market Demographics. 政 治 大. The profile of Bon Ju (本酒)‟s customers consists of the following geographic and demographic characteristics:. ‧ 國. 學. Geographic. 立. Bon Ju (本酒) sells primarily to Koreans in Taiwan and Taiwanese who somehow can relate. er. io. sit. y. Nat. Demographics. ‧. to Korean culture and have a positive impression of Korean cuisine.. The total targeted population is estimated to be around 410,960 people. From that total, 3,158. n. al. Ch. i Un. v. are Koreans consumers living in Taiwan. This segment of the market already knows the. engchi. product and thus misses its original flavor. The total also contains 1,450 Taiwanese people who work with Korean companies and thus can relate to Korean culture and traditions. The rest is comprised by about 406,352 Taiwanese people that visit Korea last year, assuming that they have somehow experienced the original flavor of Korean rice wine because of their time spent in Korea. It is worth noting that most of these numbers have been increasing in the last few years and they are expected to keep their ascendant trajectory. The following tables and graphs depict the above mentioned.. 11.
(20) Table 4: Target Customers Category. Numbers of Target Customers. Korean Immigrants. 599. Korean Students. 410. Korean Employees. 2,149. Taiwanese employed at Korean companies. 1,450. Taiwanese Travelled to Korea. 406,352. Total. 410,960. Sourced by National Immigration Agency, Ministry of the Interior, 2011 3500 3400 3300 3200 3100. 立. 3000. ‧ 國. 2800. 學. 2900. 政 治 大. 2003. 2005. 2007. 2009. ‧. sit. y. Nat. Graph 2: Korean Population in Taiwan Sourced by Ministry of Foreign Affairs Trade, Republic of Korea. io. al. Total visitors of Taiwanese in Korea. n. Year. er. Table 5: Taiwanese visitors in Korea. Purpose of visit in Korea. i Businessn C hTrip U engchi 326,224 582. v. Official Business 114. Study. 2006. 338,162. 483. 2007. 335,224. 326,189. 603. 139. 609. 2008. 320,244. 310,545. 525. 152. 738. 2009. 380,628. 372,043. 597. 175. 876. 2010. 406,352. 397,162. 539. 83. 1,137. Sourced by Korean Tourism Organization. 3.2.2. Market Needs Bon Ju (本酒) provides its customers with high quality Korean rice wine as brand new products for the alcoholic beverages market in Taiwan. In doing so, Bon Ju (本酒) seeks to 12.
(21) fulfill the following benefits that are considered to be important from the customers‟ point of view: . High quality rice wine. . Fresh product. . Special drink, alternative drink. . No health concerns. 3.2.3. Market Growth 1500 1000. 立. 500. 政 治 大. still light wine sparkling wine. 2000 2005 2006 2007. 學. 0. 2008. light aperitilis other wines. 2009. ‧. ‧ 國. fortified wine. F'cast 2010. y. Nat. al. er. io. sit. Graph 3: Consumption of imported wine in Taiwan Sourced by IWSR, 2009. v. n. World alcohol market is enormous, reaching a size of about USD 1,700 billion and it is. Ch. i Un. expected to grow up to 1.39% every year. It is not only big as a market itself but also has. engchi. huge economic effect due to the packages involved, distribution of products and restaurant businesses. Alcohol market always steadily grows as finance grows. In 2008, world wine consumption reached 2.621 billion 9-litre cases, the equivalent of 31.452 billion bottles, and a 5.64% increase compared to 2004. In Taiwan, as the previous graph shows, the wine consumption has increased significantly since 2000. Still light wines account for most of the market in Taiwan. However, record growth in sales rates came to a sudden stop when in 2008 the global financial crisis spoiled the party and led to a drop in liquor and wine imports. In 2008, the amount of foreign wine shipped to Taiwan decreased by 14% and in 2009 by another 33%. Amid these decreasing sales, neither the US nor the EU is willing to make concessions on the seemingly harmless 13.
(22) rice wine. According to the forecasts in a Vinexpo / IWSR study, consumption should grow by a further 3.57% between 2009 and 2013 to reach 2.7 billion 9-litre cases.. 3.3.. SWOT Analysis. The following SWOT analysis provides the strengths and weaknesses of the company, and demonstrates the opportunities and threats that Bon Ju (本酒) is facing when trying to develop operations in the Taiwanese market.. 政 治 大 Uniqueness - Healthy new alcoholic drink for the market in Taiwan 立. 3.3.1. Strengths. . Wide range of choice - Variety in products and their taste. 學. . ‧ 國. . End-to-End storage and transportation - Understanding the difficulties of delivery due to the products‟ sensitivity to high temperatures. Convenience - Easy to buy anywhere in Taiwan.. Nat. y. ‧. . sit. Firstly, Bon Ju (本酒) sells nutritious and healthy rice wine since this product contains a. er. io. lactic acid bacteria and dietary fiber, both having an extensive range of positive effects for the. al. n. iv n C burning fat, prevents constipation, ameliorate symptoms and help improve the h e n gmenopausal chi U human body; e.g. prevention of liver damage, anti-cancer effect, increase of metabolism,. skin care.. Secondly, Korean rice wine has many different production outcomes. The taste of rice wine depends on the mixture of its main substance, rice or wheat, plus adding other ingredients like fruits or medicinal herbs to develop a wide range of flavors. Current rice wine variety includes ginseng, rubus coreanus fruit, bamboo, apple, strawberry and pear flavors. In addition Korean rice wine has not only low value products but also exclusive products. Thirdly, because of its fermented condition, this type of rice wine is very sensitive to temperature fluctuation. Thus the company can secure the refrigerated transportation and storage of the products to maintain the best quality of this wine. Finally, Bon Ju (本酒) plans 14.
(23) to sell all retailers in Taiwan through wholesales and distributers, making the product readily available for the consumers, who will no longer have to go to expensive restaurants or import stores to drink or buy this type of Korean wine. Bon Ju (本酒) will place the product directly where consumers demand requires it.. 3.3.2. Weaknesses . Delicate control of temperature to guarantee the high quality of products. . Short expiration date. . Costs of storage and transportation in refrigerated facilities. 治 政 大 in order to maintain its good sensitive to high temperature so this must be controlled carefully flavor. Delivery of the product立 in plastic bottles as it is often distributed might be a risk Because of the fermented condition of this type of Korean rice wine, it is very delicate and. ‧ 國. 學. especially in Taiwan, which as marine tropical climate island posses a long and humid summer. The only solution is to consolidate the refrigerated transportation of the product. ‧. even though it may be costly. Because of a similar reason, this type of rice wine has also a shorter expiration date than other types of white or red wine. Using refrigerated facilities at. y. Nat. sit. all times during its storage and delivery must be guaranteed although it may imply a higher. n. al. er. io. cost for the company‟s expenses.. 3.3.3. Opportunities. Ch. engchi. i Un. v. . Possibility to promote Korean popular culture in Taiwan. . To extend market targets from young generation to middle aged people. . To create synergy effects with Korean restaurants all over Taiwan. Korean rice wine has historically been an “only for Koreans” unique traditional wine, especially if we understand that the food of a country is usually embedded with that nation‟s own characteristics. Accordingly, the imports of Korean rice wine can become a great chance to introduce Korean traditional culture, in this case its drinking culture, to the Taiwanese market. Until now the consumption of rice wine in Taiwan has generally been attached to low-income customers, however, Korean rice wine can be targeted to a different segment of 15.
(24) population since it has its own special flavor and diversity of choices within the products. That is the unquestionable focus here, especially considering all those middle or upper class Taiwanese visitors that spent time in Korea and would appreciate to have access to these products in Taiwan as well. Indeed, Korean restaurants are one of the most favorite places for dinner appointment in Taiwan, thus a very important aspect when selling rice wine to distributors in this business will be the creation of synergy effects with the big amount of Korean restaurants in Taiwan.. 3.3.4. Threats . Enormous competitors with massive investments from Japan, Italy, France, Spain, USA,. 政 治 大 Taiwanese hot and subtropical weather 立 Not a first mover Australia and Chile in the wine market. . 學. ‧ 國. . In despite of the global economic recession, Taiwan is the one of the countries that is steadily. ‧. growing in economic terms every year. However, due to the high taxes and regulation on the imports of wine, Taiwan is indeed a difficult market to enter. Moreover, the demand of wine. y. Nat. sit. in Taiwan is very low, due to the lack of drinking culture of Taiwanese people in comparison. al. er. io. to other nations. France is the dominant source of supply of grape based wine, with a market. n. share of 57 percent, followed by Australia with 9 percent, Chile with 9 percent and the USA. Ch. i Un. v. with 8 percent. Italian and Spanish wines have been introduced and promoted in recent years.. engchi. Italy has around 5 percent of market share and Spain has now about 4 percent of it. In addition, and more specifically about rice wine, 90 percent of its imports comes from Japan, making Korean rice wine relatively unknown in Taiwan. This although it may be considered as a threat, it also underscores a considerable scope for a new market development. This should include generic promotion to develop consumers‟ awareness of Korea as a premium new world source of wine. Another possible threat comes from the type of climate in Taiwan, as an island country having marine tropical weather and often having typhoons and earthquakes. The type of weather will be a challenge when it comes to the delivery of products making sure to avoid. 16.
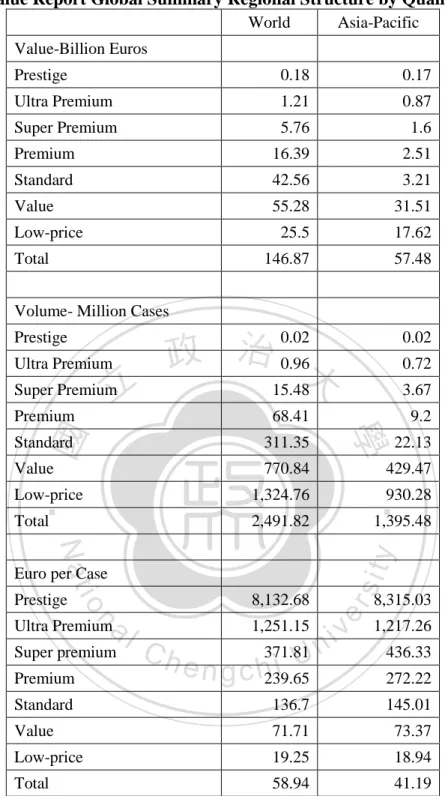
(25) their deterioration. This issue will be tackle properly as mentioned before in this chapter thanks to appropriate refrigerated transportation and storage facilities. Lastly, we acknowledge the fact that the company is not a first mover supplying rice wine for the Taiwan alcoholic beverages market. Rice wine is a traditional drink in East Asia, and the Japanese influence Taiwan have historically make Taiwanese people more pervasive to the taste of sake. Japan is indeed the biggest trade partner of Taiwan while Taiwan is the second greatest sake destination for this Japanese product which is much consolidated in the country. While early developers of this rice wine market have now their brand names strongly established, there are however new opportunities for more competitors to diversify the range of wines available as wine tastes mature in Taiwanese people. There is a considerable interest in quality wines from new source countries, including Korea.. 立 Competition. ‧ 國. 學. 3.4.. 政 治 大. The competition for our company is fierce in Taiwan and includes nationwide wine firms. ‧. from all over the world, such as Japan, France, Chile and Australia, and also all the potential. sit. y. Nat. importing firms that serve small enterprises in Taiwan. Practically speaking, this means that the largest rice wine firms that have a big presence in Taiwan, such as Suntory, Kirin and. io. n. al. er. other large companies will become our primary competitors. Indeed, most wine companies. i Un. v. tend to be spread worldwide, making competition within the industry very intense.. Ch. engchi. Nevertheless, through our niche strategy we intend to avoid competition, by emphasizing and distinguishing Korean rice wine as something different and unique that nobody else is offering in the Taiwanese market, and also at a very accessible price.. 17.
(26) Table 6: Value Report Global Summary Regional Structure by Quality Segment World. Asia-Pacific. Value-Billion Euros Prestige. 0.18. 0.17. Ultra Premium. 1.21. 0.87. Super Premium. 5.76. 1.6. Premium. 16.39. 2.51. Standard. 42.56. 3.21. Value. 55.28. 31.51. 25.5. 17.62. 146.87. 57.48. Low-price Total Volume- Million Cases Prestige Ultra Premium. 立. Super Premium. 0.02 0.72 3.67. 68.41. 9.2. 學. ‧ 國. Premium. 0.02 政 治 0.96大 15.48 311.35. Value. 770.84. 429.47. Low-price. 1,324.76. 930.28. Total. 2,491.82. n. Super premium. Ch. 1,251.15 371.81 i U e n g c h239.65. sit. 8,132.68. er. io. al. Ultra Premium Premium. 1,395.48. y. Nat. Euro per Case Prestige. 22.13. ‧. Standard. v ni. 8,315.03 1,217.26 436.33 272.22. Standard. 136.7. 145.01. Value. 71.71. 73.37. Low-price. 19.25. 18.94. Total. 58.94. 41.19. Source: The IWSR/ IWSR calculations based on volumes NOTE: Duty Free and Rest of World have not been analyzed in this table.. 3.5.. Buying Patterns and Needs. Companies usually enter into contracts with import/export firms based on a firm's reputation for professionalism and service. With no proven track record, a star-up import/export 18.
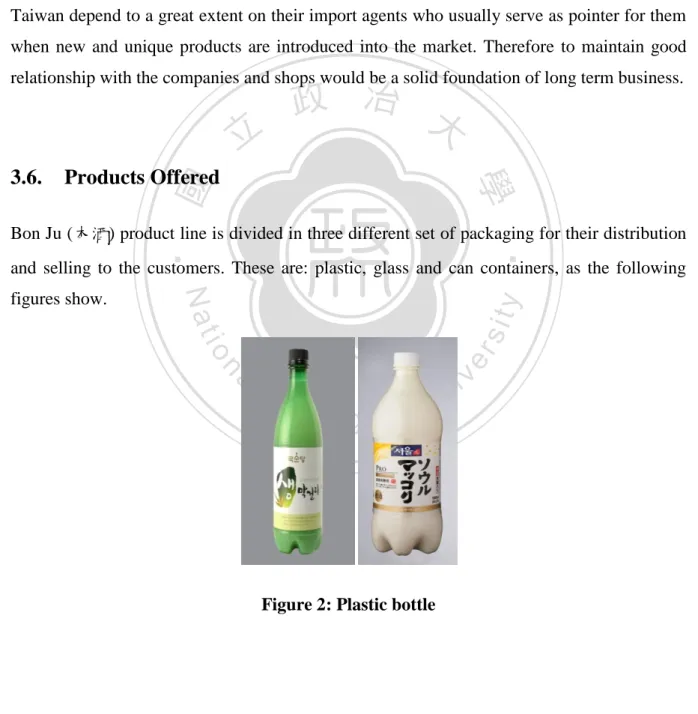
(27) company obtains a "good reputation" through its personnel, people who have experience in other businesses in the industry and a sort of established network which the company can make good use of. Price, reliability and scope are the driving factors for accepting contracts, especially if the import / export company is small like in our case. We acknowledge that our niche clients have different needs for us to meet and to which we must adapt. Our clients need to have relatively small quantity of products moved from South Korea, thus we are not talking about big shipments divided in the span of a long time. In addition, small companies and stores in Taiwan depend to a great extent on their import agents who usually serve as pointer for them when new and unique products are introduced into the market. Therefore to maintain good relationship with the companies and shops would be a solid foundation of long term business.. 立 Products Offered. ‧ 國. 學. 3.6.. 政 治 大. ‧. Bon Ju (本酒) product line is divided in three different set of packaging for their distribution and selling to the customers. These are: plastic, glass and can containers, as the following. n. al. er. io. sit. y. Nat. figures show.. Ch. engchi. i Un. Figure 2: Plastic bottle. 19. v.
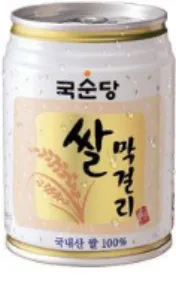
(28) Figure 3: Glass bottle. Figure 4: Can. In addition to the variety in the products, Bon Ju (本酒) plans to provide the Taiwanese market with two of the most popular, trusted and prestigious Korean brands of rice wine. These are:. 政 治 大. . Kooksoondang Brewery CO.LTD. . E-dong CO.LTD. ‧. ‧ 國. 學. 3.6.1. Delivery. 立. y. Nat. As mentioned before, Bon Ju (本酒) offers end-to-end refrigerated storage and transportation. io. sit. solutions for rice wine as a temperature-sensitive consumable product. We will enable our. n. al. er. customers to preserve product value across the supply chain. Our solution helps to deliver. i Un. v. higher quality rice wine, increase profitability, ensure consumer safety and protect brand equity.. Ch. engchi. Thus, Bon Ju (本酒) will provide an integrated cold-chain solution across the total supply chain involving production, storage and distribution of this perishable product that, because of its fermented condition, requires precise temperature control to retain the product‟s characteristics, active ingredients, freshness and nutritive value. The following scheme tries to depict the whole supply chain planned for this purpose.. 20.
(29) Factory (Point. Transport by freezer. Shipping by reefer. of production). truck. Cold Storage. Transport by freezer. Cold Storage. truck. Retail outlets/restaurants/ hotels/clubs/etc. 政 治 大 Graph 立 4: Supply Chain system. ‧ 國. 學. Bon Ju (本酒) understands the complexities of delivering fermented rice wine with certain temperature and conditions, thus we aim to strengthen the end to end system to minimize. ‧. losses. We provide cold storage and refrigerated transportation / trucking facilities in an integrated model until we reach our clients in retail outlets, restaurants, hotels, clubs and. y. Nat. sit. others in Taiwan. Our warehouse provides storage solutions while our reefer / freezer trucks. al. er. io. help in inbound and outbound transportation guaranteeing the cold-chain needed in this case.. n. We will deliver fresh goods through point to point and within city limits distribution.. 3.7.. Ch. engchi. i Un. v. Keys to Success. . Uniqueness - new products for Taiwanese market. . Healthy Marketing - targeted efforts through current and potential clients and through positioning the company as a differentiated provider of healthy drinks.. 21.
(30) 4. Market Analysis Summary Bon Ju (本酒) „s marketing strategy will build a following through incentive marketing, advertising and direct selling to importers in Taiwan who provide premium and imported alcohol. As part of this plan, the company expects to maintain a website to promote its products and keep communication with current and possible clients. Bon Ju (本酒) expects to capitalize on its self image as a differentiated provider of the highest quality rice wine from South Korea. The primary goal of the marketing efforts will be to encourage product awareness on existing and potential customers.. 4.1.. Mission. 立. 政 治 大. The company‟s main mission is to offer the finest quality rice wine from Korea to consumers. ‧ 國. 學. in Taiwan, in a fast and efficient way. We exist to attract and maintain customers. By having a strict adherence to this maxim, we believe that success can be ensured, since our products. ‧. will exceed the expectations of our customers.. sit. y. Nat. n. al. er. Marketing Objectives. io. 4.2.. Personal Objectives:. Ch. engchi. i Un. v. . Devote at least 40 hours per month specifically to marketing. . Set up operations so that it is possible to take two weeks vacation in second year of operation. Business Objectives: . Achieve total annual revenue of over $800,000 in year 2. . Achieve an average monthly transactions per customer of 3 by end of year 3. . Decrease the customer acquisition costs by 5% per year.. . Holding spending, as a percentage of sales, at a specific level. 22.
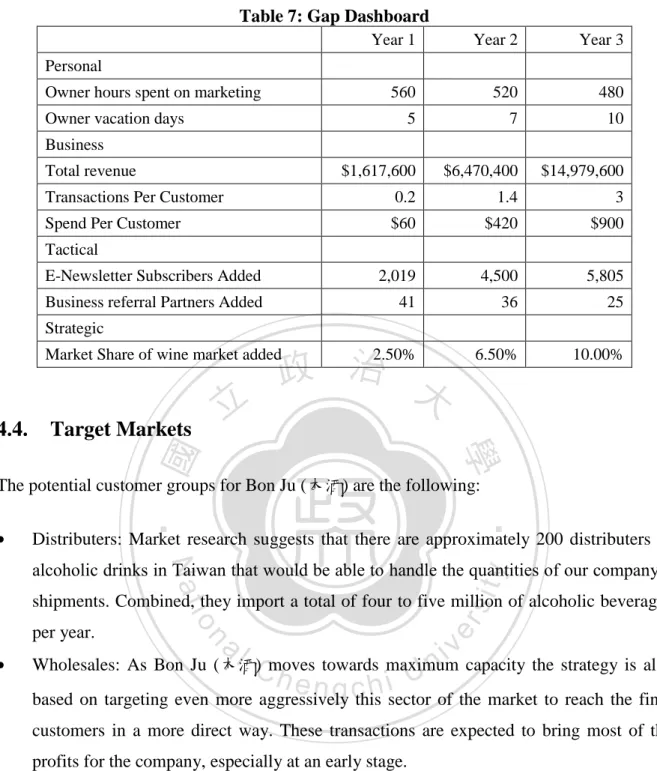
(31) . Decrease the overhead fixed costs as a percentage of sales.. Strategic Objectives: . Maintain positive, steady growth each quarter.. . Achieve 99.5% customer satisfaction (199 in 200 customers leaves satisfied). . Achieve 10% of rice wine market customers in Taiwan by end of year 3. Tactical Objectives:. . 學. 4.3.. 政 治 大 Have 100 business referral partners by end of year 3 立 Reach 6,000 e-newsletter subscribers by end of year 3. ‧ 國. . Gap Dashboard. ‧. y. Nat. Accordingly, the company‟s Gap Dashboard will be reviewed on a monthly basis, including. al. er. io. Personal goal results are tracked by Bon Ju ( 本 酒 ) directly to make sure of the. n. . sit. many key marketing metrics that will be reviewed on a weekly basis as it is shown below:. Ch. i Un. v. achievement of recognition, devoting enough time to marketing work and acquiring a sustainable work-life balance. engchi. . Business goal results are tracked by the accounting system. . Tactical goal results are tracked in the CRM system where all information related to these tactics is recorded. . Strategic goal results are tracked by Bon Ju ( 本酒) on a monthly basis, based on customers‟ complaints (to determine satisfaction level) and financial reports (to determine market share achievement). 23.
(32) Table 7: Gap Dashboard Year 1. Year 2. Year 3. 560. 520. 480. 5. 7. 10. $1,617,600. $6,470,400. $14,979,600. Transactions Per Customer. 0.2. 1.4. 3. Spend Per Customer. $60. $420. $900. E-Newsletter Subscribers Added. 2,019. 4,500. 5,805. Business referral Partners Added. 41. 36. 25. 6.50%. 10.00%. Personal Owner hours spent on marketing Owner vacation days Business Total revenue. Tactical. Strategic 2.50% 政 治 大. Market Share of wine market added. 立. Target Markets. 學. ‧ 國. 4.4.. The potential customer groups for Bon Ju (本酒) are the following:. ‧. . Distributers: Market research suggests that there are approximately 200 distributers of. Nat. sit. y. alcoholic drinks in Taiwan that would be able to handle the quantities of our company‟s. . er. al. n. per year.. io. shipments. Combined, they import a total of four to five million of alcoholic beverages. Ch. i Un. v. Wholesales: As Bon Ju (本酒) moves towards maximum capacity the strategy is also. engchi. based on targeting even more aggressively this sector of the market to reach the final customers in a more direct way. These transactions are expected to bring most of the profits for the company, especially at an early stage.. 4.5.. Positioning. Taiwan wine market is full of players from the major wine producer countries. However, Bon Ju (本酒) does not expect to pose a threat to them but mainly to compete with other Korean rice wine importers. Thus, as mentioned before, we will target mainly Korean and Taiwanese costumers that of course have an awareness of the particular characteristics of our products. 24.
(33) Bon Ju (本酒) will position itself as a high-end Korean rice wine distributor in Taiwan, but at a reasonable price. Indeed we expect that Bon Ju (本酒)‟s customers will care mostly about the quality of the product because they acknowledge its condition of fermented wine that is very sensitive to high temperature.. 4.6.. Strategies. The single main objective of the company is to position Bon Ju (本酒) as the primary distributer of Korean rice wine and to acquire country-wide recognition for doing to with the best quality in products. The marketing strategy will seek to first create customer awareness. 政 治 大 later one working towards building a firm customer loyalty. Bon Ju (本酒) ideal is to brand 立 regarding the products offered, following by the development of a solid customer base, and. its name as a synonymous with the highest quality of Korean rice wine available in. ‧ 國. 學. Taiwan. To send this clear message to current and possible clients will be the main marketing strategy used by Bon Ju (本酒) through a variety of methods and marketing materials.. ‧ sit. y. Nat. al. er. io. 4.6.1. Marketing Materials. n. Marketing materials for Bon Ju (本酒) will include the following items:. Ch. engchi. . General business cards. . Tri fold brochure/menu. . Business referral program brochure. . Bon Ju (本酒) website. . Banner online, ads on facebook.com. . Text ads on Google Adwords. . Poster ads on mass transit. 4.6.2. Referrals 25. i Un. v.
(34) Bon Ju (本酒) recognizes that developing close and communicative relationships with their clients is very important to maintaining a sustainable business. In order to do so, the company will seek referrals among their current and possible clients, mainly bars, night clubs, KTV places, Korean restaurants, hotels, retail outlets, etc. All of those can help share the development of strategic relationships with Bon Ju (本酒). Thus, we plan to offer a six month promotion to individuals from these firms. During the six months, we will use motivational devices such as free gifts, compensations, special pricing, and 10% incentives of the total amount of products that might be sold in their particular business. We hope that these firms will pass on the information about this deal to their employees, as it is in keeping with their own mission and an additional perk they can offer to their staff.. 政 治 大. 立. 4.6.3. Advertising. Bon Ju (本酒) plans to use advertisements via local pay-per-click advertising system mainly. ‧ 國. 學. on the web engine run by Google Adwords in order to increase brand awareness. Alternative advertising will be considered as well on a more traditional format like posters public. ‧. transportation where a high visibility can be acquired, especially buses and MRT.. n. al. er. io. sit. y. Nat 4.6.4. Web plan. Ch. i Un. v. As mentioned, one of Bon Ju (本酒)‟s marketing strategies is to build up a website that will. engchi. have the dual goal of encouraging visitors to first sign up for Bon Ju (本酒) e-newsletter and also to visit the physical stores. Products will not be available to be purchased over the website, but a menu with images of all items will be included as well as promotional items such as t-shirts and cups for sale. The website's main sections will be: . Menu, including monthly specials. . Locations (including map) and hours. . Contact information (in the form of questions and comments), including links to follow Bon Ju (本酒) on Twitter or be a fan on Facebook. 26.
(35) . Jobs page with open positions in the company. . Archived newsletters with articles on rice wine topics and cooking tips.. We are hoping that by increasing the availability of rice wine in the market this will at the same time help to increase the website's visibility. Those who link to the archived newsletter articles will also be encouraged to sign up for the bi-monthly newsletter by giving their name and email address. The newsletter will include promotions as well as valuable information for prospects of business. After becoming acquainted with enough information about Bon Ju (本 酒) and its products thought the online marketing, we expect that these possible clients will make Bon Ju (本酒)‟s rice wine their choice of consumption.. 立. Social Media Plan. 政 治 大. A Facebook mirror page for Bon Ju (本酒)'s site will be another instance to promote the e-. ‧ 國. 學. newsletter to those who sign up as fans. Facebook-only promotions will be offered from time to time to encourage fans to share the website with their friends. The Facebook page will. ‧. have the same goal as the website: to encourage possible customers to try our Korean rice. sit. y. Nat. wine in person. The Facebook page will have an additional goal of deepening the connection. io. er. between existing customers and Bon Ju (本酒) by providing a means for them to interact with Bon Ju (本酒) beyond their visits to the stores or places where products are sold. For example,. n. al. Ch. i Un. v. Bon Ju (本酒) customers will be encouraged to post discussion topics about rice wine and. engchi. Korean food and to post photos of themselves. A Twitter account will also be utilized. Tweets will be sent out when fresh items are available, and will be used to encourage followers to tell their friends (for example: "Ginseng rice wine is available now. First to retweet gets a second bottle free!").. 4.6.5. Distribution Channels As mentioned before, Bon Ju (本酒) products will be sold to the following clients: 1. Off premise markets: including bars, pubs, clubs, KTV (karaoke premises), hotels, restaurants and specialized wine stores. This comprised 50 percent of wine sales in 27.
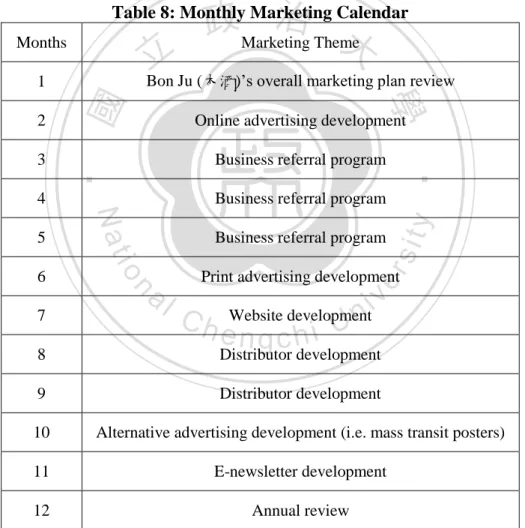
(36) 2007. 2. On premise markets: including supermarkets, convenience stores, department stores and hypermarkets. This comprised the other 50 percent of wine sales in 2007. In addition is it important to note that there are two main sales channels for importing wine into the Taiwanese market: . An estimated 70 percent of wine imported to Taiwan is distributed through: Importer Distributor Retail outlets/restaurants/hotels/clubs/etc. . The remaining 30 percent is distributed through: Importer own retail outlets Restaurants/hotels/pubs/clubs/wine stores/etc. 政 治 大. Korean rice wine is mainly distributed to the high-end HRI and retail sectors.. 立. ‧ 國. 學. specialists, 47%. supermarkets/hype rmarkets, 35%. ‧ y. sit. io. n. al. independent food stores, 3%. er. Nat. convenience stores, 15%. Ch. engchi. i Un. v. Graph 5: Retail distribution of Spirits by type of outlet 2003 Sourced by Euro monitor international, retailing in Taiwan, 2003. 4.6.6. Marketing Calendar The marketing calendar has been set in advance by the owner of Bon Ju (本酒). Monthly marketing themes will focus the efforts on different aspects of the general marketing strategy so that all the elements described above can be considered seriously and developed fully every year.. 28.
(37) Milestones refer to the developmental activities during the four months prior to the business launch on February 1, 2011. On a daily basis, the owner will devote the hours of 3 pm to 5 pm to marketing activities. Of this time, at least 10 hours per month will be devoted to the marketing theme. The rest of the time will be spent on development of the e-newsletter, creation of promotions, business referral marketing/business development and other ongoing activities. In addition, on a weekly basis, the sales and marketing critical numbers (actual sales versus forecast, actual marketing expenses versus forecasted, and key marketing metrics) will be reviewed by the owner. This most probably will be carried out every Monday, with a report generated from the previous week. The followings tables attempt to illustrate this.. 治 政 Marketing 大 Theme. Table 8: Monthly Marketing Calendar Months. 立 Bon Ju (本酒)‟s overall marketing plan review. 1. 8. sit. y. al. er. Business referral program. n. 7. Business referral program. io. 6. Business referral program. Nat. 5. ‧ 國. 4. Online advertising development. ‧. 3. 學. 2. Print advertising development. Ch. i Un. Website development. engchi. v. Distributor development. 9. Distributor development. 10. Alternative advertising development (i.e. mass transit posters). 11. E-newsletter development. 12. Annual review. 29.
(38) Table 9: Milestone Advertising. Start Date. End Date. Budget. Print advertising development. June/1/2012. June/1/2012. $15,000. Print advertising purchased. June/1/2012. June/15/2012. $2,500. Poster advertising development. October/1/2012. October/1/2012. $12,000. Poster advertising purchased. October/1/2012. October/15/2012. $3,000. Total Advertising Budget. $32,500. Referral Marketing Create target list of businesses Design business brochures Design free gifts (cups, T-shirts) Print business brochures. 立. End Date. Budget. March/1/2012. March/15/2012. $0. March/15/2012. March/30/2012. $12,000. March/30/2012. $10,000. April/1/2012. $30,000. April/1/2012. $16,000. May/31/2012. $5,000. March/15/2012 政 治 大 April/1/2012 April/1/2012. Send brochures, gifts and contact businesses. 學. ‧ 國. Free gifts purchased. Start Date. May/1/2012. Total Referral Marketing Budget. July/1/2012. n. al. Website goes live Total Web Development Budget. Ch. July/1/2012n engchi U. Other. July/1/2012. y. io. Adwords campaign development. July/1/2012. Budget $15,000. July/1/2012. $2,000. July/15/2012. $1,500. July/1/2012. $0. er. Facebook Page development. July/1/2012. End Date. sit. Start Date. Nat. Website development. ‧. Web Development. $73,000. iv. $18,500. Start Date. End Date. Budget. Design logo. February/1/2012. February/15/2012. $12,000. Design and purchase signage. February/1/2012. February/15/2012. $13,000. February/15/2012. February/15/2012. $7,000. Design and purchase business cards Total Other Budget. $32,000. Totals. $156,000. 30.
(39) 5. Strategy and Implementation Summary Bon Ju (本酒)‟s business strategy is to enter a focused and specialized market where it can offer a higher standard of products to its clients. This will allow us to charge a slightly higher fee to our clients for these differentiated services but always keeping a reasonable price.. 5.1.. Sales Strategies. Bon Ju (本酒) plans to establish close contacts with potential customers in order to develop and increase its sales. A good way to do so if by offering free consultation in terms of overall cost, service and delivery to possible clients.. 5.2.. Sales Forecast. 立. 政 治 大. Sales are based on various contracts acquired from the two different market segments,. ‧ 國. 學. namely, off premise markets and on premise markets. Sales will vary month to month but expect to be highly cyclical. The following graph and tables depict this forecast and give. y. sit er. al. n. $12,000,000. io. $14,000,000. Nat. $16,000,000. ‧. more detailed information in these regards.. $10,000,000 $8,000,000. Ch. engchi. i Un. v. On-premise markets. $6,000,000. Off-premise markets. $4,000,000 $2,000,000 $0 Year 1. Year 2. Year 3. Graph 6: Sales Forecast. 31.
(40) Table 10: Sales Forecast Year1. Year2. Year3. Off-premise markets. 3,000. 12000. 27000. On-premise markets. 2,760. 11040. 26460. Total Unit Sales. 5,760. 23040. 53460. Off-premise markets. 300. 300. 300. On-premise markets. 260. 260. 260. Off-premise markets. $900,000. $3,600,000. $8,100,000. On-premise markets. $717,600. $2,870,400. $6,879,600. $1,617,600. $6,470,400. $14,979,600. 治 政 $169.68 $169.68 大 $169.54 $169.54. $169.68. Unit Sales. Unit Prices. Sales. Total Sales Direct Unit Costs Off-premise markets. 立. On-premise markets. $169.54. Direct Cost of Sales. $2,036,215. 學. $4,581,483. On-premise markets. $467,931. $1,871,726. $4,486,038. Subtotal Direct Cost of Sales. $976,985. $3,907,940. $9,067,521. ‧ 國. $509,054. ‧. Off-premise markets. sit. weekly. monthly. yearly. Offpremise markets. Onpremise markets. 576. 300. 276. er. al. n. Korean Immigrants Korean Students Korean Employees Taiwanese employed at Korean companies Taiwanese experienced original flavor Total. Total bottle consumption. Frequency of drink. io. Numbers of Target Customers. y. Nat. Table 11: First Year of Unit Sales Forecast by Customers. i n U 48. v. 599. Ch 2. 410. 3. 31.00. 125. 1,497. 780. 717. 2,149. 5. 40.00. 158. 1,901. 990. 911. 1,450. 4. 28.00. 110. 1,325. 690. 635. 406,352. 1. 10.00. 38. 461. 240. 221. 121. 479. 5,760. 3,000. 2,760. 410,960. e12.00 ngchi. 32.
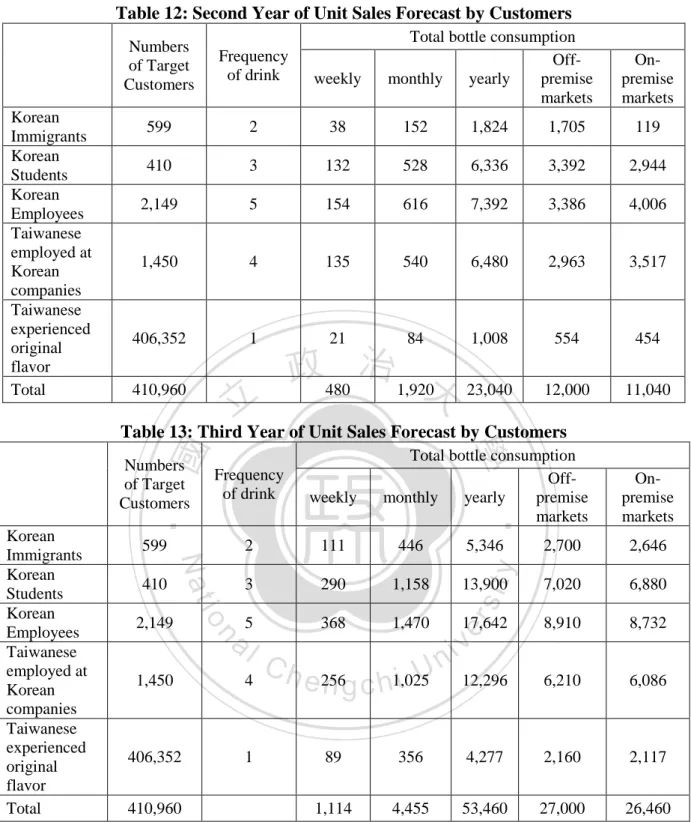
(41) Table 12: Second Year of Unit Sales Forecast by Customers. Korean Immigrants Korean Students Korean Employees Taiwanese employed at Korean companies Taiwanese experienced original flavor Total. Total bottle consumption Offmonthly yearly premise markets. Numbers of Target Customers. Frequency of drink. weekly. 599. 2. 38. 152. 1,824. 1,705. 119. 410. 3. 132. 528. 6,336. 3,392. 2,944. 2,149. 5. 154. 616. 7,392. 3,386. 4,006. 1,450. 4. 135. 540. 6,480. 2,963. 3,517. 406,352. 1. 21. 84. 1,008. 554. 454. 23,040. 12,000. 11,040. 410,960. 政 480 治 1,920大. 立. Onpremise markets. 學. Total bottle consumption Offmonthly yearly premise markets. Frequency of drink. weekly. 599. 2. 111. 446. 5,346. 3. 290. 1,158. 13,900. 5. 368. 1,470. 7,020. 6,880. 17,642. 8,910. 8,732. 12,296. 6,210. 6,086. y. n. al. 1,450. 4. 406,352. 1. 410,960. 2,646. Ch. sit. io. 2,149. Onpremise markets. 2,700. er. 410. ‧. Numbers of Target Customers. Nat. Korean Immigrants Korean Students Korean Employees Taiwanese employed at Korean companies Taiwanese experienced original flavor Total. ‧ 國. Table 13: Third Year of Unit Sales Forecast by Customers. i Un. i e 256 n g c h1,025. v. 89. 356. 4,277. 2,160. 2,117. 1,114. 4,455. 53,460. 27,000. 26,460. 33.
(42) Table 14: Yearly Sales Forecast by markets Sales Year 1. Year 3. Offpremise markets. Onpremise markets. Offpremise markets. On-premise markets. Offpremise markets. On-premise markets. 90,000. 71,760. 511,500. 30,940. 810,000. 687,960. 234,000. 186,420. 1,017,600. 765,440. 2,106,000. 1,788,696. 297,000. 236,860. 1,015,800. 1,041,560. 2,673,000. 2,270,268. 207,000. 165,100. 888,900. 914,420. 1,863,000. 1,582,308. 72,000. 57,460. 648,000. 550,368. 900,000. 717,600. 8,100,000. 6,879,600. 立. 政166,200治 118,040 大 3,600,000. 2,870,400. 學. ‧ 國. Table 15: Delivery Cost. n. Ch. engchi. 34. y. sit. io. al. Year 2 $0.75 $10,500.00 $300.00 $20.00 $19.00 $101.00 $4.20 $50.00 $840.00 $525.00 $33.00 $15.00 $600.00 $13,008 $100.00 $40.00 $13,148 150 60 $13,217.95 $381,008.86 $27.21. ‧. Nat. FOB Price/Unit FOB Price (20ft/FCL) Ocean Freight Container Clearance Charge Documentary Charge Terminal Handling Charge Warehouse Fare Handling Charge TAX ADD Tax (Sales tax, VAT)) Clearance Fee Trucking charge TARIFF charge Sub Total Delivery fare Warehouse Fare Sub Total Delivery charge Warehouse charge Total in USD Total in TWD Total per unit in TWD. Year 1 $0.75 $10,500.00 $300.00 $20.00 $19.00 $101.00 $4.20 $50.00 $840.00 $525.00 $33.00 $15.00 $600.00 $13,008 $100.00 $40.00 $13,148 150.00 60 $13,217.95 $381,008.86 $27.21. er. Korean Immigrants Korean Students Korean Employees Taiwanese employed at Korean companies Taiwanese experienced original flavor Total. Year 2. i Un. v. Year 3 $0.75 $10,500.00 $300.00 $20.00 $19.00 $101.00 $4.20 $50.00 $840.00 $525.00 $33.00 $15.00 $600.00 $13,008 $100.00 $40.00 $13,148 150 60 $13,217.95 $381,008.86 $27.21.
(43) *One 20ft=14,000pcs. 5.3.. Marketing Expenses Budget. Marketing expenses on an ongoing basis are expected to total almost 1.98% of sales in the first year and decrease to about 0% of sales in subsequent years. The initial development costs for marketing are included in the Milestones chart and are not represented here. Most marketing expenses are expected to decrease annually against with sales except for referrals that will increase more quickly. The graph and table below illustrate more clearly this situation.. 政 治 大. 立. Others. ‧ 國. 學 Year 1. sit. Year 2. n. al. er. io Website and Online Marketing. ‧. Nat. Print and Poster Advertising. Year 3. y. Referrals. Ch. engchi. i Un. v. $0 $20,000$40,000$60,000$80,000$100,000 $120,000 $140,000. Graph 7: Annual Expense Budget Table 16: Marketing Expense Budget Year 1. Year 2. Year 3. Website and Online Marketing. $18,500. $3,000. $4,000. Print and Poster Advertising. $32,500. $20,000. $20,000. Referrals. $73,000. $90,000. $120,000. Others. $32,000. $0. $0. $156,000. $113,000. $144,000. 1.98%. 0%. 0%. Total Sales and Marketing Expenses Percent of Sales. 35.
(44) 5.4.. Key Marketing Metrics. Some key marketing metrics are expected to be indicators of the success of Bon Ju (本酒)‟s marketing strategy overall. Here we identify them: . Leads: Defined as individuals who step into stores to consider a purchase. . Leads Converted: Estimated at 50% going forward based on the fact that many will not be qualified when they enter the store. . Average Transactions Per Customer: Expected to rise significantly as customers return for more and more drinking per month. . Average $ Per Customer: Will likewise rise along with average transactions. . Referrals: Includes customer and business referrals. . PR Mentions: Online or print mentions of the business that are not paid advertising.. 立. 政 治 大. Year 2. Year 3. $1,617,600. $6,470,400. $14,979,600. 1,000. 1,500. y. 2,250. 50.00%. sit. io. Year 1. 50.00%. 50.00%. 0.2. 1.4. 3. $420. $900. 72. 154. 560. 800. Avg. Transactions/Customer Referrals PR Mentions. al. n. Avg. $/Customer. Ch. $60. e n g c h35i 250. 36. er. Leads Converted. Nat. Leads. Table 17: Key Marketing Metrics. ‧. Revenue. 學. level. ‧ 國. Expected to be high upon opening, then drop off and rise again until achieving a steady. i Un. v.
(45) 6. Management Summary Bon Ju (本酒)‟s officers include our President, Mr. Yongjae Kim, our head of exports Ms. Minhye Kim, and our general assistance, Ms. Okgeun Ki.. 6.1.. Personnel Plan. Bon Ju (本酒) consists of a strong management team which has capabilities in all aspects of trade relations, logistics, contracting and sales, as detailed below. Mr. Yongjae Kim has a bachelor degree of politics and diplomacy in National Seoul University and achieved a master degree with politics in Sungkunguan University in Korea.. 治 政 大 and during his 2 years in years. He accepted a position as an advisor in Chang Ki Corporation 立 the position he demonstrated his flair to develop a new factory and training of employees in. He is a former director general in the Ministry of National Unification of the ROK for over 5. ‧ 國. 學. Pyongyang, North Korea.. ‧. Ms. Minhye Kim is a graduated with honors from National Chengchi University in Taiwan with an MBA degree. She has also a prior degree from Seoul Women‟s University in. Nat. sit. y. Business Administration, graduating in 2005. She worked for the overseas department in. io. er. Pacific Korea Corporation for 2 years.. al. n. iv n C South Korea and it is pursuing graduate Institute of Development Studies at h estudies n g cinhthei U. Ms. Okgeun Ki achieved a bachelor degree of Chinese in Dongduk Women‟s University in. National Chengchi University in Taiwan.. Table 18: Personnel-General Year 1. Year 2. Year 3. Mr. Yongjae Kim - President NTD600,000 NTD600,000 NTD600,000 Ms. Minhye Kim. NTD600,000 NTD600,000 NTD600,000. Ms. Okgeun Kim. NTD600,000 NTD600,000 NTD600,000. Other. NTD 0. NTD 0. NTD 0. Total People. $3.00. $3.00. $3.00. Total Payroll. $1,800,000. $1,800,000. $1,800,000. 37.
(46) 7. Financial Plan 7.1.. General Assumptions. This section offers a financial overview of Bon Ju (本酒) as it relates to the marketing activities. Bon Ju ( 本 酒 ) will address Break-even Analysis, Sales Forecasts, Expense Forecasts, and how they all link to the Marketing Strategy. We assume that approximately 50% of sales on credit and average interest rates of 10%. These are actually considered to be conservative in case our predictions are erroneous. Moreover, since Bon Ju (本酒) is an import broker, the firm has no variable costs associated with it. The following table details our general assumptions for the financial plan in particular. 政 治 大. within the first three years of operation.. 立. Year 1 1. Year 2. Year 3. 2. 3. 10.00%. 10.00%. Long-term Interest Rate. 10.00%. 10.00%. 10.00%. Tax Rate. 50.00%. 50.00%. 50.00%. 0. 0. 0. n. y. sit er. io. a. Break-even Analysis l. ‧. 10.00%. Nat. Current Interest Rate. Other. 7.2.. 學. Plan Month. ‧ 國. Table 19: General Assumptions for Financial Plan. Ch. engchi. i Un. v. The Break-even Analysis indicates that $537,300 in revenue is needed to match total planned expenses.. 38.
(47) $600,000 $500,000 $400,000 $300,000 $200,000 $100,000 $0 -$100,000 -$200,000 -$300,000 -$400,000 -$500,000. Graph 8: Break-even Analysis Monthly Revenue Break-even $537,300 Assumptions: Average Percent Variable Cost 26.6% Estimated Monthly Fixed Cost $394,000. 政 治 大. 立. ‧ 國. 學. Projected Profit and Loss. ‧. io. sit. y. Nat. $10,000,000 $9,000,000 $8,000,000 $7,000,000 $6,000,000 $5,000,000 $4,000,000 $3,000,000 $2,000,000 $1,000,000 $0. n. al. er. 7.3.. Ch. Year 1. engchi. Year 2. i Un. v. Year 3. Graph 9: Gross Margin Yearly. 39.
(48) $10,000,000 $9,000,000 $8,000,000 $7,000,000 $6,000,000 $5,000,000 $4,000,000 $3,000,000 $2,000,000 $1,000,000 $0 Year 1. Year 2. Year 3. 治 政 Table 20: Pro Forma Profit and 大Loss Year 1 Year 2 立 $1,617,600 $6,470,400 Graph 10: Profit Yearly. ‧ 國. $2,198,305 $0 $2,198,305. ‧. Gross Margin Gross Margin %. $549,576 $0 $549,576. 學. Sales Direct Cost of Sales Other Costs of Sales Total Cost of Sales. $1,068,024 66.03%. $4,272,095 66.03%. Year 3 $14,979,600 $5,220,841 $0 $5,220,841. Nat. $180,000 $156,000 $10,000 $48,000 $10,000 $10,000 $30,000 $30,000 $35,000. n. al. Ch. engchi. er. io. Expenses Payroll Sales and Marketing and Other Expenses Depreciation Rent Utilities Insurance Payroll Taxes Travel Other. sit. y. $9,758,759 65.15%. i Un. v. $180,000 $113,000 $10,000 $48,000 $15,000 $10,000 $30,000 $30,000 $35,000. $180,000 $144,000 $10,000 $48,000 $32,000 $10,000 $30,000 $30,000 $35,000. Total Operating Expenses. $509,000. $471,000. $519,000. Profit Before Interest and Taxes EBITDA Interest Expense Taxes Incurred. $559,024 $569,024 $12,000 $24,000. $3,801,095 $3,811,095 $12,000 $24,000. $9,239,759 $9,249,759 $12,000 $24,000. Net Profit Net Profit/Sales. $523,024 32.33%. $3,765,095 58.19%. $9,203,759 61.44%. 40.
數據
+7

相關文件
佳作 台北市 黃馨僾 暖化的怒火 臺北美國學校 Ramses Youssif 佳作 台北市 連敏媗 都是酒後開車的後果 三玉國民小學 李文秀 佳作
勞動部勞動力發展署桃竹苗分署-幼 獅職業訓練場(前行政院勞工委員會 職業訓練局青年職業訓練中心)、臺 北市立南港高級工業職業學校 39 資訊與網路技術 1 林家諄
According to relative theory of pedestrian space planning and traditional streets development, the design and plan of traditional downtown area in Tainan City
An Analysis of the January Effect of the United State, Taiwan and South Korean Stock Market, Asia Pacific Journal of Management, 9,
試驗計劃」 教育局資訊科技教育組 香港大學
means the Proposed School Development Plan (including its amendments and supplements, if any) as approved by the Government, a copy of which is at Schedule III
The presentation or rebranding by a company of an established product in a new form, a new package or under a new label into a market not previously explored by that company..
知名的台南花園夜市,歷史雖不如其他台灣 夜市悠久,但在短時間內卻發展成近400個
