Photolithography Control in Wafer Fabrication
Based on Process Capability Indices With Multiple
Characteristics
W. L. Pearn, H. Y. Kang, A. H.-I. Lee*, and M. Y. Liao
Abstract—Photolithography, typically taking about one- third of the total wafer manufacturing costs, is one of the most complex operations and is the most critical process in semiconductor man-ufacturing. Three most important parameters that determine the final performance of devices are critical dimension (CD), alignment accuracy and photoresist (PR) thickness. Process yield, a common criterion used in the manufacturing industry for measuring process performance, can be applied to examine the photolithography process. In this paper, we solve the photolithography production control problem based on the yield index . The critical values required for the hypothesis testing, using the standard simulation technique, for various commonly used performance requirements, are obtained. Extensive simulation results are provided and ana-lyzed. The investigation is useful to the practitioners for making reliable decisions in either testing process performance or exam-ining quality of an engineering lot in photolithography.
Index Terms—Alignment accuracy, critical dimension, critical value, photolithography, photoresist thickness, process yield.
I. INTRODUCTION
T
HE MANUFACTURING of integrated circuits (ICs) with smaller devices and feature sizes on wafers of larger di-ameters has been a trend in the semiconductor industry in order to achieve a smaller die size, lower electric power consump-tion, more rapid operating speed and reduced manufacturing cost. The function of photolithography, which has the highest impact on the development of semiconductor manufacturing, is to project circuit patterns onto a silicon wafer with high fidelity and repeatability. As wafer fabrication technology upgrades to a higher precision level, the width of IC diagram copied from pho-tolithography activity becomes smaller, and the final chip prod-ucts possess a faster processing capability and a lower electricity requirement. Photolithography is considered as the bottleneck in semiconductor manufacturing because of the following rea-sons: photolithography has the most important equipment; a Manuscript received August 02, 2006; revised February 02, 2009; accepted February 13, 2009. First published July 07, 2009; current version published Au-gust 05, 2009. Asterisk indicates corresponding author.W. L. Pearn is with the Department of Industrial Engineering and Man-agement, National Chiao Tung University, Hsinchu 300, Taiwan (e-mail: [email protected]).
H. Y. Kang is with the Department of Industrial Engineering and Manage-ment, National Chin-Yi University of Technology, Taiping City 411, Taichung County, Taiwan (e-mail: [email protected]).
*A. H.-I. Lee is with the Department of Industrial Management, Chung Hua University, Hsinchu 300, Taiwan (e-mail: [email protected]).
M. Y. Liao is with the Department of Finance, Yuanpei University, Hsinchu 300, Taiwan (e-mail: [email protected]).
Digital Object Identifier 10.1109/TSM.2009.2024851
wafer may go through the process up to fifty times for producing a complex IC; and the process results are crucial to the final functions of a product. As a result, the process control of pho-tolithography workstation is essential.
In photolithography, the pattern printed on a wafer is not an exact replica of the mask pattern in practice, and the variations re-sult largely from three reasons [1]. First, the fundamental diffrac-tion of the projecdiffrac-tion optics is limited. Second, the mask pattern itself is not exactly the same as the design due to the limitations of the mask fabrication process. Third, there are random and sys-tematic variations of the multitude of photolithographic process parameters, such as focus and exposure. The process materials, the equipment and the processing environment also face time-varying fluctuations that cannot be easily measured, and such variations cause disturbances on the photolithography process [2]. Therefore, it is important to implement manufacturing con-trol, which strives to maintain output within prescribed lower and upper specification limits [3]. Two of the most troublesome con-trol tasks are the measurement of the alignment between layers and the measurement of the dimensions of the smallest features [4]. The alignment determines the success of transferring the IC design pattern on the mask or reticle to the PR on the wafer sur-face [5]. The latter are called “critical-dimensions” (CDs) and a CD is defined as the linewidth of the PR line printed on a wafer and reflects whether the exposure and development are proper to produce geometries of the correct size [2]. In additional to the above two parameters, PR thickness is also very important since it determines the resolution and the resistance of the PR film, and a specific thickness, which is consistent from wafer to wafer and uniform across each wafer, is required. As a result, alignment accuracy (AA), CD and PR thickness (PT) are the three param-eters that have the greatest impact on device performance and that should be controlled properly.
Process yield, the percentage of processed product unit passing the inspection, is a common and basic criterion used in the man-ufacturing industry as a numerical measure on the performance. For a product to pass the inspection, its product characteristic must fall within the manufacturing tolerance, and all passed product units are equally accepted by the producer. On the other hand, for a product that is rejected due to nonconformities, it may be scrapped, or additional cost is required to repair the product. To examine the quality of wafers, the three key characteristics, AA, CD, and PR, should be examined. An index, , which pro-vides an exact measure of the overall process yield is performed to assess process capability for the photolithography process. The rest of the paper is organized as follows. Section II presents the 0894-6507/$26.00 © 2009 IEEE
approach for photolithography production yield measurement. Section III calculates the photolithography production yield. Some conclusion remarks are made in the last section.
II. PCI APPROACH FORPHOTOLITHOGRAPHYPRODUCTION YIELDCONTROL
In this study, we investigate the photolithography process of a semiconductor fab in the Science-Based Industrial Park in Taiwan. The objective is to examine the process performance and present critical values for determining whether the process meets the capability requirement. In a wafer fab, each lot con-tains 25 pieces of wafers, and each piece of wafer has 400 chips. As a result, one lot has 10 000 chips. The number of chips, se-lected for CD, AA, and PT measurements, in a lot needs to be es-timated. The manufacturing specifications for the three param-eters are as follows:
and and and
where is the upper specification limit, and is the lower specification limit.
Based on historical data, the process characteristics we inves-tigated are justified to be in statistically control and runs in stable condition, which follows rather close to a normal distribution. In addition, there is no correlation among the three parameters. AA is totally independent with CD and PT since the AA mea-surement is to make sure that the reticles for different layers in photolithography process are aligned correctly and that the physical construction of each chip is consistent with the original design in consequence. As for the relation between CD and PT, it is determined by the characteristics of the chosen PR. For the chosen PR, swing curve, which shows the manufacturing range for the CD and PT, will be studied first for the manufacturing specifications. Within the range, CD and PT can be chosen inde-pendently based on the need of design and process without any interference. Therefore, within the given manufacturing speci-fications, there is no correlation for these two parameters.
Process capability indices (PCIs) are very important for mea-suring how well the process meets specifications. Based on the expression of process yield, Boyles [6] considered a yield mea-surement index ,
(1) where is the process mean, is the process standard deviation, and is the cumulative distribution function of the standard normal distribution N(0,1).
The index establishes the relationship between the man-ufacturing specifications and the actual process performance, and provides an exact measure of the process yield. The natural estimator can be applied to estimate the yield measure-ment index from a stable process [7]:
(2)
TABLE I
THECORRESPONDINGPROCESSYIELD ANDNCPPMFORVARIOUS
VALUESS
TABLE II
S VALUE FORTHREECHARACTERISTICS
where is the sample mean and the conventional
estimator of , and is the
sample standard deviation and the conventional estimator of . However, the exact distribution of is analytically in-tractable, and the process performance cannot be tested. The estimator can be expressed approximately by Taylor expansion as [8]:
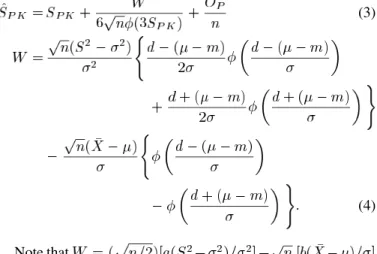
(3)
(4)
Note that
for ,
for , and is the probability density function of the standard normal distribution N(0,1). In addition, the re-maining terms represent the error of the expansion having a leading term of order in probability and can be estimated through simulation. By taking the first order of the Taylor expan-sion, can be approximated by a mathematical approach as [7]. Moreover, Pearn and Chuang [7] obtained the critical values required for the statistical testing of process capability by standard simulation technique.
Capability measure for processes with single characteristic has been investigated extensively (see [9]–[11] for more details). However, capability measure for processes with multiple char-acteristics is comparatively neglected. In evaluating the overall process capability for processes with multiple characteristics, Chen et al. [12] proposed a new index, , which is a gen-eralization of . According to the definition of in (1), for process with , we can obtain the process yield(%)
TABLE III
DESIGNS FORMONTECARLOEXPERIMENTSWITHv = 3ANDVARIOUSS
. Obviously, there is a one-to-one relationship between and the process yield. Considering a -charac-teristic process, , , is the yield (percentage of conformities) of the characteristic, and the corresponding
value is , . The relationship between
and can be represented as . To
evaluate the overall process yield , Chen et al. [12] proposed
the following formula, , for
. An index for measuring the overall process
ca-pability is ,
which can be derived by . The index
provides an exact measure on the overall process yield. Table I displays various commonly used capability requirement and the corresponding overall process yield associated with non-conformities parts per million (NCPPM).
Statistical testing is used to determine if a process meets the capability requirement. The null hypothesis is
(process is not capable) and the alternative hypothesis is (process is capable), where is the required process capability. If the point estimate of process capability exceeds the critical value , the null hypothesis is rejected. Suppose that the risk of rejecting a null hypothesis is (the chance of wrongly concluding that an incapable process is capable), the critical value can be obtained by
(5) Since the exact distribution of is mathematically in-tractable, standard simulation method is performed to find the critical values for statistical testing.
1) Critical Value Determination: Monte Carlo experiments
are performed to find the distribution per-centiles of , 1.33, 1.50, and 2.00 for processes with characteristics using statistical software, Maple. Note that , , must be larger than in order
TABLE IV
SAMPLESIZESREQUIRED FORc WITHIN THEDESIGNATEDDIFFERENCES, .01(0.01)0.10
to keep value be a finite real number; otherwise, an in-finite number is resulted. For a process with characteristics,
there are
combi-nations in the simulation list, where represents the size of . In this case, there are a total of various combinations in the simulation list. The
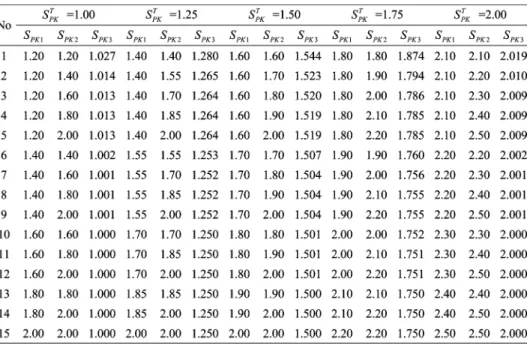
combinations we select are , ,
which means that we examine from 1.60, and by an in-crease of 0.10 each time, to 2.00. In addition, is a value corresponding to , and . Table II lists various index in the domains of , for three char-acteristics, and Table III lists the designs for Monte Carlo ex-periments with and various . After determining the combinations for simulation, we select the process parameters (process mean and process standard deviation ), which cor-respond to , , to generate samples of Monte Carlo experiments. Random samples from normal populations
TABLE V
SIMULATEDc FORVARIOUSS ,n = 10(10)400AND = 0.05, 0.025, 0.01
with various parameters are generated to evaluate the estimated value of . The sample sizes are 10(10)400. Each experi-ment consists of 10 000 replications. After sorting the 10 000 estimated values of from the smallest to the largest of each combination, and by selecting the (100 )th number, we can ob-tain the distribution percentile of with various combi-nations. Then, the values and the distribution percentile of for various are obtained.
We note that under different fixed performance , the value is different, and the difference between the max-imum and the minmax-imum values decreases as sample size increases. Table IV lists the required sample size for various
with . Note that when
the sample size exceeds 210, the difference becomes negli-gibly small (no greater than 0.01). Consequently, the values may be considered as a constant, which is independent of the values. Since values are different under various com-binations of fixed and , for practical purpose, we take the maximal value among the combinations for statis-tical testing, and this can ensure our decision makings being re-liable. Table V presents the critical values for common used
capability requirement with sample size
and 0.01, 0.025, 0.05.
2) Extension to Correlated Data: For processes with
corre-lated characteristics, Pearn et al. [13] applied the principal com-ponent analysis (PCA) method to transform related variables into a set of uncorrelated linear functions of the original mea-surements. The approach is described briefly here.
Assume that is a sample data matrix for process with characteristics, where is the sample mean vector of observations and is a symmetric matrix representing the covariance between observations. and
represent the lower and upper specification limits, and
represents the target values of the quality characteristics. In addition, the spectral decomposition can be used to obtain
, where is a diagonal matrix. The diagonal elements of , , are the eigenvalues of , and the columns of , , are the eigenvectors of . Consequently, the principal component, , is expressed as , , where is vectors of the original variables. The engineering specifications and target values of are
TABLE VI
SAMPLEDATA OFCD, AAANDPT
TABLE VII
EMPIRICALSIZESFORS = 1:00 WITHSOMENON-NORMALPROCESS
DISTRIBUTIONS
TABLE VIII
EMPIRICALSIZESFORS = 1:50 WITHSOMENON-NORMALPROCESS
DISTRIBUTIONS
Similarly, the relevant sample estimators, and of ,
can be defined as and .
Consequently, if the characteristics are correlated, we can use the above approach to transform the correlated variables and into new variables and first, and our proposed approach can proceed then.
III. PRODUCTIONYIELDCALCULATION
In this study, 210 sample observations of the three parame-ters, CD, AA and PT, are collected from the photolithography process. By calculating sample mean, standard deviation and the estimates for (see Table VI), we can estimate that the pro-duction yield of the photolithography process is .
With risk , we could use Table V to obtain for capability requirement . Since is greater than the critical value , we conclude that the process meets the re-quirement, and the process yield is no less than 99.99932047% (equivalently, with a nonconformities of 6.8 PPM).
To show the robustness of our approach for non-normal pro-cesses, we set nominal size and evaluate the empirical size (the percentage that we reject the null hypothesis by our ap-proach while the null hypothesis is true) by standard simulation with 10 000 replications. Tables VII and VIII show the results for process distributions with N(0,1), t(25), Gamma(22,1/6), and Beta(4,9) with various and and 1.50. We can see that the empirical sizes are close to the nominal size; thus, we conclude that our approach is also adoptable for these process distributions. However, for processes with too skewed distribution, our approach still may not be adoptable.
IV. CONCLUSION
A good control of CD, alignment accuracy and PR thickness is critical for maintaining a high level of yield in
photolithog-raphy. In this paper, we consider the yield measurement index to establish the relationship between the manufacturing specifications and the actual process performance, and provide an exact measure on process yield. A photolithography process in a semiconductor fab is investigated, and the testing process performance of CD, alignment accuracy and PR thickness mea-surement is considered based on the yield index . We ob-tain the critical values required for the hypothesis testing, using the standard simulation technique for various commonly used performance requirements. Extensive simulation results are pro-vided and analyzed. Statistical testing can be performed to ex-amine whether the process meets the capability requirement. The investigation is useful to the practitioners for making re-liable decisions in testing the quality of an engineering lot in the photolithography process.
REFERENCES
[1] S. Postnikov, S. Hector, C. G. R. Peters, and V. Ivin, “Critical dimen-sion control in optical lithography,” Microelectronic Eng., vol. 69, no. 2, pp. 452–458, Sep. 2003.
[2] C. E. Chemali, J. Freudenberg, M. Hankinson, and J. J. Bendik, “Run-to-run critical dimension and sidewall angle lithography control using the PROLITH simulator,” IEEE Trans. Semicond. Manuf., vol. 17, no. 3, pp. 388–401, Aug. 2004.
[3] H. Sasano, W. Liu, D. S. L. Mui, K. Yoo, and J. Yamartino, “Ad-vanced gate process critical dimension control in semiconductor man-ufacturing,” in Proc. IEEE Int. Symp. Semiconductor Manufacturing
Conf., 2003, pp. 382–385.
[4] H. K. Nishihara and P. A. Crossley, “Measuring photolithographic overlay accuracy and critical dimensions by correlating binarized laplacian of gaussian convolutions,” IEEE Trans. Pattern Anal.
Ma-chine Intell., vol. 10, no. 1, pp. 17–30, Jan. 1988.
[5] H. Xiao, Introduction to Semiconductor Manufacturing Technology. Upper Saddle River, NJ: Prentice-Hall, 2001.
[6] R. A. Boyles, “Process capability with asymmetric tolerances,”
Commun. Stat. Simul. C., vol. 23, no. 3, pp. 615–643, 1994.
[7] W. L. Pearn and C. C. Chuang, “Accuracy analysis of the estimated process yield based onS ,” Qual. Reliab. Eng. Int., vol. 20, no. 4, pp. 305–316, Jun. 2004.
[8] J. C. Lee, H. N. Hung, W. L. Pearn, and T. L. Kueng, “On the distri-bution of the estimated process yield indexS ,” Qual. Reliab. Eng.
Int., vol. 18, no. 2, pp. 111–116, Mar. 2002.
[9] S. M. Chen and Y. S. Hsu, “Uniformly most powerful test for process capability indexC ,” Qual. Tech. Quant. Manage., vol. 1, no. 2, pp. 257–269, Sep. 2004.
[10] S. W. Cheng, B. Leung, and F. A. Spiring, “Assessing process capa-bility: a case study,” Qual. Tech. Quant. Manage., vol. 3, no. 2, pp. 191–206, Jun. 2006.
[11] K. Vännman, “Safety regions in process capability plots,” Qual. Tech.
Quant. Manage., vol. 3, no. 2, pp. 227–246, Jun. 2006.
[12] K. S. Chen, W. L. Pearn, and P. C. Lin, “Capability measures for pro-cesses with multiple characteristics,” Qual. Reliab. Eng. Int., vol. 19, no. 2, pp. 101–110, 2003.
[13] W. L. Pearn, F. K. Wang, and C. H. Yen, “Measuring production yield for processes with multiple quality characteristics,” Int. J. Prod. Res., vol. 44, no. 21, pp. 4649–4661, 2006.
W. L. Pearn received the Ph.D. degree in operations research from the University of Maryland, College Park.
He is a Professor of operations research and quality assurance at National Chiao Tung Univer-sity, Hsinchu, Taiwan. He worked at AT&T Bell Laboratories as a Quality Research Staff Member before joining National Chiao Tung University. His research interests include process capability, network optimization, and production management. His pub-lications appeared in Journal of the Royal Statistical
Society, Series C, Journal of Quality Technology, Journal of Applied Statistics, Statistics and Probability Letters, Quality and Quantity, Metrika, Statistics, Journal of the Operational Research Society, Operations Research Letters, Omega, Networks, International Journal of Productions Research, and others.
H. Y. Kang received M.S. and Ph.D. degrees from the department of industrial engineering and man-agement, National Chiao Tung University, Hsinchu, Taiwan, in 1997 and 2004.
He is an Associate Professor in the Department of Industrial Engineering and Management, National Chin-Yi University of Technology, Taiping City, Taiwan. His research interests include production management, performance evaluation, and process capability.
A. H.-I. Lee received the M.B.A. degree from the University of British Columbia, Canada, in 1993 and Ph.D. degree in industrial engineering and man-agement from the National Chiao Tung University, Hsinchu, Taiwan, in 2004.
She is a Professor in the Department of Industrial Management at Chung Hua University, Hsinchu, Taiwan. Her research interests include performance evaluation, scheduling, and production management.
M. Y. Liao received the M.S. degree from the insti-tute of statistics at Cheng Kung University, Taiwan, and Ph.D. degree in industrial engineering and man-agement from the National Chiao Tung University, Hsinchu, Taiwan.
He is an Assistant Professor in the Department of Finance at Yuanpei University, Hsinchu, Taiwan. His research interests include statistical process control, production management, and econometrics.