Reaching into the Grassroots: A Comparative Study of Local Public Opinions in Taiwan
Eric Chen-hua Yu
Center on Democracy Development, and the Rule of Law, Stanford University Encina Hall C150
Stanford, CA 94305, USA [email protected]
Chia-hung Tsai
Election Study Center, National Cheng-chi University 64 Sec. 2, Zhi-nan Rd.
Taipei, Taiwan [email protected]
Yung-ming Hsu
Research Center for Humanities and Social Sciences, Academia Sinica 128 Sec. 2, Academia Road
Taipei, Taiwan [email protected]
Prepared for the Conference Group on Taiwan Studies at the 2006 Annual Meeting of the American Political Science Association, Philadelphia, August 31 to September 3, 2006.
Abstract
This research explores Taiwan’s political geography from a viewpoint of policy preferences of the general public. By using national survey data and a simulation procedure that combines Bayesian multilevel estimations with post-stratification, we first generate public opinion measures toward an array of policy issues at the local level. We then compare issue opinion measures across counties/cities and among regions and find that there exists no significant geographical cleavage in our specific opinion measures. The regional patterns found in previous research on partisanship and vote shares do not emerge in this study. Additionally, at the local level, while ethnicity is strongly related to most of our issue opinion measures, partisanship does not seem to play a significant role in shaping policy preferences except that for economic
Introduction
Over the past few years, Taiwan has gradually divided into two major geographical divisions along with the intensified political cleavage between the pan-blue and pan-green coalitions. The outcomes of the 2000 and 2004 presidential elections indicated that the pan-blue coalition had a solid majority in almost every northern county while the pan-green coalition enjoyed overwhelming support in the south. It is also believed that southern counties were crucial for Chen Shui-bian’s victories in both presidential elections.
The recent “North-versus-South” phenomenon in Taiwan has gained much scholarly attention. In their empirical analysis on regional disparities in voting behavior, Lee and Hsu (2001) showed that Taiwan’s party politics has regional differences and southern voters indeed have shown significant support for the Democratic Progressive Party (DPP). Additionally, they found that southern voters, regardless of their partisanships, have more stable party identification, thus showing higher degree of loyalty toward their parties.
Yu’s (2004) study on voters’ party identification after 2000 also confirmed the regional differences in partisanship. However, regarding the strength of partisanship, Yu found that residents in the south have weaker partisanship than do people living in northern Taiwan, which contradicts to Lee and Hsu’s (2001)’s finding. According to Yu’s analysis, the upper/middle white-collar people tend to have strong partisanship. Incidentally, most of them live in the Taipei metropolitan area.
Although both studies identified the importance of regional factors in shaping Taiwanese partisanship, neither of them explained what causes the emergence of regional factors. By analyzing the relationship between vote shares and proportions of various occupations at the county level, Keng and Chen (2003) tried to solve the puzzle and found that, “[R]egional political blocs take shape following regionalized economic interest (p.24).” Specifically, they
argued that the north and the south have different industrial structures respectively. People in northern Taiwan mainly work in high-tech and service industries while those in southern Taiwan tend to work in heavy industries. This difference results in diverged policy preferences toward economic relations with China, and in turn divides Taiwan into two regional political blocs: the northern voters favor a closed economic tie with China that proposed by the pan-blue camp while the southern voters are in favor of decreasing economic reliance on China that proposed by the pan-green camp.
Because research on political geography in Taiwan began from the observed patterns of electorate distributions, it is not surprising that previous relevant studies almost always focused on analyzing geographical differences in partisanship or vote choices, and the discussion has never been extended beyond electoral politics. However, even though scholars successfully detected geographical patterns of Taiwanese partisanship, we still do not know, for instance, if these patterns of partisanship correspond with, or result from, any geographical difference in public opinion concerning specific issues. In short, the relationship between aggregate
partisanship and popular preferences toward policies, if any, has never been explored in Taiwan. This research aims to fill the gap and intends to study political geography beyond electoral politics. Specifically, we focus on issue opinions at the local level instead of partisanship or vote shares at the regional level. Because Taiwan has no regional governments, studying public opinion at the regional level does not provide much policy implication.
Taiwan’s local governments refer to 23 sub-national geographic units, including sixteen counties, five county cities, and two major cities. These county/city governments enjoy certain levels of autonomy and play a significant role in making public policies. However, we do not know much about their public opinion toward policy simply because the survey data at the county/city level are normally unavailable. Thus, the first step of this study is to generate public
opinion measures toward various policy dimensions at the local level. Then we compare issue opinion measures across counties/cities and among regions to see if there is any geographical pattern concerning specific issue opinion. Last, we examine if partisanship plays a significant role in shaping issue opinion at the local level.
Data
To assess opinions toward public policies at the local level, a set of questions from the 2003 Taiwan Election and Democratization Survey (TEDS 2003) is chosen. The reasons to use the TEDS 2003 dataset are twofold: first, unlike other TEDS datasets that are not intended to
produce sub-national samples, TEDS 2003 includes samples in all the 23 counties/cities. Second, among those large-scale national surveys in Taiwan over the past five years, TEDS 2003 is the only survey that has a number of social cleavage questions with direct policy implications.
Specifically, we use eight questions designed to explore social cleavages over various policy dimensions. Each of these eight questions presented two sides of arguments or policy implications to the respondents and forced them to take either side. The policy issues we use in this analysis and their coding schemes list as follows:1
I. [ENVIRONMENT] Importance of Environmental Protection: “Environmental protection” (yi = ) versus “Economic development.”(1 yi = ) 0
II. [INEQUALITY] Government’s Role in Reducing Gap between Rich and Poor: “Government should limit gap” (yi = ) versus “Government shouldn’t get involved.” 1 (yi =0)
III. [LABOR] Regulation on Foreign Labor: “Strict controls” (yi = ) versus “Relax 1
1
Please refer to Appendix 1 for the wordings, sample sizes, and average responses for all the questions used in this analysis.
controls.” (yi =0)
IV. [CULTURE] Adaptation of Foreign Culture: “Losing our unique culture.” ( ) versus “Nothing wrong with large-scale adaptation.” (
1 i y = 0 i y = )
V. [UNEMPLOYMENT] Government’s Responsibility for Unemployment: “Government’s responsibility” (yi =1) versus “Personal problem.” (yi = ) 0
VI. [WELFARE] Reason for Poor: “Society doesn’t provide opportunities” ( ) versus “Individuals don’t work hard enough.” (
1 i y = 0 i y = )
VII. [SECURITY] Protection of Taiwan’s Security: “Improve relations with China” (yi = ) 1 versus “Strengthen cooperation with US.” (yi = ) 0
VIII. [ECONOMY] Economic Relation with China: “Develop closer economic relations” (yi =1) versus “Reduce economic reliance.” (yi = ) 0
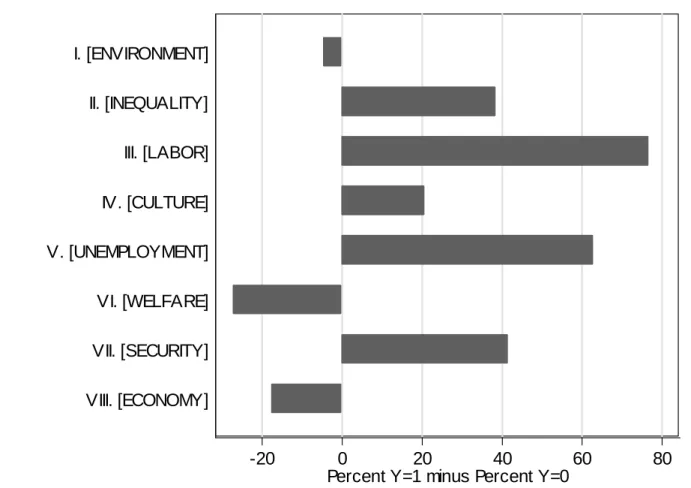
At the national level, the degrees of consensus vary across the eight policy dimensions. The bar chart in Figure 1 illustrates the variation, in which each bar indicates the difference between percent and for a specific issue dimension (i.e., using percent minus percent ). Thus, the longer the bar is, the stronger the public agreement would be. For instance, concerning the [LABOR] issue, most people profess fairly strong support for strict controls on foreign labor in order to preserve job opportunities for domestic labors (i.e., about 88%). The difference between the two attitudes, “strict controls” and “relax controls,” is more than 70 percentage points. In contrast, concerning the [ENVIRONMENT] issue, the Taiwanese general public is indeed split—namely, that 48% of those surveyed said that “environmental protection is more important than economic development,” as opposed to 52% agreed with the reverse argument. 1 i y = yi =0 yi =1 0 i y =
[Figure 1 about here]
controversial issue among the issues we examine in this study. Additionally, economic relations with China [i.e., ECONOMY] can also be regarded as a controversial issue—that is, the
difference between the two attitudes, “developing closer economic relations” and “reducing economic reliance,” is only about 16 percentage points.
Public opinion measures at the national level can not tell us if they vary at the local level. With hundreds of polls conducted at the national level each year, researchers studying public opinion of the nation as a whole usually have the ready availability of data. Nevertheless, due to far less polling done at the local level and to asking the same questions in all the counties/cities, those studying local opinions have suffered from the problem of data availability.
Method
In order to explore geographical differences in public opinion in Taiwan, the first step is to obtain opinion measures at the local level. However, the lack of comparable local surveys does not allow us to directly observe opinions toward various policy issues in the local level. The intuitive way to solve this problem is to obtain local public opinion measures via national surveys. Over the past decades, scholars have developed two methods to generate local opinion estimation by using available national survey data—namely, the aggregation method and the simulation method. Both methods tend to overcome the small sample size problem in the local level when we generate local opinion measures via national surveys.
The dominant approach for the last decade is based on the pioneering work of Erikson, Wright, and McIver’s (1993) study of opinion and policy in the American states. They pooled 122 CBS/New York Times surveys from 1976 through 1988 to develop state-level measures of partisanship and ideology as two proxies of general measures of state public opinion. Arguing that general state-level measures of opinion do not capture all facets of public opinion on specific
policy issues, Brace, Sims-Butler, Arceneaux, and Johnson (2002) pooled 22 General Social Surveys (GSS) over a 25-year period to produce state-level opinions on various issues, such as tolerance, racial integration, abortion, religiosity, homosexuality, feminism, capital punishment, welfare, and the environment. In short, Erikson et al. and Brace et al. have aggregated a
considerable number of national surveys over time and disaggregated the cumulative data into the local level to construct their measures. This approach, however, cannot be employed if national surveys do not ask fixed questions or do not have the same fielding (or sampling) techniques across local units and through time.2
The simulation approach to local opinion estimation was pioneered by Pool, Abelson, and Popkin’s (1965) study of presidential election campaigns in the early 1960s. Ronald Weber and his colleagues (Weber and Shaffer 1972; Weber, Hopkins, Mezey and Munger 1972) adapted the method and were the first to employ it to study the linkage between constituency opinion and policy outputs. Weber et al’s method contains three stages: first, they divided the population of each state into 192 “voter types” based on the intersection of six demographic variables. Second, they used survey data to predict the political orientation of these 192 voter types. Third, they aggregated these predicted preferences for each state, weighting each type by its actual population of the state’s population.
Most recently, Park, Gelman, and Bafumi (2004) adapted a variant of the simulation
2
Another major limitation of this approach comes from its assumption of opinion stability over time. In other words, this approach limits the possibility of examining the longitudinal variation of state-level opinion. Attempting to improve Erikson et al.’s general ideology index with this matter, Smith (1997) disaggregated the larger data set into yearly segments and corrected for the resulting sampling error to create annual measures of ideology in the states. Berry, Ringquist, Fording, and Hanson (1998) used state politician's ideology scores, election results, and partisan division to construct dynamic measures of citizen and government ideology at the state level. More recently, McIver et al. (2001) and Erikson et al. (2004) extend their previous analysis and develop dynamic measures of state-level ideology and partisanship over time.
approach, in which they treated geographic location as one additional dimension that can be used to define voter types. By augmenting state-level aggregation with demographic data and using Bayesian estimation methods, they obtained estimates of U.S. state-level opinion that are far more valid and reliable than those obtained by aggregation alone. Specifically, Park et al. (2004) use four demographic variables to define 64 voter types in each of the 51 “states” (including Washington D.C.) but adding state of residence creates 64×51=3264 types. Estimating each voter type individually seems to increase the data demands substantially. However, multilevel
Bayesian estimation reduces the data demands enormously—that is, estimates for units with few (or no) cases draw on information from other similar units. As they point out, this is much like post-survey weighting of polling data to conform with known demographic compositions of electorates, which is why they refer to their method as a form of post-stratification.
Park et al’s method has been applied to generate county-level estimates of vote choice in Taiwan. By using the pre-election national surveys of the 2004 Taiwan presidential election, Yu and Tsai (2006) also obtained valid and reliable local-level opinion estimates—that is, the average absolute error between the simulation estimates and the actual county-level election outcomes is less than 2 percentage points. Thus, we are somewhat confident to apply Part et al’s method to generate Taiwan’s local opinion measures in this study. Specifically, this simulation method includes three steps as follows:3
First, regarding each of the above eight questions, we assigned yi =1 and yi = for 0 respondents in favor of either side of the policy positions respectively, and NA for respondents who expressed neither or were missing.4 We excluded respondents who were coded as missing
3
Please refer to Appendix II for details. 4
When encountering missing data on a dependent variable in a regression model, WinBUGS will make multiple imputations. See Jackman (2000) for further details regarding this function of WinBUGS.
for any of the demographic predictors.
Second, we fit a logistic regression model as the data-level model for the dichotomous individual response y given three demographic variables (i.e., sex, age, or education) and 23 county/city indicators of residence. Thus, we can categorize all adult population in Taiwan into 1,150 voter types (i.e., 2×5×5×23).5
Third, in order to compute the predicted average response for each question in each county/city, we need to poststratify on all demographic variables along with the counties/cities. Thus, we need the joint population distribution of the demographic variables within each county/city. In this study we construct the joint population distribution data via the 2000 Taiwan Census data.
Issue Opinion Measures across 23 Counties/Cities
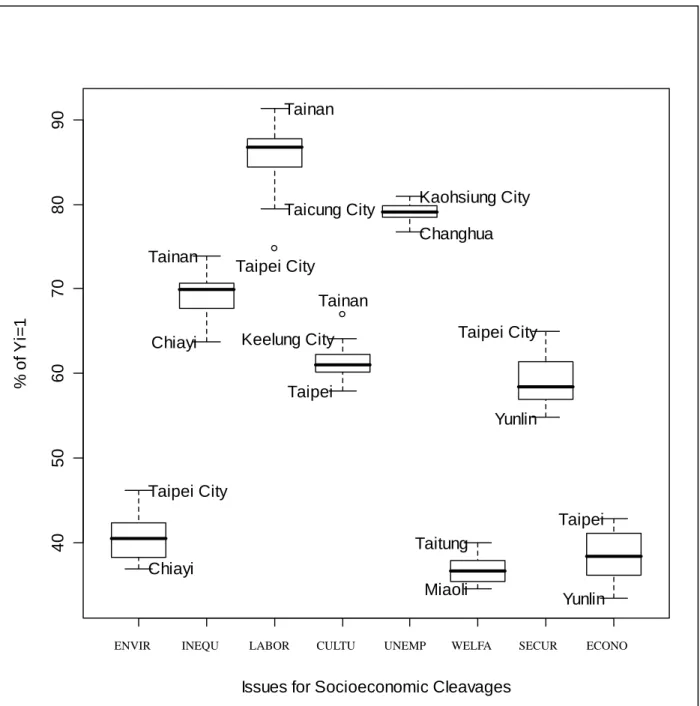
Figure 2 presents the distributions of estimated average responses concerning specific policy issues across the 23 counties/cities.
[Figure 2 about here]
In Figure 2, comparing the eight policy dimensions presented here, opinion measures toward the [UNEMPLOYMENT] issue tend to have the smallest variation across counties/cities. The range between the two extreme measures is only 5 percentage points (e.g., 82% at Kaohsiung city and 77% at Changhua). This result suggests that people in different counties/cities share a similar attitude toward the [UNEMPLOYMENT] issue, and most of them strongly agree that the government should take the responsibility for unemployment problems. In
5
It is believed that an individual’s ethnic background is an important indicator to predict his or her political attitude. However, we cannot include ethnicity in the data-level model because the census data does not have such variable for poststratification.
contrast, local-level opinion measures toward the [LABOR] issue appear to have the largest variation: supports for strict controls on the import of foreign labor range from 78% at Taichung city to 92% at Tainan county. But after all, even though opinion measures toward [LABOR] have the greatest range, this 14 percentage-point difference does not mean too much, given that all measures toward [LABOR] are well above 70% and “strict controls” on import of foreign labor seems to enjoy an overwhelming support all around Taiwan.
Although the variations of local level opinion measures differ from one policy dimension to another, these differences seem to be minor: the standard deviation of the [LABOR] opinion measure is only 2.7 percentage point greater than that of the [UNEMPLOYMENT] opinion measure (i.e., 3.9 percentage points minus 1.2 percentage points). Thus, these specific opinion measures do not vary too much across counties/cities. And we do not see any county (or cluster of counties) have extreme values all the time when we examine the distributions of opinion measures toward the eight policy issues.
The best way to test the validity of these simulated local-level opinion measures is to compare these measures with actual data from local-level surveys. However, no comparable county/city-level polls concerning these socioeconomic issues are available. Unlike Park et al. (2004)’s or Yu and Tsai (2006)’s studies on presidential vote shares, we cannot fully validate our estimates by comparing the estimates with the actual vote shares at the local (e.g., state or county/city) level.
Recall that the reason why this study employs a simulation approach to generate local-level public opinion measures is to overcome the small sample size problem that can happen if we directly compute county/city-level public opinions by using insufficient national data. Thus, it is important to examine whether there exists any difference between the opinion measures simulated by the modeling approach and those that were directly computed (or observed). To
answer this, I first disaggregated the national data at the local level to construct their observed public opinion measures for each of the eight survey questions; then I compared the observed opinions with the simulated measures county/city by county/city for all the questions. The average correlation coefficient between the observed county/city-level opinions and the simulated measures is 0.69. Please refer to Appendix III for all the correlation coefficients and plots between the two measures.
Policy Preferences, Partisanship, and Ethnicity
How can we explain the variance in the specific local-level issue opinion measures? Is there any relationship between specific policy preferences and partisanship at the county/city level?
[Table 1 about here]
Column (1) and (2) of Table 1 illustrate the relationship between each of the specific issue opinion measures and partisanship.6 The local-level partisanship is measured by percent Pan-blue camp minus percent Pan-green camp at each county/city. Presumably, the opinion measures may correlate with partisanship, as partisanship can be regarded as a general proxy of various policy preferences. However, it is not the case. Among the eight issue opinion measures studied here, only opinion toward [ECONOMY] is highly correlated with partisanship (r = .53, p<.01). Specifically, the strength of Pan-blue camp is associated with support for developing closer economic relations with China. The other weak (or no) correlations range from r = -.03 (opinion toward [INEQUALITY] and partisanship) to r = -.19 (opinion toward [CULTURE] and partisanship). In short, the specific public opinion measures presented here rarely correspond
6
The local-level partisanship and ethnicity measures are obtained by the 2002 cumulative dataset of Election Study Center (ESC) at National Chengchi University. ESC pooled all their survey data in 2002 (over 10,000 samples) and disaggregated them into 23 counties/cities to developed local-level measures in partisanship, national identity, ethnic identity, and attitude toward Taiwan’s future relationship with China.
with partisanship. And partisanship only explains variance in policy preferences toward economic relations with China. While this preliminary result somewhat verifies Keng and Chen (2003)’s finding that regional political blocs or partisanship are associated with economic interests with China, it also suggests that Taiwanese partisanship seems to be empirically irrelevant to most policy preferences at least at the local level.
Ethnicity has long been considered the major social cleavage in Taiwanese politics. For instance, scholars have reached a conclusion that an individual’s ethnic background (e.g., Minnan, Mainlander, or Hakka) is crucial to the formation of his or her national identity (i.e., Taiwanese vs. Chinese) (Wu 1993; Hsu and Chen 1998; Wang and Liu 2004; Chang and Wang 2005). Similarly, the issue of Taiwan’s future relationship with China (re-unification vs. independence) can be regarded as an extension of the ethnic cleavage (Lin, Chu, and Hinich 1996; Wu 1996; Chang and Wang 2005).
Column (3) and (4) of Table 1 illustrate the relationship between each of the specific local- level issue opinion measures and ethnicity. The local-level ethnicity is measured by percent Minnan population minus percent Mainlander population at each county/city. It appears that ethnicity is highly associated with opinion measures toward [ENVIRONMENT] (r = -.45, p<.05), [LABOR] (r = .41, p<.10), [CULTURE] (r = .47, p<.05), [SECURITY] (r = -.46, p<.05), and [ECONOMY] (r = -.76, p<.01) respectively. .That is, more Minnan population is associated with less support for environmental protection (or more support for economic development), more support for strict controls on import of foreign labor (or less support for relax controls), less support for improving relation with China (or more support for improving relation with US), and less support for developing closer economic relations with China (or more support for decreasing economic reliance on China). The other weak correlations range from r = -.11 (opinion toward [WELFARE] to r = -.29 (opinion toward [UNEMPLOYMENT]).
Ethnicity compares favorably with the explanatory power of partisanship. It explains variance in most of the specific opinion measures presented here. Notably, ethnicity is a significant predictor for both opinion measures concerning cross-strait relations (i.e., [SECURITY] and [ECONOMY])—that is, the more the Minnan population, the less support for developing better relations with China.
North versus South?
Is there any regional difference in issue opinion? Does the “North-South Divide” emerged in electoral politics also occur in policy preferences? To answer this question, we adapt the same simulation procedure and generate regional-level opinion measures toward the eight policy dimensions. Following Lee and Hsu’s (2001) classifications, we group the 23 counties/cities into six regions—namely, PePeKeIi (Taipei county and city, Ilan county, and Keelung city), TaoChuMiao (Taoyuan, Hsinchu, and Miaoli counties, and Hsinchu city), ChungChanTou (Taichung county and city, Changhwa county, and Nantou county), YunChiaNan (Yunlin county, Chiayi county and city, and Tainan county and city), KaoKaoPing (Kaohsiung county and city, and Pingtung county), and HuaTungPeng (Hualien, Taitung, and Penghu counties). While the North mainly refers to PePeKeIi and TaoChuMiao, the South normally includes YunChiaNan and KaoKaoPing.
The bar chart in Figure 3 shows regional disparities regarding the specific issue opinion measures. For each issue dimension, we use six bars indicating the percent for the respective regions.
1 i
y =
[Figure 3 about here]
In Figure 3, we do not observe significant regional differences in most of the issue opinion measures, which are accordance with the small variations of local-level measures shown in
Figure 2. It seems that the “North-versus-South” phenomenon is only relevant to opinion toward [ECONOMY]. Specifically, while TaoChuMiao (i.e., one of the two northern regions) has 47% of the population in favor of developing closer economic relations with China, YunChiaNan (i.e., one of the two southern regions) only has 35% supporting the same policy position. This is the only opinion difference that exceeds 10 percentage points between any of the northern and southern regions. In fact, it is HuatungPeng (i.e., two eastern counties plus the major separate island) that has the strongest support for developing closer economic relations with China (i.e., 50%). In contrast, it is ChungChanTou (i.e., the middle Taiwan) that has the least support for the same policy position (i.e., 34%).
Conclusion and Future Research
As the late great Speaker of the U.S. House of Representatives “Tip” O'Neil once stated that “All politics is local,” this study explores Taiwan’s political geography and compares public opinions toward an array of policy issues at both local and regional levels. The policy issues we examine here include environmental protection, social inequality, import of foreign labor,
adaptation of foreign culture, government’s responsibility for unemployment, reason for the poor, protection of Taiwan’s security, and economic relations with Mainland China. Our findings list as follows:
First, most of the issue opinion measures presented here do not vary considerably across counties/cities. The regional differences in these opinion measures are also minor. Therefore, although previous research suggested regional disparities in partisanship and vote choices, we do not find any salient geographical pattern when we examine public opinions toward specific policy issues. Indeed, there may exist certain geographical patterns with respect to electoral politics. However, the electoral geography found in previous studies seems to be irrelevant to our
study of specific policy preferences here.
Second, more often than not the specific public opinion measures correspond with ethnicity at the local level—that is, ethnicity is a significant predictor for five out of the eight opinion measures presented here. Specifically, ethnicity explains great variance in opinion measures concerning cross-strait relations. On the other hand, partisanship does not seem to play a
significant role in shaping these specific opinion measures. Only one opinion measure presented here—opinion toward economic relations with China—corresponds with partisanship at the local level. This preliminary result suggests that at the aggregate level, Taiwanese partisanship does not usually serve as a general proxy of policy preferences.
What the public want is always a major concern for students in democratic theory. Along with Taiwan’s democratization, public opinion research has enjoyed a rapid growth in Taiwan over the past two decades. Scholars have utilized various survey data to study Taiwanese voting behavior, political efficacy, national identity, attitudes toward re-unification and
independence,…and etc, and obtained fruitful results that significantly advanced our
understanding of Taiwan democracy. However, these studies have tended to narrowly focus on individual opinion formation and change. The emphasis on the individual over the aggregate unfortunately results in the disconnection of Taiwan’s public opinion studies from the central question of democratic theory: does public opinion manage to influence government decisions?
The above cross-sectional analysis of public opinion is just the beginning to answer this opinion-policy linkage question. Our next step will focus on opinion-policy congruence at the local level. And we hope to see more future opinion research at the aggregate level that may reconnect the study of Taiwanese public opinion to the broader question of democratic theory.
References
Berry, William D., Evan J. Ringquist, Richard C. Fording, and Russell L. Hanson. 1998. “Measuring Citizen and Government Ideology in the American States, 1960-93.”
American Journal of Political Science 42(1):327-48.
Brace, Paul, Kellie Sims-Butler, Kevin Arceneaux, and Martin Johnson, 2002. “Public Opinion in the American States: New Perspectives Using National Survey Data.” American Journal
of Political Science 46(1): 173-89.
Chang, G. Andy and T. Y. Wang, 2005. “Taiwanese of Chinese? Independence or Unification? An Analysis of Generational Differences in Taiwan.” Journal of Asian and African Studies 40(1/2): 29-49.
Erikson, Robert S., Gerald C. Wright, and John McIver, 1993. Statehouse Democracy: Public
Opinion and Policy in the American States. New York: Cambridge University Press.
Erikson, Robert S., Gerald C. Wright, and John P. McIver. 2004. “Public Opinion in the States: A Quarter Century of Change and Stability.” Paper Presented in the 4th Annual State Politics and Policy Conference, Cuyohoga Falls, OH.
Gelman, Andrew, 2006. Bugs.R.: Functions for Calling Bugs from R. (Available from http://www.stat.columbia.edu/~gelman/bugsR. accessed April 1, 2006)
Gelman, Andrew, 2004. “Prior Distributions for Variance Parameters in Hierarchical Models.” Unpublished manuscript.
Jackman, Simon. 2000. “Estimation and Inference via Bayesian Simulation: An Introduction to Markov Chain Monte Carlo.” American Journal of Political Science 44: 375-404.
Keng, Shu, and Lu-huei Chen, 2003. “Taiwan’s Regional Blocs” Wenti Yu Yanjiu 42,6: 1-27. Hsu, Yung-ming and Ming-tong Chen, 1998. ”Identifying the Dynamics Underlying Mass
Lee, Pei-shan and Yung-ming Hsu, 2001. “The Rise of Sothern Politics in Taiwan.” Paper presented at the Annual Meeting of the American Political Science Association, San Francisco, August 30-September 2, 2001.
Lin, Tse-min, Yun-han Chu and Melvin J. Hinich, 1996. “Conflict Displacement and Regime Transition in Taiwan: A Spatial Analysis,” World Politics, vol.48, no.4 (July), pp.453-82. McIver, John P., Robert S. Erikson, and Gerald C. Wright. 2001. “Public Opinion and Public
Policy in Temporal Perspective: A View from the States.” Paper Presented at Midwest Political Science Association Meeting.
Park, David, Andrew Gelman, and Joseph Bafumi. 2004. “Bayesian Multilevel Estimation with Poststratification: State-Level Estimates from National Polls.” Political Analysis 12: 375-385.
Pool, Ithiel de Sola, Robert P. Abelson, and Samuel L. Popkin. 1965. Candidates, Issues, and Strategies: A Computer Simulation of the 1960 and 1964 Presidential Elections. Cambridge: MIT Press.
Smith, Mark. 1997. “The Nature of Party governance: Connecting Conceptualization and Measurement.” American Journal of Political Science 41: 1042-56.
Spiegelhalter, D., A. Thomas, and N. Best. 1999. WinBugs Version 1.4. Cambridge, UK: MRC Biostatistics Unit.
Wang, T. Y. and I-Chou Liu, 2004. “Contending Identities in Taiwan: Implications for Cross-Strait Relations”. Asian Survey , 44, :568-590.
Weber, Ronald E., and William R. Shaffer. 1972. “Public Opinion and American State Policy-Making.” Midwest Journal of Political Science 16(4): 683-99.
Weber, Ronald E., Anne H. Hopkins, Michael L. Mezey, and Frank J. Munger. 1972. “Computer Simulation of State Electorates.” Public Opinion Quarterly 36(4): 549-65.
Wu, Naiteh, 1993. “Sheng ji yi shi, cheng chi chihch’ih ho kuo chia jen tung: Taiwan chu chun li lun te chu tan” (Ethnic Awareness, Political Support, and National Identity: A Explorary Analysis of Taiwan Ethnic Theory) in Chu chun kwan si yu kuo chia jen tung (Ethnic
Relationship and National Identity), Mao-kuei Chang (ed.) Taipei: Yeh-Chiang.
Wu, Naiteh, 1996. “Liberalism, Ethnic Identity and Taiwanese Nationalism” Taiwan Political
Science Review 1:5-40. (in Chinese)
Yu, Ching-hsin, 2004. “Direction and Strength of Voter’s Party Identification in Taiwan after 2000” Soochow Journal of Political Science, 19: 39-70.
Yu, Eric Chen-hua and Chia-hung Tsai, 2006. “Using National Surveys to Estimate Local Public Opinions.” Taiwanese Political Science Review 10(1): pp.5-38. (in Chinese)
Appendix I
Table A1: Questions concerning Policy Issues in the 2003 TEDS
Question Sample Size* % of 1 i y =
I. [ENVIRONMENT] If you had to make a choice between environmental protection and economic development, do you think environmental protection is more important or economic development is more important?
(yi =0 : economic development; yi = : environmental protection) 1
1389 47.7
II. [INEQUALITY] Some people think, “In order to preserve social justice, the government should prevent the gap between rich and poor from growing any larger.” Other people think, “The existence of a gap between rich and poor is natural, so the government shouldn’t get involved.” Which one do you agree with more?
(yi =0 : “government shouldn’t get involved”; yi = : “government 1 should limit gap”)
1530 69.3
III. [LABOR] Some people think, “In order to maintain our economic competitiveness, we should relax controls on foreign labor.” Other people think, “In order to make sure that our domestic laborers will have job opportunities, we should have strict controls on foreign labor.” Which one do you agree with more?
(yi =0 : relax controls; yi =1: strict controls)
1568 88.4
IV. [CULTURE] Some people think, “Our next generation is imitating the ideas and habits of foreigners. We are gradually losing our unique culture.” Other people think, “There is nothing wrong with large-scale adaptation of foreign culture.” Which one do you agree with more? (yi =0 : “nothing wrong with large-scale adaptation”; yi = : “losing 1 our unique culture”)
1457 60.4
V. [UNEMPLOYMENT] Some people think, “It is the government’s responsibility to solve our unemployment problem.” Other people think that, “Employment is each individual’s personal problem, and the government shouldn’t have anything to do with it.” Which one do you agree with more?
(yi =0 : personal problem; yi =1: government’s responsibility)
1509 81.5
people are poor is that they don’t work hard enough.” Other people think, “The main reason is that society doesn’t give them
opportunities.” Which one do you agree with more?
(yi =0 : “don’t work hard enough”;yi = : “society doesn’t provide 1 opportunities”)
VII. [SECURITY] In order to protect Taiwan’s security, some people think, “It is more important to improve relations with Mainland China.” Other people think, “It is more important to strengthen military
cooperation with the United States.” Which one do you agree with more?
(yi =0 : “strengthen cooperation with US”; yi = : “improve relations 1 with China”)
1343 70.8
VIII. [ECONOMY] Some people think, “Taiwan should develop closer economic relations with Mainland China.” Other people think, “Taiwan should try to reduce its economic reliance on Mainland China.” Which one do you agree with more?
(yi =0 : “reduce economic reliance”; yi = : “develop closer economic 1 relations”)
1423 41.7
Appendix II
Generating Local Public Opinion from National Surveys
This appendix introduces the procedures of how to use a multilevel logistic model with population information to estimate local-level opinions from national polls. The procedures illustrated here closely follow the method developed by Park et al. (2004).
A.
Let 0 if the respondent favors argument A 1 if the respondent favors argument B i i y i ⎧ = ⎨ ⎩
With 0 and 1 indicators derived from three demographic variables (sex: male or female); age: 20-29, 30-39, 40-49, 50-59, or 60+; and education: Less than Elementary School, Middle School Graduate, High School Graduate, Some College or Junior College Graduate, or College Graduate or above) and county/city of residence, the data-level model for the probability that an individual respondent favors a certain policy position can be specified as:
1
0 ( ) ( ) ( ) (
Pr(yi = =1) logit (− β +βfemale× femalei+βage iage +βedu iedu +βage iage edu××edu i)+βcounty icounty( ))
Except the regression coefficients for female, we assigned each batch of the regression coefficients an independent normal distribution centered at zero and with standard deviation estimated from the data.i That is:
2 2 2 , (0, ), for 1,...,5 (0, ), for 1,...,5 (0, ), for 1,...,5; for 1,...,5 age j age edu j edu age edu j k age edu N j N j N j k β σ β σ β × σ × = = = =
Because counties/cities are nested within 6 regions (i.e., PePeKeIi, TaoChuMiao, ChungChanTou, YunChiaNan, KaoKaoPing, and HuaTungPeng), we can assume that the regression coefficients for county/city indicators are normally distributed and specify the i
Sex is set as fixed effects in the model without any hierarchical structure because there is no gain to multilevel modeling for batches with J < 3 groups when prior distributions are noninformative (Gelman 2004; Park et al. 2004).
county/city-level model as: 2 ( ) 2 ( , ), for 1,..., 23 where (0, ), for 1,..., 6 county region j region j county region j region N j N j β β σ β σ = = Because the variance parameter, 2
m
σ for each batch of βm
coefficients is estimated from the data, a noninformative prior distribution such as uniform distribution is given to each of them.
The above multilevel logistic model is estimated via Bayesian simulation (Markov Chain Monte Carlo method) by using the software WinBUGS (Spiegelhalter et al. 1999) as called from
R (R Development Core Team 2003) using Gelman's (2006) Bugs.R.ii
B.
With the estimates of the logistic regression model, we can compute a weighted average response θ for each cross classification j with respect to demographics and states. Because we j use three demographic variables and 23 county/city indicators, there are 1,150 categories (i.e., j = 2×5×5×23) ranging from "Female", "Between the Ages 20-29", "Less than Elementary School", "Taipei county" to "Male", "Age of 60 and Over", "College Graduate and above", "Kaohsiung city."
C.
By using the 2000 Taiwan Census data, we can obtain the adult population for each category j. Thus the estimated (predicted) average response y in any county/city c is then
c pred
county j c j j j c j
y =
∑
∈ N θ∑
∈ N
, with each summation over the 50 demographic categories in the counties/cities.
ii
Three independently sequences were simulated with starting points drawn from a normal distribution. The simulations continued until the potential scale reduction, R, was near 1 (less than 1.1) for all estimands of interest.
Appendix III
Simulated Opinions vs. Observed Opinions
Table A.2: Correlation Coefficients between the Simulated Public Opinions and the Observed Public Opinions in the States
Questions Correlation Coefficient # of Counties
[ENVIRONMENT] 0.51 [INEQUALITY] 0.79 [LABOR] 0.80 [CULTURE] 0.79 [UNEMPLOYMENT] 0.66 [WELFARE] 0.94 [SECURITY] 0.20 [ECONOMY] 0.84 Average 0.69 23
Figure A1: Plot of Imputed State Opinions vs. Observed State Opinions 0.0 0.4 0.8 0. 0 0 .4 0 .8
% of Support for ENVIRON
% of Y i= 1 for E N V IR O N 0.0 0.4 0.8 0. 0 0 .4 0 .8
% of Support for INEQUAL
% of Y i= 1 for IN E Q U A L 0.0 0.4 0.8 0.0 0 .4 0.8
% of Support for LABOR
% of Y i= 1 f o r LA B O R 0.0 0.4 0.8 0.0 0 .4 0.8
% of Support for CULTURE
% o f Y i= 1 f o r CU L T URE 0.0 0.4 0.8 0.0 0 .4 0.8
% of Support for UNEMP
% of Y i= 1 for U N E M P 0.0 0.4 0.8 0.0 0 .4 0.8
% of Support for WELFARE
% of Y i= 1 f o r W E LF A R E 0.0 0.4 0.8 0.0 0 .4 0.8
% of Support for SECURITY
% o f Y i= 1 f o r S E CURI T Y 0.0 0.4 0.8 0.0 0 .4 0.8
% of Support for ECONOMY
% of Y i= 1 for E C O N O M Y
Table 1: Association between County-level Issue Opinions and Partisanship (Ethnicity) Percent Difference of Partisanship ( %Green - %Blue) Percent Difference of Ethnicity (%Minnan - %Mainlander) Opinions toward Policy Issue Bivariate Correlation (1) Regression Coefficient§ (2) Bivariate Correlation (3) Regression Coefficient§ (4) # of Obs [ENVIRONMENT] .11 .07 (.13) R2=.01 -.45** -.12** (.05) R2=.20 [INEQUALITY] -.03 -.02 (.12) R2=.001 -.13 -.03 (.05) R2=.02 [LABOR] -.14 -.11 (.18) R2=.02 .41* .15* (.08) R2=.16 [CULTURE] -.19 -.07 (.09) R2=.03 .47** .09** (.04) R2=.22 [UNEMPLOYMENT] .14 .04 (.06) R2=.02 -.29 -.03 (.02) R2=.08 [WELFARE] .11 .04 (.08) R2=.01 -.11 -.02 (.04) R2=.01 [SECURITY] .11 .06 (.13) R2=.01 -.46** -.12** (.05) R=.21 [ECONOMY] .53*** .31*** (.11) R2=.28 -.76*** -.21*** (.04) R2=.57 23
§ Constant term does not show here. ***significant at the 0.01 level **significant at the 0.05 level *significant at the 0.1 level
Figure 1: Level of Consensus across Policy Issues at the National Level
-20 0 20 40 60 80
Percent Y=1 minus Percent Y=0 VIII. [ECONOMY] VII. [SECURITY] VI. [WELFARE] V. [UNEMPLOYMENT] IV. [CULTURE] III. [LABOR] II. [INEQUALITY] I. [ENVIRONMENT]
Figure 2: Parallel Box plots of Percent of Y=1 Supporters by Issues of Socioeconomic Cleavages
(I) (II) (III) (IV) (V) (VI) (VII) (VIII)
40 50 60 70 80 90
Issues for Socioeconomic Cleavages
% o f Y i= 1 Chiayi Taipei City Chiayi Tainan Tainan Taicung City Taipei City Taipei Tainan Keelung City Changhua Kaohsiung City Miaoli Taitung Yunlin Taipei City Taipei Yunlin
ENVIRON INEQUAL LABOR CULTURE UNEMP WELFARE SECURITY ECON ECONO SECUR WELFA UNEMP CULTU LABOR INEQU ENVIR
Figure 3: Regional Differences in Opinion Measures 0 20 40 60 80 100 Percent of Y=1 VIII. ECONOMY VII. SECURITY VI. WELFARE V. UNEMPLOYMENT IV. CULTURE III. LABOR II. INEQUALITY I. ENVIRONMENT PePeKeLi TaoChuMiao ChungChunTou YunChiaNan KaoKaoPing HuaTungPeng