銀行業之跨國合併與收購:收購銀行之動機、收益率及效率之影響因素及表現
64
0
0
全文
(2)
(3) Acknowledge. I would like to thank those who helped me, in various ways, to bring this thesis to completion. I am especially grateful to my advisors Professor Frank Ying, who provided me guided me throughout this study and gave me useful lectures and lots of encouragement during these two years, and Chairman Lee, who has supported and encouraged me through my two-year master life in NSYSU. I also like to extend my appreciation to committee, Professor Lo and Professor Liang for crucial suggestions and commends to improve my thesis. Special thanks go to Professor Koyin Chang for her guidance and suggestions on the econometric methodology and encouragement through study time.. I would like to express my gratitude to all professors of IMBA program. Because of their great lectures and guidance, I have more different thoughts and in each fields. I also like to thanks to all my classmates, especially Ying-Hsuan, Iris, Lulu, Johanna, Monica, Tracy, etc., for your great friendship. I wo uld never forget the time we study and have fun together. You guys are great!!. Finally, I am mostly grateful to my family, especially my parents. They give me the opportunity to receive master education in NSYSU. Also, I appreciate their inspiration, support, and encouragement over these two years..
(4) 銀行業之跨國合併與收購: 收購銀行之動機、收益率及效率之影響因素及表現. 中文摘要 本論文以銀行業間之跨國合併與收購,探討收購銀行進行合併與收購之動 機,並深入研究收購銀行於收購前與收購後之短期、中期及長期之收益率及效 率。此外,此論文也對影響收購銀行之收益率及效率之因素提出並加以證實。研 究發現,收購銀行之收益率於任何時間點,並無因銀行業之跨國合併與收購而提 升。而收購銀行之效率於收購後五年有提升之趨勢。此外,提升淨利息收入與資 產之間的比率為主要影響收益率之因素,增加非利息收入與資產之間的比率及減 少支出與資產之間的比率只對於收購後短期及中期有顯著影響。而減少營運管理 費用與資產之間的比率、減少非利息收入與資產之間的比率及增加借出之貸款與 資產之間的比率皆於三個時程中有顯著的影響。另外,被收購銀行之多寡並不影 響收購銀行之收益率及效率。. iv.
(5) International Mergers and Acquisitions in Banking Industry:Motives, Determinants and Performance of Profitability and Efficiency of Acquiring Firms. Abstract. In the context of increasing consolidation in the banking industry, this research examined the profitability and efficiency performance before and after international mergers and acquisitions of acquiring banks, and the major determinants to improve performance. In a sample of 295 commercial banks and bank holding companies, international mergers and acquisitions does lead to potential improvement in efficiency for acquiring bank s. However, no evidence shows that profitability would be improved through international mergers and acquisitions. Further, it is found that enhancement in net interest margin is most significant variable to influence the improvement in profitability; while reduction of administrative costs and non- interest revenues and improvement in generating loans are significant to enhance the efficiency performance.. v.
(6) Table of Content. I、 Introduction… … … … … … … … … … … … … … … … … … … … … … … … … … … ..1 II、 Background and Current Trends in International Mergers and Acquisitions… .… 4 III、 Literature Review… … … … … … … … … … … … … … … … … … … … … … … … .9 A、. The motives and the consequences of maximizing wealth… … … … .… … .10 A.1 Profitability… … … … … … … … … … … … … … … … … … … … … … ...10 A.2 Efficiency… … … … … … … … … … … … … … … … … … … … … … … .17. B、The motives and the consequences of non-maximizing wealth… … … … ..… .20 B.1 Managerial factors… … … … … … … … … … … … … … … … … … … … 20 B.2 Government factors… … … … … … … … … … … … … … … … … … … ..22 IV、 Data and Methodology… … … … … … … … … … … … … … … … … … … … … … 24 A、 Data and Samples… … … … … … … … … … … … … … … … … … … … … … .24 B、Operating Performance Approach… … … … … … … … … … … … … … … … .26 C、Hypotheses… … … … … … … … … … … … … … … … … … … … … … … … … 27 D、 Feasible Generalized Least Squares Regression Model… … … … … … … ..29 E、 Regression and Variables… … … … … … … … … … … … … … … … … … … ...30 E.1 T-test… … … … … … … … … .… ...… … … … … … … … … … … … … … ...30 E.2 FGLS Regression Model..… … … ..,… … … … … … … .… … … … … … ..31 V、 Empirical Result… … … … … … … … … … … … … … … … … … … … … … … … ...36 A、 Results from Descriptive Statistics and t-test… … … … … … … … … … … ...36 B、Results from Cross-sectional Time-series FGLS Regression Model… … … 38 VI、 Conclusion… … … … … … … … … … … … … … … … … … … … … … … … … … ..42 Reference… … … … … … … .… … … … … … … … … … … … … … … … … … … ...… … ..45. vi.
(7) List of Tables. Table 1: International mergers & acquisitions by different financial institutions… .… .7. Table 2: International mergers and acquisitions in banking industry by continent between 1990 and 2005.… … … … … … … … … … … … … … … … … … … .… 8. Table 3: Sample Characteristics… … … … … … … … … … … … .… … … … … … … … ..25. Table 4: Variable Definitions… … … … … … … … … … … … … .… … … … … … … … ..35 Table 5: Descriptive Statistics of Explanatory Variables… … … … … … … … … … … .37. Table 6: Performance of acquiring banks before and after M&As… … … … … … … ..38. Table 7: Results from Regression Model… … … … … … … … … … … … … … … … … .40. vii.
(8) I、Introduction. The trend of consolidation in financial industries is unprecedented. The integration of financial markets has fundamentally different sectors including lending, investment bank ing, asset management, and insurance. Within these fields, the issue about mergers and acquisitions of commercial banks is of interest. A merger is a combination of two companies to form a new company, while an acquisition is the purchase of one company by another with no new company being formed. Particularly, the deregulations of the Second Directive in Europe and the Riegle-Neal Act in United States in the mid-1990s have resulted in consolidation in financial industries across countries. 1. This paper is meant to investigate the operational performance of acquiring and merging banks involving in international mergers and acquisitions before and after the actions. The main question addressed in this paper is whether the process of international mergers and acquisitions improve the profitability and efficiency of acquiring or merging banks. Furthermore, major determinants to improve each performance are also identified. Through the empirical results by comparing the performance of merging and acquiring banks before transaction and that of combined entity afterward and determining the dominant variables to improve the performance, banks who are interested in international mergers and acquisitions may plan more carefully to implement actions.. Eventually, the main motivations for banks to merge and acquire can be divided into two categories, wealth- maximizing motives and non-wealth maximizing. 1. In fact, there is also a trend towards the international mergers and acquisitions between commercial banks and bank holding companies and becomes another major choice for management of banks. 1.
(9) motives. 2. In regular basis, the rationale for merger is to reduce risk to improve. utility (Hawawini and Swary, 1990).. Banks may maximize shareholder’s wealth. through mergers and acquisitions, since the financial consolidation possibly enhancing efficiency, increasing market power, and enlarging access to the safety net.. Besides, dynamic changes in global economies have forced banks paying close attention on merger and acquisition activities. The international consolidation of the market and technology progress allows banks accessing new markets both geographic-wise and services-wise.. However, deregulations of geographical or. product restrictions in different countries may become a new block to get into (Berger et al., 1999).. There are also some other factors may cause the performance of the. acquiring banks of international consolidation, including some barriers inhibiting foreign financial institutions from competing against domestic institutions, market conditions, government regulations, local culture, etc.. The primary performance of the mergers and acquisitions would be measured by the profitability and efficiency before and after the actions. 3. Particularly, existing. literatures are interest of what variables would improve efficiency and profitability. Some findings suggest that efficiency considerations may limit the global consolidation of the financial services industry (Berger et al, 2000). Other studies found that deals increase the acquirer ’s profitability, but domestic acquisitions perform better than cross-country acquisitions within the EU (Di iaz Diaz et al, 2002). However, some studies found that there is no change in firm risk, on average, but a decline in return on equity for the acquiring firms (Amihud et al, 2002). 2. Wealth-maximize is to increase shareholder’s value as much as possible. Non-wealth maximize means that maximizing shareholder’s value is not the primary goal, there are motives for other stakeholders, including mangers and governemtns. 3 There are also secondary performances worthy to be investigated, including risk-return, staff cost per se, etc. 2.
(10) The paper analyzes the before- and after- performance of acquiring firms involved in international mergers and acquisitions in the 1990-2001 period. The empirical examinations are presented into two parts. One is to examine the improvement of efficiency and profitability of acquiring companies before and after mergers and acquisitions. The other one is to determinant the major effect to improve efficiency and profitability performance. Both t-test and cross-sectional time-series FGLS regression model are used in this study.. In this paper, it is found that international mergers and acquisitions may not improve profitability performance whether it is in short-run or long-run. It is also found that international mergers and acquisitions may potentially improve efficiency performance in long run. Furthermore, increase in non- interest margin is a significant role to improve profitability, while reduction of expenses and increase in operating revenue are determinants of profitability improvement only for shore-term and mid-term after mergers and acquisitions. The aggressiveness to generate loan, and reduction of non- interest revenue and administrative costs ratios may lead to improvement in efficiency. However, number of targets purchased by the acquirer at the year of mergers and acquisitions has no influence to the profitability and efficiency performance.. The paper is organized as follow. Section 2 presents current trends on international mergers and acquisitions in banking industry. Section 3 reviews the extant researches on motives and consequences of international mergers and acquisitions. Section 4 describes the data and methodology used in this study. Section 5 reports the empirical results, and section 6 offers conclusions and discusses some suggestions and limitation of the study.. 3.
(11) II、Background and Current Trends in International Mergers and Acquisitions. Mergers and acquisitions among financial institutions have risen steadily for the past few decades. Both the regulatory changes and international commerce improvement have paved the way for a continued increase in international mergers and acquisitions for financial institutions. However, international mergers and acquisitions in banking industry remained relatively rare compare to other industries. Between 1990 and 2005, only about 15 percent of all bank merger and acquisition deals around the world involved headquarters in two different countries (see Table 1). Focarelli and Pozzolo (2001) found that in the 1990s, cross-border mergers accounted for only 13 percent of merger activities within the banking industry compared to 35 percent within manufacturing and 24 percent within all sectors on average.. One of most important issues to accelerate the financial consolidation is regulatory changes. A sequence of laws passed over last two decades in Europe and United States had motivated management of financial institutions to expend its market by either operating across national borders, or getting into other financial fields. In United States, the Riegle-Neal Act of 1994 played an important role to change the way of mergers and acquisitions of financial institutions. The Riegle-Neal Act eliminated most of the restrictions on interstate banking and branching. It allows geographic expansion in the United States. However, U.S. banking laws still prohibit most types of universal banking. More recently, the Gramm-Leach-Bliley Act of 1999 passed to remove many restrictions on combing commercial banking, securities companies, and insurance companies into a consolidated financial organization (Berger et al., 2000).. In Europe, the Single European Act of 1986 created a single economic marketplace across the EU. When it effected in 1992, it also eliminated all physical, 4.
(12) legal, and technical barriers to cross-border movement of labor, goods, services, and capital. The Second Banking Co-ordination Directive of 1989 introduced the single banking license throughout the EU. Most importantly, it allowed the universal banking system. In 1993 and 1994, the time of the effectiveness of the Second Directive, a series of directives was introduced to achieve a European single securities market and to establish a “single passport” for investment firms (Benink 1993; Molyneux et al., 1996).. The improvement in international commerce has increased the demand for international financial services. A financial institution, especially a bank, would like to “follow the client ” to provide the services in a foreign country. There are few ways to make it possible, including the foreign direct investment (FDI), the mergers and acquisition of a local bank, etc. These investment activities in a foreign nation not only provide efficient services to the existed customers but also create a new opportunity to expend the market across the border.. Table 1 and Table 2 display aggregate statistics on trends in financial consolidation, especially the figures about merger and acquisition activities in banking industry.. Table 1 shows the number and the percentage of international financial. institution mergers and acquisitions of each type of financial institutions from 1990 to 2005. It is clearly showed that insurance companies has the highest percentage (23.7%) to merge with or acquire another financial institution across the border; while international mergers and acquisitions only account for 0.46% of all mergers and acquisitions of saving companies. From another point of view, most financial institutions still merge with or acquire the firm within the same financial fields, but about half of merger and acquisition deals made by investment companies are with financial institutions in other financial fields. 5.
(13) More specifically, Table 2 expresses the number and the percentage of international bank mergers per continent as well as the changes over time. Worldwide, the number of mergers and acquisitions within banking industry (both parties are commercial banks or BHCs) reached to the peak in 1990s, and started to decrease between 2001 and 2005. However, international mergers and acquisitions did not follow the same direction. The number of international mergers and acquisitions increased steadily between 1990 and 2005. European nations and North American nations experienced a significant growth in the share of international bank mergers and acquisitions through the three periods. This situation clearly showed the effect of the deregulation of the Second Directive in Europe and the Riegle-Neal Act in United States after 1995. On the other hand, Asia and Pacific nations and Latin America nations experienced a significant downward trend in percentage international mergers and acquisitions in banking industry through three periods. The decline figure in Asia and Pacific area probably resulted from the financial crises in the late 1990s. It also noticed that international mergers and acquisitions occurred relatively low in North American nations, at the average of 2 percent of the total merger and acquisition deals although the figures steadily increase through the period. Table 2 also shows the international mergers and acquisitions within the same continent. The percentage of intra-continental mergers and acquisitions showed the upward trend in both African nations and European nations; while Asia and Pacific area and Latin America experienced a decline in mergers and acquisitions within same continent. Within this criterion, European countries experienced a significant growth. This increase could be the result of countries in Eastern Europe opening their markets to their wealthier neighbors (Bush and DeLong, 2004), and the single license of bank through EU introduced in Second Directive in early 1990s. Banks in Europe and in North America would then tend to acquire institutions in their own continents as 6.
(14) Table 1 International mergers & acquisitions by different financial institutions Commercial. Insurance. Investment. Real Estate. Saving. Other Financial. Banks & BHCs Institutions. Companies. companies. Companies. Companies. Institutions. Total. Number of mergers & acquisitions. 11584. 1199. 6865. 18567. 4799. 1949. 295. 45258. International mergers & acquisitions. 1808. 223. 1630. 3052. 554. 9. 75. 7351. Domestic mergers & acquisitions. 9776. 976. 5235. 15515. 4245. 1940. 220. 37907. International as % of total. 15.61%. 18.60%. 23.74%. 16.44%. 11.54%. 0.46%. 25.42%. 16.24%. Intra-continental as % of total. 9.75%. 6.26%. 13.12%. 8.55%. 8.09%. 0.15%. 10.85%. 9.10%. Cross-industry mergers & acquisitions. 4585. 517. 1444. 9121. 920. 581. 167. 17335. Cross-industry as % of total. 39.58%. 43.12%. 21.03%. 49.12%. 19.17%. 29.81%. 56.61%. 38.30%. Intra-industry as % of total. 60.42%. 56.88%. 78.97%. 50.88%. 80.83%. 70.19%. 43.39%. 61.70%. Acquiring Institutions. Credit. 1990-2005. Source: Thomson Financial Securities Data (2006), author calculations.. 7.
(15) Table 2 International mergers and acquisitions in banking industry by continent between 1990 and 2005 Asia & Pacific. Africa. Europe. Latin America. North America. Total. Panel A: 1990-2005 Number of bank mergers & acquisitions International mergers & acquisitions Domestic mergers & acquisitions International as % of total Intra-continental as % of total. 649 159 490 24.50% 15.41%. 58 25 1454 43.10% 22.41%. 2194 740 33 33.73% 24.79%. 227 48 3792 21.15% 12.33%. 3871 79 179 2.04% 0.23%. 6999 1051 5948 15.02% 9.92%. Panel B: 1990-1995 Number of bank mergers & acquisitions International mergers & acquisitions Domestic mergers & acquisitions International as % of total Intra-continental as % of total. 100 37 63 37.00% 23.00%. 23 9 677 39.13% 17.39%. 887 210 14 23.68% 17.93%. 42 16 1644 38.10% 21.43%. 1662 18 26 1.08% 0.30%. 2714 290 2424 10.69% 7.37%. Panel C: 1996-2000 Number of bank mergers & acquisitions International mergers & acquisitions Domestic mergers & acquisitions International as % of total Intra-continental as % of total. 244 55 189 22.54% 13.93%. 16 5 496 31.25% 25.00%. 809 313 11 38.69% 27.07%. 122 23 1437 18.85% 11.48%. 1474 37 99 2.51% 0.14%. 2665 433 2232 16.25% 10.24%. Panel D: 2001-2005 Number of bank mergers & acquisitions International mergers & acquisitions Domestic mergers & acquisitions International as % of total Intra-continental as % of total. 305 67 238 21.97% 14.10%. 19 11 281 57.89% 26.32%. 498 217 8 43.57% 33.33%. 63 9 711 14.29% 7.94%. 735 24 54 3.27% 0.27%. 1620 328 1292 20.25% 13.64%. Source: Thomson Financial Securities Data (2006), author calcula tions.. 8.
(16) opposed to traveling across oceans to find a merger partner (Bush and DeLong, 2004). This could result from different legal systems and imprecise regulations of most developing countries in other continents, even though some countries contain huge market potential. Different languages, cultural backgrounds, transparency, government regulatory systems, and risks are all important factors for banks to consider to merge or to acquire across national border.. III、Literature Review. There are several aspects related to international mergers and acquisitions in previous researches. A number distinct hypotheses have been advanced to explain the motivations inherent in merger and acquisition activities. Different stakeholders of the firm may be interested in one or more than one motives to make the consolidation decision. Shareholders may engage in cross-border consolidation activities in order to maximize wealth by increasing the financial institution’s market power in setting retail prices and/or by improving the efficiency. Managers may be able to pursue personal objectives in consolidation decisions, particularly in banking corporate control is relatively weak. The governments also play very important roles in cross-border consolidation activities through changing the regulatory, through approval or disapproval decisions for individual mergers and acquisitions, and through providing consolidation assistance during the period of the financial crisis. The literature review would be divided into two parts: the wealth maximizing motives and consequences and the non-wealth maximizing motives and consequences.. 9.
(17) A、The motives for and the consequences of maximizing wealth. The primary goal and motive behind most of merger and acquisition deals in the financial service industry is to achieve the main purpose of maximizing shareholder’s wealth. The increase in the shareholder’s wealth of the acquiring entity either could be a result of value created by the merger and acquisition activity or could result from a wealth transfer from bondholders to shareholders with no change in total market value of both participants.. The two main ways to achieve it are improving the. efficiency and profitability and increasing the market power in the setting service and retail prices. A.1 Efficiency and Profitability. Improving efficiency is another major way to create shareholder’s wealth. Eventually, efficiency gains are made by reducing costs, increasing revenues, and/or reducing risks to increase value for the given set of prices. Mergers and acquisitions may allow the institutions to achieve the economies of scale, scope, or mix of products, which may reduce operational, marketing, or administrative costs. According to the synergy hypothesis, mergers create synergetic gains if the production, administrative, or marketing costs of the consolidated firms are smaller than the sum of these costs for the two individual firms before their merger. Everything else being the same, lower costs should mean increased profits and higher stock prices for both acquiring bank shareholders and target bank shareholders. Expected synergistic gains should create positive net aggregate wealth. Reductions in risk may also increase shareholder wealth because of financial distress, bankruptcy, and loss of franchise value.. Both in U.S. and Europe, many studies suggest that mergers and acquisition may 10.
(18) be motivated in part by the potential for efficiency gains. Some studies show that in a substantial proportion of mergers and acquisitions, a large, more efficient institution tends to take over a smaller, less efficient institution. In U.S., acquiring banks appear to be more cost efficient than target banks on average (Berger and Humphrey, 1992; Pilloff and Santomero, 1998). Another study of US banks found that acquiring banks are more profitable and have smaller nonperforming loan ratio than target banks (Peristiani, 1993). However, one study found that while poorly-capitalized banks are more likely to be acquired, banks with a high degree of cost inefficiency are less likely to be acquired without government assistance (Wheelock and Wilson, 1998). One European study also found that large, efficient banks tend to acquire small, less efficient banks (Vander Vennet, 1997). Mergers and acquisitions may also improve efficiency if greater diversification improves the risk-expected return tradeoff. It is consistent with one study which found that U.S. acquiring banks bid more for targets when the consummation of the M&A activities would lead to significant diversification gains (Benston et al, 1995). Diversifying mergers and acquisitions may also improve efficiency in the long term through expanding the skill set of managers (Milbourn et al., 1999).. One of the most mentioned sources of the potential efficiency gains from mergers and acquisitions is the economies of scale. According to the hypothesis of economies of scale, the combination of two or more firms will yield an increase in overall effectiveness. A firm is subject to economies of scale when its long run cost decreases as its output increases. In fact, most of the research on bank scale economies found that the average cost curve had a relatively flat U-shape with medium-sized banks being slightly more cost scale efficient than either large or small banks. The location of the scale-efficient point differed among studies, but was 11.
(19) usually between about $100 million and $10 billion in assets (Ferrier and Lovell, 1990; Hunter, et al., 1990; Noulas, et al. 1990; Berger and Humphrey, 1991; Bauer, et al., 1993; Clark, 1996). Most of findings suggested that there were no cost scale efficiency gains and possibly cost scale efficiency losses from further consolidation of the type of large institutions typically involved in international activity. A recent study, which is consistent with it, found that simulated pro forma mergers and acquisitions between large banks in different nations in the EU found that these mergers and acquisitions were more likely to increase costs than to decrease them (Altunbas, et al., 1997).. Despite most of the empirical evidences suggested that efficiency gains from the exploitation of scale economies disappear once a certain size is reached and that there might be diseconomies of scale above some threshold, most of these research used data on financial institution from the 1980s. There is another factor may have increased scale economies in improving efficiency to increase wealth, which is the technological progress. The large financial institutions may more efficiently exploit new tools of financial engineering, including derivative contracts, off-balance-sheet guarantees, and risk management. In addition, some new delivery methods for customer services, such as ATMs, Internet banking, and phone banking, may also exhibit greater economies of scale than traditional branching network (Radecki, et al., 1997). Moreover, advances in payments technology may have created scale economies in back-office operations and network economies that may be more easily exploited by large institutions (Bauer and Hancock, 1995; Bauer and Ferrier, 1996; Hancock, et al., 1999).. Economies of scope and product mix may also provide efficiency gain by reducing the cost. Financial institutions may provide multiple products within firms 12.
(20) in order to lower down the overall costs. Scope efficiencies were measured by comparing the predicted costs of an institution producing multiple financial services and a set of institutions that each specialize in producing a subset of these services. However, it is difficult to measure the existence and extent of scope and product mix efficiencies since the benchmark should consist of single-product firms. As the result, the empirical results and implications for consolidation of scope and product mix efficiencies were qualitatively similar to those for scale efficiency studies— very few cost savings were implied from consolidating the outputs of different banks (Hunter, et al., 1990; Noulas, et al., 1990; Pulley and Humphrey, 1993; Ferrier, et al., 1993).. Scope and product mix efficiencies are being focused in 1990s since more and more international mergers and acquisitions and cross- industry consolidation occurred. However, most of studies of scope and product mix efficiencies focused on cross industry consolidation, especially the universal bank and financial conglomerates, the combination among commercial banks, insurance companies, security companies, and even the non financial firms. Cost economies may result from sharing physical inputs, reusing information, or reusing managerial expertise. Information reusability (Greenbaum, et al., 1989) may reduce costs when a universal bank acting as an underwriter conducts due diligence on a customer with whom it has had a lending or other relationship (Rajan, 1996).. One study of European universal banking found. very scope economies (Allen and Rai, 1996); while one study found mostly diseconomies of producing loans and investment services within German universal banks (Lang and Welzel, 1998). Moreover, cost scope and product mix diseconomies may arise because of coordination and administration costs from offering a broad range of products, often outside the senior management’s area of core 13.
(21) competence (Winton, 1999).. Some studies found that there is little change in cost efficiency but an improvement in profit efficiency of large U.S. banks after mergers and acquisitions, especially if both target and acquiring banks were relatively inefficient prior to the merger (Berger, et al., 1996; Berger and Mester, 1997; Clark and Siems, 1997; Akhavein, et al., 1997).. The increase in scale associated with consolidation may create revenue scale economies because some customers prefer the services of larger institutions. It is noticed that part of revenue efficiency comes from financial institutions following the existing customers across international borders, maintaining the benefits of existing relationship. For instance, some analyses found that many foreign banks initially entered the U.S. to help service home country clients that were starting U.S. operations (Budzeika, 1991; Gross and Goldberg, 1991; Seth and Quijano, 1993; Terrell, 1993). There are some empirical evidence examined the effects on profit efficiency on scale efficiency, and the result is ambiguous. Some evidence of mild ray scale efficiencies in terms of joint consumption benefits for customers (Berger, et al., 1996), and profit efficiency sometimes being highest for large institutions (Berger, et al., 1993), sometimes being highest for small institutions (Berger and Mester, 1997), and sometimes about equal for large and small institutions (Clark and Siems, 1997).. The consolidation may lead banks to hold a more diversified loan portfolio, which may exploit revenue scope and product mix economies. One is that consumers may be willing to pay more for the convenience of one-stop shopping of their purchase of financial products. One is the reputation and strong brand name that customers could recognize or even prefer. However, it may also create revenue 14.
(22) scope diseconomies by appearance of conflicts of interest among different product division, etc. One stud y about scope of product mix efficiencies found little or no revenue scope efficiency between deposits and loans in terms of charging customers for joint consumption benefits (Berger, et al., 1996). Studies of profit scope efficiencies within banking found that joint production is more efficient for some firms and specialization is more efficient for others (Berger, et al., 1993; Berger, et al., 1999).. Mergers and acquisitions may also improve efficiency if greater diversification improves the risk-expected return tradeoff. According to the diversification hypothesis, the consolidated firms may reduce their combined risk if the mergers create diversification gains. This will be the case if the risk of the combined firms is less than the weighted average of the risks of the two individual firms prior to the consolidation. Consistent with this, one study found that U.S. acquiring banks bid more for targets when the consummation of the merger and acquisition would lead to significant diversification gains (Benston, et al., 1995). Some studies have found that bank managers act in a risk adverse fashion, trading off between risk and expected return, and therefore may tolerate additional costs expended to keep risk under control (Hughes, et al., 1996, 1997).. Taking the risk-expected return tradeoff into account also allows for possible scale, scope, and product mix efficiencies in managing risk. One study found scale efficiency from diversification of loan risk, 4 which is presumably because of diversification benefits. This does not necessarily mean that the institutions would have lower risk, but they may still choose a higher risk-higher expected return point on the improved frontier. 4. More detail refer to McAllister and McManus, 1993 15.
(23) There are still some research suggested that at least some types of cross-border consolidation would improve risk-expected return tradeoff. The literature on commercial banks in U.S. generally found that larger, more geographically diversified institutions tend to have better risk-expected return tradeoffs (McAllister and McManus, 1993; Hughes, et al., 1996, 1997; Hughes and Mester, 1998; Demsetz and Strahan, 1997). Similarly, one study which examined the improvement of diversification gains in the risk-expected return tradeoff found that when organizations are larger in a way that geographically diversifies, especially via interstate banking that diversifies macroeconomic risk, efficiency tends to be higher and insolvency risk tens to be lower (Hughes, et al., 1999). Moreover, one study suggested strong diversification possibilities and opportunities to improve the institutions’ risk-expected return tradeoffs through cross-border consolidation (Berger, et al., 2000). However, Amihud et al. (2002) examined the effect of 214 cross-border mergers on the acquiring firm’s risk and returns. They find no change in firm risk, on average, but a decline in return on equity for the acquiring firm.. For the international mergers and acquisitions, there are several factors that may cause the efficiency consequences to be different than those for domestic mergers and acquisition. First, there may be some barriers that inhibit foreign financial institutions from operating efficiency and competing against domestic financial institutions, especially culture and regulatory structures. In addition, the market conditions and policies of the home nation may also affect cross-border efficiency. Studies of cross border efficiency usually have found that domestic banks are significantly ore efficient than foreign owned banks (DeYoung and Nolle, 1996; Mahajan, et al., 1996; Berger and DeYoung, 2000; Berger, et al., 2001).. 16.
(24) A.2 Market Power. Most of research on market power effect of the merger and acquisition in financial service industry focuses within one single nation. Particularly, the focus is typically on the M&A activities within same local market. According to the market power hypothesis, in market mergers and acquisitions create monopolistic power by reducing number of competing firms in the industry. These in- market mergers and acquisitions substantially increase market concentration, and allow consolidated financial entities to create shareholder’s wealth through setting less favorable prices on retail services, including lower deposit rate, higher loan rates, etc. Consistent with this focus, it has been found that U.S. households and small businesses almost always choose a local financial institution (Kwast, et al., 1997). Also, this is consistent with what has been found that many European bank mergers and acquisitions are of this type as well (Vander Vennet, 1997), and findings that about half of the US bank mergers and acquisitions are in- market (Berger et al., 1999).. Most of the research evidence showed that higher local market concentration by mergers and acquisitions may lead to raise market power in setting retail services prices. Some studies found that banks in more concentrated markets charge higher rates on small business loans and pay lower rates on retail deposits (Berger and Hannan, 1989, 1997; Hannan 1991). Other researches also found that in more concentrated markets, bank deposit rates were “sticky” or slow to respond to changes in open-market interest rate, and the stickiness was greater with respect to the rate increases than decreases, which is consistent with market power (Hanna and Berger, 1991; Hannan, 1994; Jackson, 1997). Nonetheless, despite the empirical evidences of market power by banks in 1980s, it is suspected that the market power may have been decline since most of the empirical evidence of local market concentration on 17.
(25) prices and profit used data on U.S. banks from the 1980s.. The financial deregulation including the Riegle-Neal Act in the U.S. in 1994 and the Second Banking Directive in EU in 1993 made changes in the trends of mergers and acquisitions in financial industry. There are more cross-border consolidation and cross- industry mergers and acquisitions occurred across the world. Although the cross-border consolidation does not directly increase the local market concentration through selling particular financial products to retail customers, the rapid pace in international merger and acquisition activities still affect the exercise of market power over customers. The main effects included the contestability of the financial market, the competition in many markets, and the technological innovation. The international mergers and acquisitions may reduce the exercise of market power because of an increase in the degree of contestability of financial services markets. There are few occasions tha t the contestability may occur. One circumstance is that the financial entities within nations alter the pricing behavior to provide better prices to customers in order to deter foreign entry. Another may occur if some efficient foreign financial entities enter and provide better services with compatible prices to take the market share away from the existing financial institutions. Both ways lead to the same result that the market power effects may be declined due to international consolidation.. One of most famous instance is EU. Due to the adoption of the single currency, the competition among the financial institution is getting more serious and obvious by reducing entry barriers and by lowering currency risk. Customers would have more choices to purchase the financial products in other nations in EU. The results of the recent studies on changes in market power are mixed. One evaluated changes in 18.
(26) competitive conditions in banking in major EU nations between 1986 and 1989 and found that the monopolistic competition that prevailed at the beginning of the period did not change substantially over time (Molyneux, et al., 1994). Another study found that no major change in competitive banking conditions between 1989 and 1996 (Bikker and Groeveveld, 1998), the period among the implementation of the Second Banking Derivative. However, one study found more price competition that was linked to interest rate deregulation in individual countries (Cerasi, et al., 1998).. International consolidation may also affect the exercise of market power within individual markets. In the United States, the Riegle-Neal Act of 1994 eliminated the restrictions on interstate banking and branching and allowed geographic expansion in the U.S. Also, the Second Banking Directive in 1993 in EU allows European banks to form financial conglomerates and universal banks which may hold equity stakes in non- financial companies. Both acts changed the trends of the domestic and international mergers and acquisitions. Banks and other financial institutions may enter into other field in order to diversify the products or/and enter other areas to expand their market. Evidence on bank fees on retail deposit and payments services shows very little relationship with measures of local market concentration in 1990s, and that multi-state BHCs tend to charge higher fees to retail customers than other banks (Hannan 1998).. The studies on market power with price and profits after 1990s are mixed. The relation ship between local market concentration and deposit rates seems to have dissipated somewhat in the 1990s (Hannan, 1997; Radecki, 1998), although the relationship between local market concentration and small business loan pricing still appears to be strong (Cyrnak and Hannan, 1998). In addition, the banks that were found to have persistently high profits relative to the industry generally were not those 19.
(27) in local markets with the highest concentration or with the greatest barriers to entry (Berger et al., 1998). One study with a large sample of mergers and acquisitions found that some M&A categories lowered deposit rates and others raise deposit rates relative to what was predicted by the level of concentration (Simons and Stavins, 1998); while there is another one found that mergers and acquisitions substantially reduced the deposit rates paid by M&A participants, consistent with market power effects of mergers and acquisitions activities (Prager and Hannan, 1999).. B、The motives for and the consequences of non-maximizing wealth. In some cases, international mergers and acquisitions may be desired by stakeholders other than shareholders. Two main stakeholders may play very important role to affect the consolidation decision. Manager of the financial institution may drive the cross-border consolidation due to personal interest, such as personal preferences for compensation, perquisites, power, job security, etc. Government polices may also drive the mergers and acquisitions decisions made by the financial institution. Particularly, in cross-border consolidation, the governments of both target banks and acquiring banks may play a significant role to influence the success of the consolidation.. B.1 Managerial factors. Managers may be able to pursue their own objectives in mergers and acquisition decisions, particularly in banking where corporate control may be relatively weak. In professionally managed financial institutions, entrenched managers may make decisions regarding international mergers and acquisitions based on several reasons. Within these personal motives, three of them are most commonly discussed, including size and management compensation, agency problems, and job security. 20.
(28) According to the Management self- interest hypothesis (or the manager- utilitymaximization hypothesis), if manager utility depends on firm size, risk or managers’ compensation rather than firm’s value, then managers will maximize the firm’s growth, reduce its risk or expropriate the firm rather than maximize shareholder wealth. An early research showed a positive correlation between executive compensation and firm size (Malatesta, 1983). Some more recent studies on compensation in banking generally found positive links between managerial compensation and both firm performance and firm size (Barro and Barro, 1990; Hubbard and Palia, 1995), which is consistent with both efficiency and managerial motives for consolidation. Another study found that CEO compensation rose after bank mergers and acquisition, even if the stock price fell (Bliss and Rosen, 1999). However, some research showed that personal compensation may not be good for cross-border consolidation. Some empirical evidence found that the sensitivity of pay to performance in banking has increased since deregulation (Crawfor, et al., 1995; Hubbard and Palia, 1995), and that pay-performance sensitivity may be greater at large banks (Demsetz and Saidenberg, 1999).. There is evidence that banking organizations may overpay for acquisitions when corporate governance structures are not sufficiently well-design to align managerial incentives with those of owners. According to the hubris hypothesis by Roll (1986), though target firms are correctly valued, managers of bidding firms believe that they are capable of uncovering “bargains”. Therefore, managers often persist in the belief that their own valuation of a target bank is correct, even when confronted with objective information that shows the target banks’ true economic value is lower. This is consistent with the presence of the agency problems. Banks may have agency conflict or control problems when managers hold higher percentage of shares 21.
(29) with higher abnormal return during the time of acquisitions. Some empirical studies showed that abnormal returns at bidder banks are increasing in the sensitivity of the CEO’s pay to the performance of the firm and to the share of outsiders on the board of directors (Allen and Ceboyan, 1991; Subrahmanyam, et al., 1997). The evidence suggests that managers with little pay sensitivity to performance may drive the mergers and acquisitions that do not maximize shareholders’ wealth. In fact, corporate control appears to have improved as intrastate and interstate banking deregulation increased the number of potential acquirers, reduced the market share of poorly run banks and generally improved performance (Schranz, 1993; Hubbard and Palia, 1995; Jayaratne and Strahan, 1996, 1998).. In order to protect managers’ firm capital and to enhancing their job security, some managers may engage in cross-border consolidation that diversity the risk of the institution. Some studies identified diversification of personal risk as a motive behind the decision of professional managers (Amihud and Lev, 1981; Morck, et al., 1990; May, 1995). Managers may also try to prevent their institution from being takeover. One study found that banks in which managers hold a greater share of the stock are less likely to be acquired, consistent with the possibility that managers with large ownership stakes block outside acquisitions to protect their job (Hadlock, et al. 1999). Some managers may try to protect their job by engaging domestic mergers and acquisition, which may fend off hostile takeover or prevent foreign entry by creating institution that are too large to be taken over easily (Berger, et al., 2000). B.2 Government factors. Government and regulation play very important role in mergers and consolidation. Particularly, regulatory in both target banks and acquiring banks 22.
(30) affect seriously on consolidation decisions. Government may influence the consolidation decision through restricting the types of mergers and acquisitions and through approval or disapproval decisions for individual mergers and acquisitions. In some developing countries, in order to protect domestic banks, the entry barriers may be higher for the foreign banks. On the other hand, government may also encourage mergers and acquisitions activities through providing financial assistance during the financial crisis.. Deregulation in major developed countries has increased the number of international mergers and acquisitions. Some empirical evidences suggested that much of the consolidation in U.S. was related to the deregulation, particularly the Riegle-Neal Act (Berger, et al., 1995; Jayaratne and Strahan, 1998). However, the government may take some actions to prohibit part of cross-border consolidation activities. Some studies argued that despite the removal of many of the explicit cross-border entry barriers within the EU, cross-border consolidation of commercial banks in Europe may have been relatively sparse because of differences in the use of paper versus book entry, settlement cycles and methods, and payment systems (Giddy, et al. 1996; White, 1998). One study also found that in some cases, government may block foreign takeovers or permit mergers and acquisitions within the nation for reason of national pride (Boot, 1999).. However, to test all aspects related to international mergers and acquisitions is unpredicted in this paper. In this paper, we only focus our empirical test on two aspects, including profitability and efficiency of acquiring banks involved in international mergers and acquisitions.. 23.
(31) IV、Data and Methodology. A、Data and Sample. The data are drawn from two sources. The data on the number of banks of mergers and acquisitions, the nations of the acquiring banks, and the time the mergers and acquisitions occurred is the database SDC Platinum of Thomson Financial Security Data (2006). The financial statement data, including numbers from balance sheet and income statement, comes from the Mergent Online database, with all numbers translated into the same currency, US dollars (the exchange rate used is that of the year ended reported date).. Besides to compare the profitability and efficiency performance of acquiring banks in short-term, mid-term, and long-term, the regression test is based on testing the major effects that may dominate the profitability and efficiency performance. The data used are 1- year before mergers and acquisitions, the year of mergers and acquisitions, and 1-year after, 3-year after, and 5-year after mergers and acquisitions. The sample also treated the multiple mergers and acquisitions in 1 year by a firm as a single merger. Since the test focuses on acquiring banks, analysis takes data of acquiring and merging firms only before mergers and acquisitions, and uses consolidated financial data after the actions.. The overall sample is composed of banks engaged in horizontal mergers and acquisitions, which means that both parties are commercial banks or bank holding companies, and the sample covers an twelve-year period from 1990-2001. Observations are deleted if any of the following conditions are met: (1) both of the merger partners are from the same nation, (2) either party was not a bank holding company or commercial bank, (3) missing the financial data more than one year 24.
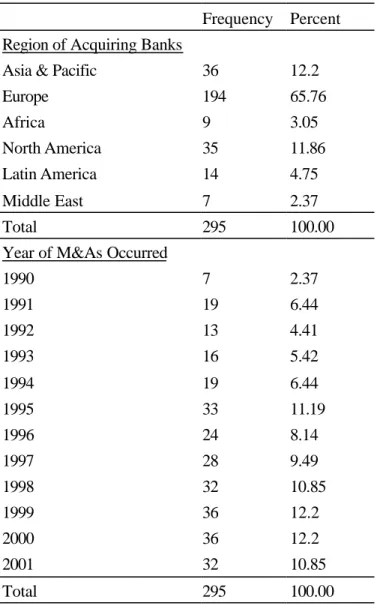
(32) Table 3 Sample characteristics Frequency Percent Region of Acquiring Banks Asia & Pacific. 36. 12.2. Europe. 194. 65.76. Africa. 9. 3.05. North America. 35. 11.86. Latin America. 14. 4.75. Middle East. 7. 2.37. Total. 295. 100.00. 1990. 7. 2.37. 1991. 19. 6.44. 1992. 13. 4.41. 1993. 16. 5.42. 1994. 19. 6.44. 1995. 33. 11.19. 1996. 24. 8.14. 1997. 28. 9.49. 1998. 32. 10.85. 1999. 36. 12.2. 2000. 36. 12.2. 2001. 32. 10.85. Total. 295. 100.00. Year of M&As Occurred. Number of Mergers of An Acquiring bank at the Year of M&As 1. 188. 63.73. 2. 66. 22.37. 3. 19. 6.44. 4. 8. 2.71. 5. 9. 3.05. 6. 2. 0.68. 7. 2. 0.68. 9. 1. 0.34. Total. 295. 100.00. 25.
(33) which would be used in the analysis. This criterion had little effect on the sample size. Application of these criteria resulted in a final sample of 295 observations for the analysis in international mergers and acquisitions, while tests of specific variables may utilize a reduced sample as not all observations report all variables.. The sample basically generated from 37 countries across the world during theperiod from 1990-2001. Table 3 reports the distribution of the sample by 3 different categories, including the location of the acquiring firms, the year of mergers and acquisitions, and the number of mergers and acquisitions of an acquiring bank at the same year. In the terms of regions, Europe ranks first with 194 (65.76%) mergers and acquisitions followed by Asia & Pacific and North America with 36 (12.2%) and 35 (11.86%) mergers and acquisitions prospectively. In terms of the year of acquisition, it reports that the largest number of acquisitions (36) occurred in 1999 and 2000, followed by 33 in 1995, and 32 in 1998 and 2001. B、Operating Performance Approach. The effect of mergers and acquisitions on firm performance is the subject of on going debate, and studies of the question have been growing in number. There are two main approaches used in merger performance studies in banking, one is operating performance approach, and the other one is event study approach.. “Operating. performance”, also called observed performance, observes the financial performance of a firm following a merger or an acquisition; while “Event study” measures the reaction of the stock price of acquirers and targets to a merger or an acquisition announcement.. This paper using operating performance approach to measure the. performance (profit rates) and efficiency (cost ratio) of the acquiring banks after international mergers and acquisitions. 26.
(34) Starting from late 1980s, the increased interest in the OP methodology probably reflected the interest in cost cutting and efficiency in banking industry, particularly, through mergers and acquisitions (Rhoades, 1994). The advantage of the OP studies of focusing on actual observed operating results of a merger rather than the expectations around the announcement date. The general methodology of the operating performance studies is to analyze changes in accounting profit rates or cost ratios, or both, from before merger or acquisition to after. Most of the OP studies compared the performance of merging banks with a control group of non- merging banks, but this study would only compare the performance of acquiring firms before and after mergers and acquisitions.. C、Hypotheses. The main reasons for a bank to merge or acquire another bank are to improve profitability and to enhance efficiency as we mentioned in the literature review section.. There are two basic but major hypotheses in this study.. Hypothesis 1:International mergers and acquisitions in banking industry would improve the profit performance of the acquiring banks.. Hypothesis 2:International mergers and acquisitions in banking industry would enhance the efficiency performance of the acquiring banks. More detail, the main determinants to improve profitability and efficiency are of interests.. There are several possible sources of improvement in the components of. return on assets (ROA) mentioned in hypothesis 1. First is to improve net interest margins (NII/TA). Acquiring banks and merged banks might be able to realize economies of scale in holdings of cash, and in securities held as liquid assets. 27.
(35) Possibility of re-pricing of loans and deposits may improve net interest income and non- interest revenue if acquiring banks become more aggressive to pricing services and products after mergers and acquisitions (Linder and Crane, 1993). The second variable is what just mentioned above, the non- interest revenue to assets (NIR/TA). The non- interest revenue is the operating revenue other than interest revenue. The improvement in operating revenue other than interest income is expected to improve the profitability if other variables remain constant. The last variable is about expenses.. Bank mergers and acquisition potentially reduce non- interest. expense/assets (NIE/TA), which means increase in operating efficiency, by consolidating back office operations and information systems. Mergers and acquisitions may also capture economies of scale in marketing activities and in administrative expenses. Therefore, the following hypothesis is formed:. Hypothesis 3: Increase in net interest income, non-interest revenue, and reduction of non-interest expenses ratio, which is the improvement of efficiency, will improve the profitability of acquiring banks after mergers and acquisitions in international mergers and acquisitions.. In hypothesis 2, we hypothesize that mergers and acquisitions lead to better efficiency performance of acquiring banks, particularly at the part of cost saving. Several possible items may dominate the enhancement of the efficiency. First one is administrative expense. One of most important component of expenditure of a bank is the personnel salaries and other administrative cost, including back-office expenses. In order to capture the economies of scale, the acquiring banks would like to reduce the ratio of administrative cost to total asset (ADM/TA), which means the efficiency of personnel and administrative level are improved. Second variable is the ratio of 28.
(36) loans to assets (LOAN/TA). A high level of loans would seem to indicate aggressive behavior by the banks and a strong market penetration with important established customer relationship (Hannan and Rhoades, 1987). This situation may lead to better return. However, the higher the ratio of loans to assets, banks may incur greater expenses maintaining a portfolio of loans than a portfolio of securities. The last variable is about non- interest revenue. After mergers and acquisitions, the banks may expect attract more customers to consume their products and services. With the same amount of total asset, the higher the non- interest revenue indicates the better the efficiency. As the result, the following hypothesis is formed:. Hypothesis 4: Reduction of administrative costs, increase in non-interest revenue and loans will improve the efficiency of acquiring banks after mergers and acquisitions in international mergers and acquisitions. D、Feasible Generalized Least Squares Regression Model. Cross-sectional time-series regression methods are used in the empirical design of this study. Due to the potential of the heteroskedasticity, the ordinary least squares (OLS) design is rejected for this study. Instead, the efficient, unbiased, consistent estimator, Feasible Generalized Least Squares (FGLS) regression model, is used in this study since the model places minimal restrictions on the function leads to more powerful results.. Heteroskedasticity may be considered the rule rather than the exception in the cross-sectional data involving heterogeneous units or groups (Gujarti, 1995). The main source of heteroskedasticity in this study is that the raw data has the large difference among the size of observation in each of observed year and in each sample. 29.
(37) Even though heteroskedasticity does not diminish the unbiasedness and consistency property of OLS estimators, these estimators are no longer of minimum variance or efficient. Therefore, they have the potential of generating misleading conclusions to the hypothesis test.. The Breusche-Pagan (1980), Cook and Weisberg and White general tests are employed to confirm the presence of heteroskedasticity. In addition, the Wald test for group-wise heteroskedasticity in cross-sectional time-series FGLS regression model is applied following. All test results indicate that there is heteroscedasticity at 0.01-level significance (Greene, 1997). In response, in order to develop effective estimates in this study, Feasible Generalized Least Squares is used in this study to correct for heteroscedasticity. E、Regression and Variables. Two set of tests are using in this study.. One is using t-test to compare the. difference of profitability and efficiency between one year prior and one-year, three-year, and five- year post merger and acquisition deals.. E.1 T-test. Return on assets (ROA), which is the ratio of net income (after tax) to average assets is the measurement used in this study to analysis the performance of profitability. This is an indicator of profitability and a good overall indicator of a banking organization’s performance (King, 1993). This ratio illustrates the ability of a firm to generate profits from the assets at its disposal. An alternative measurement to test profitability is retur n on equity (ROE), which is the ratio of net income to equity.. However, since the measure is design to reflect the return to owners’ 30.
(38) investment and it has a disadvantage that the denominator (equity) may vary substantially across firm s due to the regulation of the home countries and the management, 5 ROE would not be used in this study.. The ratio of non-interest operating expenses to assets is used to test the efficiency of the acquiring banks after mergers and acquisition. This measurement accounts for all operating expenses, such as personnel, bank-office operations, and branches, that should be directly affected by the cost savings resulting from bank mergers (Rhoades, 1998), especially horizontal mergers and acquisitions in this study. In fact, many studies are of special interest to this ratio. An alternative measurement, ratio of non- interest expenses to operating revenue, is also commonly used. The reason of using expenses ratio rather than using expenses in dollar value is because the reduction of expenses in dollar value would not indicate an efficiency gain if assets were reduced proportionately, which would simply reflect a shrinking firm.. The t-test is used in this study to investigate whether there is any significant difference in ROA and no n- interest expenses to assets, the measurements of profitability and efficiency, of acquiring banks from one-year prior to mergers and acquisitions to one-year, three- year, and five-year after mergers and acquisitions. In hypothesis 1 and 2, it is expected to have significant increase in ROA and reduction of non- interest expenses to assets, especially long-run after merger and acquisition deals.. E.2 FGLS Regression Model. There are two set of regression equations are tested in the study. One is to capture the major effects of profit performance of the acquiring banks prior and post. 5. “while capturing the return to owners is an attractive feature of this measure, a disadvantage … .” (Rhoades, 1998) 31.
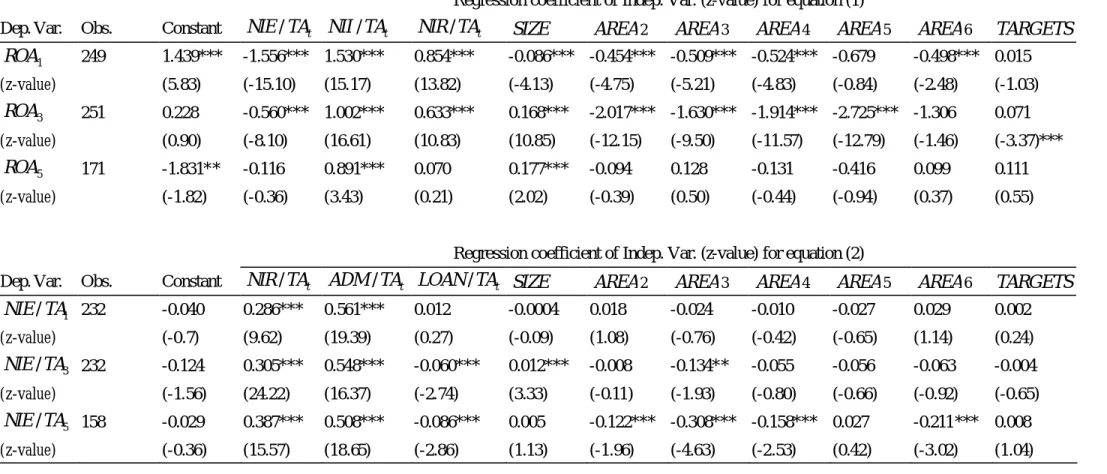
(39) mergers and acquisitions. The main performance measurement is the change of ROA.. The second test is using change of expense ratio (ratio of non- interest. expenses to assets) to determinate major effects which may improve efficiency performance of acquiring banks before and after mergers and acquisitions.. The first model is to test the determinants to improve the profitability. The regression model is used to incorporate variables reflecting the extent of operating figures and a number of control variables. The estimation of FGLS regression model is in the following form: ROAt = β1 + β 2 NIE / TAt + β 3 NII / TAt + β 4 NIR / TAt +. β 5 ln TA + β 6 AREA + β 7TARGETS + ε t. (1). The dependent variable is calculated as the change in ROA for one-year before and one- year after, one-year before to three-year after, and one-year before to five-year after the mergers and acquisitions.. In order to test major indicators to improve the profitability performance through mergers and acquisitions, three independent variables identified in hypothesis 3 are used. The increase in net interest margin (NII/TA) is expected to improve the profitability before and after mergers and acquisitions. The second variable is non- interest revenue to assets (NIR/TA). The non-interest revenue to assets is to test how existed assets to generate revenues other than interest income. The increase in this variable is predicted to improve the profitability through action of mergers and acquisitions.. The variable of non- interest expenses to total assets (NIE/TA) presents. the expenses other than interest paid. The reduction of this expense ratio is likely to enhance the ROA of acquiring banks before and after deals. These three independent variables are expressed as change of each variable from one-year before 32.
(40) to one-year after, three-year after, and five-year after the mergers and acquisitions.. The independent variables are included to control major factors likely to influence bank performance. A firm size variable (SIZE), use the log of the total assets, at the year of mergers and acquisitions is included to account for possible efficiencies associated with size, and to control for the certain size of the bank at the year of mergers and acquisition. The reason to take log of the total assets is that there are huge differences of dollar value of the total assets among different samples. Most of studies used the firm size one- year prior mergers and acquisition as the control variable. There are few reasons not to use it in this study. First, analysis of most studies focuses on the combined data both before and after mergers and acquisition. Since this study focuses on acquiring banks and only obtains the data of acquiring companies, the figures would not be accurate to use total assets one-year before deal. Second, since many banks have continued some other deals of mergers and acquisitions after observed year, it would be difficult to separate the consolidated financial data of acquiring firms of each deal. Therefore, the firm size, book value of total asset, of the observed year is used as a control variable. The dummy variable of the area (AREA) acquiring banks located is another control variable. This variable accounts for the fact that each areas or continents may have special culture, economic environment, and government regulations, and all these factors may influence the performance of the bank. The number of targets the acquirer purchased in the observed year (TARGETS) is also included.. The second model is to test the determinants to improve the efficiency. The regression model is used to incorporate variables generating non-interest expense figures and a number of control variables. The estimation of FGLS regression model is in the following form: 33.
(41) ROAt = β1 + β 2 NIR / TAt + β 3 ADM / TAt + β 4 LOAN / TAt +. β 5 ln TA + β 6 AREA + β 7TARGETS + ε t. (2). The dependent variable is calculated as the change in expenses ratio, ratio of non- interest expenses to assets (NIE/TA), for one-year before and one-year after, one-year before to three- year after, and one-year before to five- year after the mergers and acquisitions.. Three possible determinants mentioned in hypothesis 4 are tested through regression model. First one is administrative expense ratio (ADM/TA). The reduction of administrative expenses ratio is estimated to improve the efficiency level of acquiring banks after mergers and acquisitions. The ratio of loans to assets (LOAN/TA) is another variable used. A sign on this variable is not predicted since level of loan activity may present the aggressiveness of the banks to increase return, at the same time, the expenses may increase to maintain the portfolio. The last variable is non-interest revenue ratio. The increase in this ratio is expected to enhance the efficiency performance. These three independent variables are expressed as change of each variable from one- year before to one-year after, three- year after, and five-year after the mergers and acquisitions. The same control independent variables as equation (1), the firm size (SIZE), the area the acquiring banks located (AREA), and the number of targets acquirer purchased at the year of mergers and acquisitions (TARGETS) are used to control the major factors which may influence the bank performance. Table 4 presents detail definitions of variables used in regression.. Most of independent variables used in both equation (1) and (2) are ratio relative to assets rather than the absolute value. This is because the change in absolute value of each variable may not reflect the real situations. The fluctuation of total assets or 34.
(42) other variables may directly influence the administrative costs, net interest income, or other financial data. For instance, the reduction of administrative cost may not indicate the efficiency improvement since some branches may be sold out to cause the reduction of total assets. Also, since the data obtained in this study are consolidated financial data after mergers and acquisitions and financial data of acquiring firms only before mergers and acquisitions, comparison of each variable by absolute value may mislead the result. In order to compare the financial data of acquiring banks before and after mergers and acquisitions at the same standard with more accurate result, the ratio is used in this study.. Table 4 Variable Definitions Variables. ROAt NIE / TAt NII / TAt NIR / TAt ADM / TAt LOAN / TAt. SIZE AREA TARGETS. Definitions Return on assets, net income/total assets, change from one year prior to t year post mergers and acquisitions Non-interest expenses over total assets, change from one year prior to t year post mergers and acquisitions Net interest income over total assets, change from one year prior to t year post mergers and acquisitions Non-interest revenue over total assets, change from one year prior to t year post mergers and acquisitions Administrative costs over total assets, change from one year prior to t year post mergers and acquisitions Loans to total assets, change from one year prior to t year post mergers and acquisitions Take log of total assets at the year of mergers and acquisitions Dummy variable indicates the continent the acquiring banks located Dummy variable indicates numbers of targets purchased by acquirer at the year of mergers and acquisitions. 35.
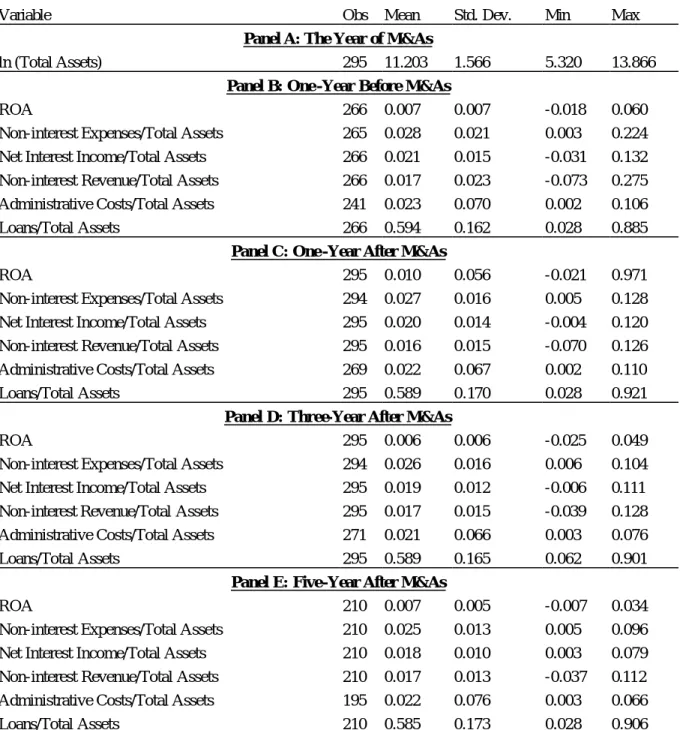
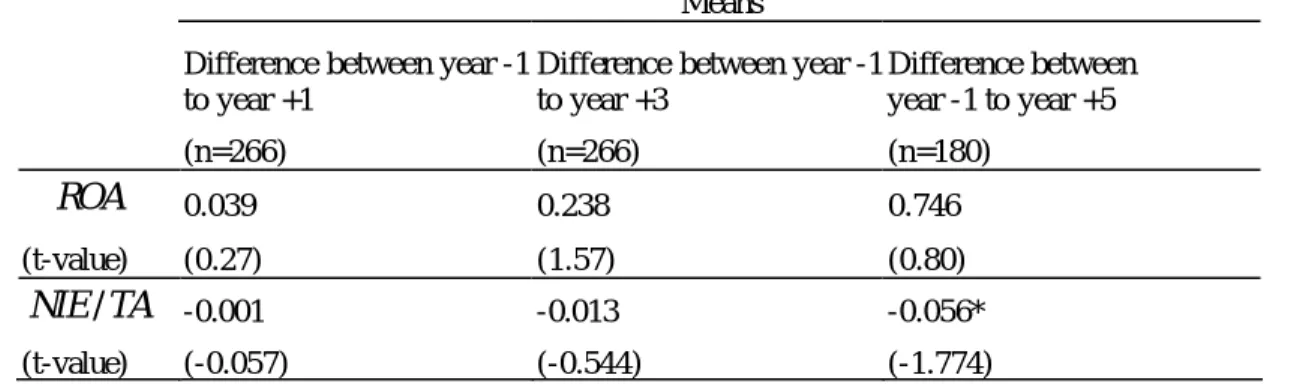
(43) V、Empirical Result. A、Results from Descriptive Statistics and t-test. Because of the emphasis on improvement of profitability and reductions in non- interest expenses achievable by international mergers and acquisitions, some descriptive data on ROA and non- interest ratios for acquiring firms are of interest. Table 5 shows the descriptive statistics of the explanatory variables.. For ROA, it is. getting higher one- year after mergers and acquisitions compare to one- year before the actions, but ROA declines slightly at the third-year, and it is even lower than one-year before the deals. At the fifth year, it is still lower than one year before the actions even though it improved from the third year. This may indicate that the profitability may only improve right after mergers and acquisitions, but it would not improved afterward. For the expenses ratio, non- interest expenses to assets, it shows the trend that the ratio is getting lower gradually. This may indicate that the efficiency may be gradually improved year by year. In order to test the significance of differentperformance in each variables, t-test is used to investigate whether efficiency and profitability of consolidated firms are improved one-year, three-year, and five-year after mergers and acquisitions comparing to the acquiring and merging banks one- year before the deals. Table 6 presents the differences of ROA and expenses ratio before and after mergers and acquisitions. It can be found that ROA, the indicator of overall performance particularly the profitability of the acquiring or merged banks, improved in short-term after mergers and acquisition (one-year after), but slightly decreased at the mid-term (three-year) and long-term (five- year) after mergers and acquisitions. However, from the results of t-test, there is no significant profitability improvement in short-term, mid-term and long-term. On the other hand, the expense ratio, the ratio of non-interest expenses over total assets, is gradually 36.
(44) Table 5 Descriptive Statistics of Explanatory Variables Variable. Obs Mean Std. Dev. Panel A: The Year of M&As ln (Total Assets) 295 11.203 1.566 Panel B: One -Year Before M&As ROA 266 0.007 0.007 Non-interest Expenses/Total Assets 265 0.028 0.021 Net Interest Income/Total Assets 266 0.021 0.015 Non-interest Revenue/Total Assets 266 0.017 0.023 Administrative Costs/Total Assets 241 0.023 0.070 Loans/Total Assets 266 0.594 0.162 Panel C: One -Year After M&As ROA 295 0.010 0.056 Non-interest Expenses/Total Assets 294 0.027 0.016 Net Interest Income/Total Assets 295 0.020 0.014 Non-interest Revenue/Total Assets 295 0.016 0.015 Administrative Costs/Total Assets 269 0.022 0.067 Loans/Total Assets 295 0.589 0.170 Panel D: Three-Year After M&As ROA 295 0.006 0.006 Non-interest Expenses/Total Assets 294 0.026 0.016 Net Interest Income/Total Assets 295 0.019 0.012 Non-interest Revenue/Total Assets 295 0.017 0.015 Administrative Costs/Total Assets 271 0.021 0.066 Loans/Total Assets 295 0.589 0.165 Panel E: Five-Year After M&As ROA 210 0.007 0.005 Non-interest Expenses/Total Assets 210 0.025 0.013 Net Interest Income/Total Assets 210 0.018 0.010 Non-interest Revenue/Total Assets 210 0.017 0.013 Administrative Costs/Total Assets 195 0.022 0.076 Loans/Total Assets 210 0.585 0.173. Min. Max. 5.320. 13.866. -0.018 0.003 -0.031 -0.073 0.002 0.028. 0.060 0.224 0.132 0.275 0.106 0.885. -0.021 0.005 -0.004 -0.070 0.002 0.028. 0.971 0.128 0.120 0.126 0.110 0.921. -0.025 0.006 -0.006 -0.039 0.003 0.062. 0.049 0.104 0.111 0.128 0.076 0.901. -0.007 0.005 0.003 -0.037 0.003 0.028. 0.034 0.096 0.079 0.112 0.066 0.906. getting lower from one-year after to five-year after mergers and acquisition. However, from the t-test, there is no significant enhancement of efficiency in the short-term and mid-term after mergers and acquisitions. It is significant that acquiring banks has the efficiency improvement in long run after mergers and acquisition at the confident level of 90%.. 37.
數據
相關文件
3 recommender systems were proposed in this study, the first is combining GPS and then according to the distance to recommend the appropriate house, the user preference is used
The aim of this study is to develop and investigate the integration of the dynamic geometry software GeoGebra (GGB) into eleventh grade students’.. learning of geometric concepts
The aim of this study is to investigate students in learning in inequalities with one unknown, as well as to collect corresponding strategies and errors in problem solving..
This paper aims to study three questions (1) whether there is interaction between stock selection and timing, (2) to explore the performance of "timing and stock
Methodologies used in this study comprise two parts, the first part is questionnaires, which investigate customers’ assessment of the quality and satisfaction of service
The purpose of this study is to investigate the researcher’s 19 years learning process and understanding of martial arts as a form of Serious Leisure and then to
This study is aimed to investigate the current status and correlative between job characteristics and job satisfaction for employees in the Irrigation Associations, by
In this study, Technology Acceptance Model (TAM 2) is employed to explore the relationships among the constructs of the model and website usage behaviors to investigate
