國 立 交 通 大 學
生物科技研究所
碩士論文
重組金屬乙炔苯酸紫質之人工肌紅蛋白系統對於光激發電
子轉移機制的研究與其在生物性太陽能電池的應用
Photo-Induced Electron Transfer Study of Free-base and
Metallo Carboxyphenylethynyl Porphyrins Based Artificial
Myoglobin Systems and Their Biosolar Cell Application
研究生:胡禕庭
指導教授:吳東昆 博士
重組金屬乙炔苯酸紫質之人工肌紅蛋白系統對於光激發電
子轉移機制的研究與其在生物性太陽能電池的應用
Photo-Induced Electron Transfer Study of Free-base and
Metallo Carboxyphenylethynyl Porphyrins Based Artificial
Myoglobin Systems and Their Biosolar Cell Application
研究生:胡禕庭 Student: Yi-Ting Hu
指導教授:吳東昆 博士 Advisor: Prof. Tung-Kung Wu Ph.D
國 立 交 通 大 學
生物科技研究所
碩士論文
A Manuscript of Dissertation
Submitted to Department of Biological Science and Technology College of
Biological Science and Technology
National Chiao Tung University
in partial Fulfillment of the Requirements for
the Degree of Master of Philosophy
in
Biological Science and Technology Hsinchu,
Taiwan, Republic of China
重組金屬乙炔苯酸紫質之人工肌紅蛋白系統對於光激發電子轉移機制
的研究與其在生物性太陽能電池的應用
中文摘要
肌紅蛋白是一個很適合用來了解光物理以及探討光催化電子轉移機制的生物系統,因為肌 紅蛋白的血色素基口袋可以有效穩定中間輔基的氧化或還原態。而將人工合成的輔基重組進入 肌紅蛋白中是一個嶄新的方式為蛋白質注入新的功能。為了模擬光合作用的機轉,我們設計一 個 更 簡 單 的 系 統 來 模 擬 光 合 作 用 。 我 們 將 一 系 列 不 同 金 屬 的 光 敏 劑 metallo-5-(4-carboxy-phenylethynyl)-10,20-biphenylporphines (簡稱 MtPE1)重組到肌紅蛋白中防 止自身聚集的現象以及延長在激發態的生命期。我們進行紫外光-可見光光譜、循環伏安法、 螢光光譜、時間-解析螢光光譜、光化學還原法、光電流等的研究。在螢光生命期的比較, ZnPE1-Mb 以及 H2PE1-Mb 在緩衝溶液中的生命期比起在有機溶劑四氫呋喃 (THF) 中的ZnPE1、H2PE1 有些微的增加。光化學還原是利用以肌紅蛋白重組 MtPE1 做為光敏劑,TEA
做為電子提供者,NADP+為電子接受者所組成的簡單系統來比較不同金屬 MtPE1 以及
MtPE1-Mb 的轉換效率。在將 NADP+還原成NADPH 的效率上,以 H2PE1 與 ZnPE1 重組的肌
紅蛋白相對於只以H2PE1 與 ZnPE1 為光敏劑的轉換效率來說,約可提升兩倍的效率,我們推
測蛋白質能有效穩定光敏劑的激發態並延長處於激發態的時間而提高轉換效率。我們也利用循
環伏安法確認重組之 MtPE1-Mb 具有和 TEA 及 NADP+ 可適當轉移電子的能階。最後,也試
著建構一個以 MtPE1-Mb、TiO2 導電玻璃、電解液組合成能將光能轉成電能的生物太陽能電
Photo-Induced Electron Transfer Study of Free-base and
Metallo Carboxyphenylethynyl Porphyrins Based Artificial
Myoglobin Systems and Their Biosolar Cell Application
Abstract
Myoglobin (Mb) is a suitable model to understand the photophysical properties and photoinduced electron transfer mechanism, because of the heme pocket of Mb can stabilize the reduced and oxidized state of the prosthetic group. Reconstitution of an artificial prosthetic group into apo-myoglobin (apo-Mb) is a unique method for introducing a new chemical function into the protein. To mimic the function of photosynthetic system, we design a simple system. A series of different metallo-5-(4-carboxy-phenylethynyl)-10, 20-biphenylporphines, denoted as MtPE1(used as photo-sensitizers) were reconstituted with apo-Mb to avoid self-aggregation and extend the lifetime of excited state. The photophysical properties of reconstituted Mb were examined by UV-Vis, CV, fluorescence spectra, time-resolved fluorescence spectroscopy, photochemical reduction, and photocurrent study. Fluorescence decay profiles of ZnPE1-Mb and H2PE1-Mb showed slightly
increase by comparing with ZnPE1 and H2PE1 in THF. Photochemical reduction of nicotinamide
adenine dinucleotide phosphate (NADP+) was studied by using MtPE1 reconstituted myoglobin (MtPE1-Mb) as a photosensitizer, and triethanolamine (TEA) as a sacrificial donor. This simple model system can let us to compare the conversion efficiency of MtPE1 and MtPE1-Mbs. H2PE1-Mb and ZnPE1-Mb exhibited 2-folds of photo-induced electron transfer efficiency than
H2PE1 and ZnPE1 for converting NADP+ to NADPH. The results showed that MtPE1 reconstituted
with apo-Mb can stabilize the excited state and increase the conversion efficiency. We also confirmed that MtPE1-Mb have well-matched energy level of TEA and NADP+ by CV analysis. At last, we try to combine MtPE1-Mb, TiO2 film, and electrolyte to construct a biosolar cell with solar-electric
謝誌
(Acknowledgement)首先,要感謝我的指導教授-吳東昆博士,在實驗的邏輯及觀念上給我許多
啟發,以及給予我們這麼充裕的設備以及研究環境,在這兩年使我了解科學所要
的堅持,也許在研究的路上並不是一帆風順,經驗的累積是無形的財富。除此之
外,十分感謝李耀坤老師、刁維光老師、林敬堯老師、鄭建中老師在百忙之中撥
空參加學生我的口試以及審定論文,使我的論文更為完整。
此外我要感謝帶我的學長豪哥,這兩年在我實驗上的幫忙以及鼓勵真的讓我
獲益良多。程翔以及裕國學長總能在我實驗低潮時給我鼓勵,以及感謝實驗室的
博班學長姐們,媛婷學姊、晉源、小紅、文鴻、Mili 在實驗上以及生活上的幫忙
以及指教。感謝已畢業的學長姐,宏城、宏明、小高、文祥、采婷、小妹、大景、
皓宇、文瑄學姊在實驗上的細心指教。而一起打拚兩年的同學天昶、育勳、亦諄
有你們一起砥礪彼此,有你們真好!也感謝學弟妹奕齊、青山、小花、靜婷有你
們實驗室歡樂許多,也感謝專題生,孟儒、俞靜,也感謝合作實驗室的學長姐,
駱立揚學長、德茹學姊、羅振夫學長在實驗上的幫忙,有大家的陪伴使我的實驗
室多采多姿,也才能順利完成論文以及研究。
最後要感謝我家人的支持與鼓勵,你們永遠是我受挫折時的避風港,有你們
的支持與鼓勵是我堅持下去的動力來源,有你們我才能順利完成學業,邁向下個
階段,在此,謹以此論文獻給他們。
Table of Contents
中文摘要……….….……….I
Abstract………...……… II 謝誌(Acknowledgement) ………..………..……….……….III
Table of Contents……….IV Table of Figures ………VI
1. Introduction ... 1
1.1 The global energy crisis ... 1
1.2 Techniques for converting sunlight into electricity ... 2
1.3 Natural photosynthesis mechanisms ... 4
1.3.1 Bacterial photosynthesis -Purple bacteria ... 4
1.3.2 Plant photosynthesis ... 6
1.3.3 The importance of protein scaffold in photosystem ... 8
1.4 Artificial photosynthesis ... 8
1.5 Biosolar cell ... 9
1.6 Myoglobin ... 11
1.6.1 Why is myoglobin? ... 13
1.6.2 Pigment (MtPE1) ... 13
1.7 The application of myoglobin in electron transfer study. ... 14
1.7.1 Myoglobin based triads ... 14
1.7.2 Photochemical reduction of NADP+ by Zn-Mb as simple model of photosystem Ι ... 18
2. Specific aims ... 19
2.1 Reconstitution of MtPE1 with wild-type apo-Mb ... 19
2.2 Optic assay of reconstituted MtPE1-Mb (UV-Vis, fluorescent and TCSPC) ... 20
2.3 Electrochemistry assay of reconstituted MtPE1-Mb (CV) ... 20
3. Experimental materials and procedures ... 23
3.1 Experimental materials ... 23
3.2 Experimental apparatus ... 24
3.3 Obtain wild type apo-Mb from myoglobin by Methyl ethyl ketone method ... 25
3.4 Reconstitution of apo-Mb with MtPE1 ... 25
3.5 Steady-state spectral measurements ... 26
3.6 Picosecond fluorescence decays ... 26
3.7 CV analysis and differential pulse voltammetry (DPV) ... 26
3.8 Photoirradiation experiment ... 27
3.9 Photoelectrochemical measurements ... 27
4. Result and discussion ... 28
4.1 Wild type apo-Mb purification ... 28
4.2 UV-Vis and fluorescence analysis ... 30
4.2.1 UV-Vis analysis results of reconstituted MtPE1-Mbs ... 30
4.2.2 Fluorescence analysis results ... 37
4.3 Picosecond fluorescence decays ... 41
4.4 Cyclic voltammetry measurement ... 45
4.4.1 Analyzed with cyclic and differential pulse voltammetry (CV and DPV) ... 46
4.4.2 Energy level of electron donor and acceptor ... 51
4.5 Phototriggered chemical reduction result of MtPE1 and MtPE1-Mbs ... 52
4.6 Fluorescence analysis of ZnPE1-Mb before and after irradiation ... 70
4.7 Photocurrent assay result ... 72
5. Conclusion and future perspectives ... 77
6. References ... 80
Table of Figures
Figure 1-1 About half of the incoming solar energy reaches the earth’s surface.1 ... 2
Figure 1-2 Major techniques for converting sunlight into electricity (Source: Yole developpement) ... 2
Figure 1-3 The working principle of DSSC. Photoexcitation of the sensitizer (S) is followed by electron injection into the conduction band of an oxide semiconductor film. The redox system regenerates the dye molecules, and the dye molecules are regenerated at the counter electrode by electrons passed through the load.
Potentials are referred to the normal hydrogen electrode (NHE).3 ... 3
Figure 1-4 Photoexcited electron transfer in the bacterial photosynthetic unit. LH-II contains two types of BChls: B800 (dark blue) and B850 (green), which absorb at 800 nm and 850 nm. BChls in LH-I absorb at 875 nm and labeled B875 (green). PA and PB refer to the RC special pair, and BA, BB refer to the accessory BChls in
the RC. The figure demonstrates the coplanar arrangement of the B850 BChl ring in LH-II, the B875 BChl ring of LH-I, and the RC BChls PA, PB, BA, BB.4 ... 5
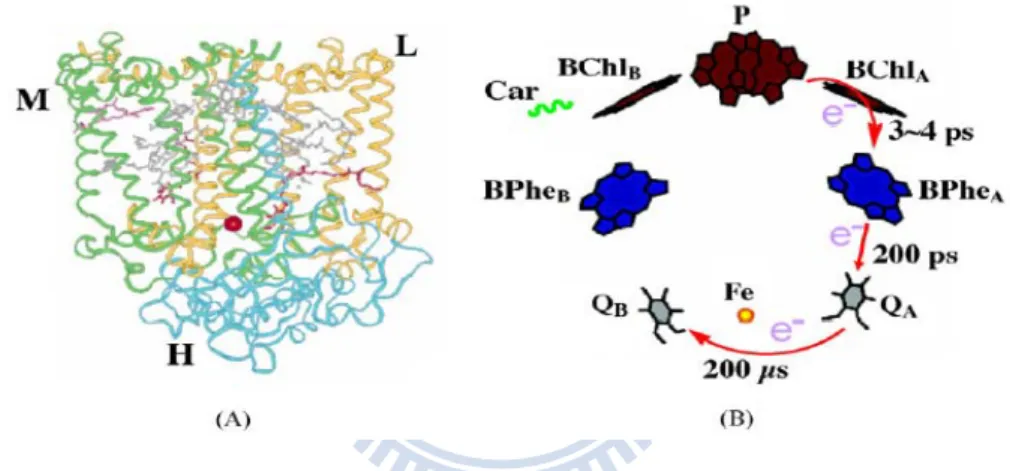
Figure 1-5 (A) Three-dimensional structure of RC from Rhodobacter sphaeroides (Rb. S). The L, M and H subunits are shown as orange, green and blue ribbons. (B) Schematic of the cofactors arrangement and the
photo-induced ET present in RC.5 ... 6
Figure 1-6 Light-dependent reactions of photosynthesis at the thylakoid membrane. ... 8
Figure 1-7 Schematic working principle of the RC based bio-photoelectric cell. The photoanode is ITO/WO3–TiO2/RC film and Pt as the counter-electrode. The electrolyte is pH 8.0 Tris–HCl buffer
containing 8 mM sodium dithionite. a1: Vb of WO3, a2: Cb of WO3, b1: Vb of TiO2, b2: Cb of TiO2, c1:
PBPheQAFe2+QB, c2: P*BPheQAFe2+QB, c3: P+BPhe−QAFe2+QB, c4: P+BPheQA−Fe2+QB, c5:
P+BPheQ
AFe2+QB−.13 ... 10
Figure 1-8 Illustration of the Phe-RC/WO3–TiO2 PE and photo-induiced ET. Cb, conduction band; Vb, valence
band; P, BChl dimmer; BPhe, bacteriopheophytin; Phe, pheophytin; QA, the primary quinone; QB, the
Figure 1-9 Crystal structure of myoglobin and the prothetic group, heme. ... 11
Figure 1-10 Schematic representation of myoglobin modifications. An artificial prothetic group inserted into apomyoglobin. ... 12
Figure 1-11 Structural diagram of PE1 porphyrins. ... 13
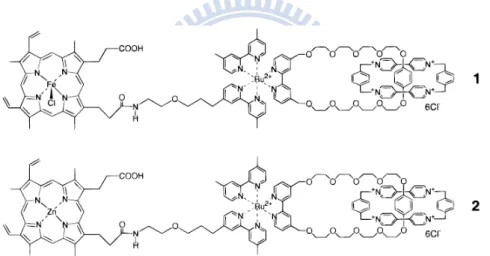
Figure 1-12 Chmical structure of (1) (FeIIIOH
2)-Ru2+-BXV4+ and (2) (Zn)-Ru2+-BXV4+. The structure was
composed by donor (metalo-proporphyrin)-sensitizer(Ru(bpy)3)-acceptor(cyclobis(paraquat-p-phenylene)
BXV4+).24 ... 14
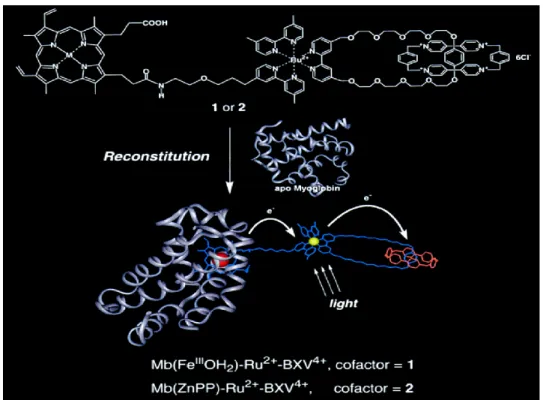
Figure 1-13 Schematic illustration of the reconstitution if 1 and 2 with apo-Mb to afford the myoglobin-based triads, Mb(FeIIIOH
2)-Ru2+-BXV4+ and Mb(Zn)-Ru2+-BXV4+.24 ... 15
Figure 1-14 (a) Energetics and selected pathways for Mb(FeIIIOH
2)-Ru2+-BXV4+ in buffer solution after excitation
to the Ru(bpy)3 excited state. The energy of the excited Ru(bpy)3 component was calculated from the
absorption and emission spectra of catenane 5. The energies of the various charge-separated states were estimated from the corresponding redox potentials of models for the components of
Mb(FeIIIOH
2)-Ru2+-BXV4+. The energy levels are not corrected for any Coulombic stabilization of the
intermediates. (b) Energy levels of the locally excited state of the Ru2+(bpy)
3 moiety and the hypothetical
ion-pair states of Mb(Zn)-Ru2+-BXV4+ and the pathways available for their interconversion. For
comparison purpose, the excited states of ZnPP are not present.24 ... 16
Figure 1-15 UV–visible spectral change for 10 mM of Zn–Mb, 1 M of TEA, and 1 mM of NADP+ in 10mM of
phosphate buffer (pH 9.0). (a) Before irradiation. (b) After 3.5 h of irradiation with visible light (λ > 390 nm) at an intensity of 2.8 mW. Following the irradiation, spectra were measured after 1 (c), 2 (d), 3 (e), 6 (f), and 9 (g) days in the dark under an atmosphere of N2. ... 18
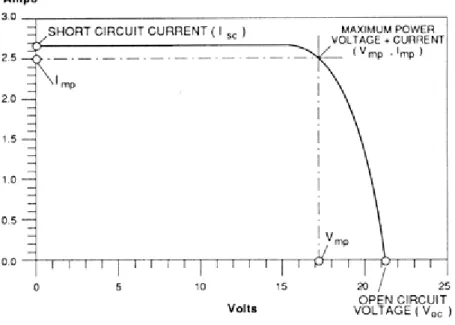
Figure 2-1 A typical current-voltage curve. This maximum current is called the short circuit current, abbreviated Isc. When the module is shorted, the voltage in the circuit is zero. Conversely, the maximum voltage is
produced when there is a break in the circuit. This is called the open circuit voltage, abbreviated Voc.
These two extremes in load resistance, and the whole range of conditions in between them, are depicted on a graph called a I-V (current-voltage) curve. Current, expressed in amps, is on the vertical Y-axis. Voltage, in volts, is on the horizontal X-axis ... 21
Figure 4-1 UV-Vis results : To confirm that heme has been removed by MEK method. ... 29
Figure 4-2 SDS-PAGE result: To confirm apo-Mb in each steps (a) Lane 1: Apo-Mb (b) Lane 2: commercial myoglobin (c) Lane 3: Apo-Mb before dialysis (d) Lane 4: Apo-Mb after dialysis. ... 29
Figure 4-3 Absorption spectra of ZnPE1-Mb in KPi solution with B (Soret) and Q bands. ... 30
Figure 4-4 Normalized steady-state absorption spectra of H2PE1 in THF, KPi buffer and reconstituted with
apo-Mb in KPi. ... 32
Figure 4-5 Normalized steady-state absorption spectra of CoPE1 in THF, KPi buffer and reconstituted with apo-Mb in KPi. ... 32
Figure 4-6 Normalized steady-state absorption spectra of NiPE1 in THF, KPi buffer and reconstituted with apo-Mb in KPi. ... 33
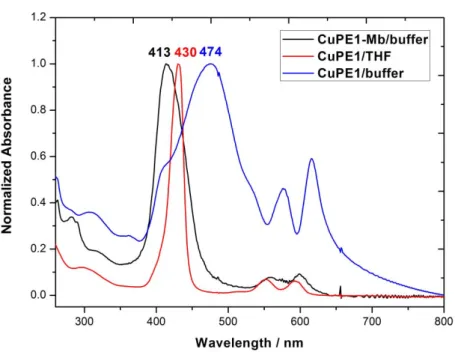
Figure 4-7 Normalized steady-state absorption spectra of CuPE1 in THF, KPi buffer and reconstituted with apo-Mb in KPi. ... 33
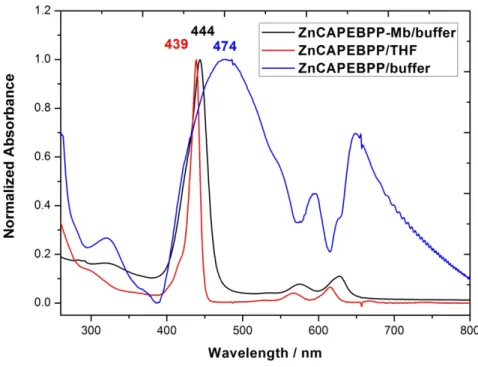
Figure 4-8 Normalized steady-state absorption spectra of ZnPE1 in THF, KPi buffer and reconstituted with apo-Mb in KPi. ... 34
Figure 4-9 The emission spectra of H2PE1 and MtPE1 (Co, Ni, Cu, Zn) in THF. ... 37
Figure 4-10 The steady-state emission fluorescence spectra of MtPE1 by exciting at 435 nm. (a) H2PE1 (b) CoPE1
(c) NiPE1 (d) CuPE1 (e) ZnPE1 ... 38
Figure 4-11 The emission spectra of 2.5 μM MtPE1-Mb in 100 mM Kpi. ... 39
Figure 4-12 The steady-state emission fluorescence spectra of MtPE1-Mb by exciting at 435 nm. (a)H2PE1-Mb
(b)CoPE1-Mb (c)NiPE1-Mb (d)CuPE1-Mb (e)ZnPE1-Mb ... 40
Figure 4-13 The relationship between protein concentration and fluorescence intensity in 100 mM KPi buffer. Obtain fluorescence intensity at λ =630nm (Co, Ni. Cu, Zn) and λ =668 nm (H) with excitation at λ =435
nm. ... 42
Figure 4-14 Picosecond fluorescence transients of reconstituted MtPE1-Mb in buffer solution with λex = 435 nm at λem = 630 nm (Co, Ni, Cu, Zn) and λem = 668 nm (H2). ... 43
Figure 4-15 Chemical structure of DDAB ... 45
Figure 4-16 Cyclic and differential pulse voltammetry (CV and DPV) analysis for wild type Myoglobin ... 47
Figure 4-17 C-V and differential pulse for H2PE1-Mb ... 48
Figure 4-18 C-V and differential pulse for CoPE1-Mb ... 48
Figure 4-19 C-V and differential pulse for NiPE1-Mb ... 49
Figure 4-20 C-V and differential pulse for CuPE1-Mb ... 49
Figure 4-21 C-V and differential pulse for ZnPE1-Mb ... 50
Figure 4-22 CV analysis of (A) 2.5 mM NADP+ in 10 mM KPi (B) 1 M TEA in 10mM KPi ... 51
Figure 4-23 The energy diagram of TEA, NADP+, H 2PE1-Mb, NiPE1-Mb, CuPE1-Mb, ZnPE1-Mb. ... 52
Figure 4-24 Absorbance change in the solution containing 10 μM (A) H2PE1-Mb (B) CoPE1-Mb (C) NiPE1-Mb (D) CuPE1-Mb (E) ZnPE1-Mb, 1 M TEA , and 5 mM NADP+ in 100 mM KPi buffer after 5 hours irradiation. 55 Figure 4-25 Absorbance change in the solution containing (A)10 μM apo-Mb (B) no photosensitizer, 1 M TEA , and 5 mM NADP+ in 100 mM KPi buffer after 5 hours irradiation. ... 56
Figure 4-26 Absorbance change for three kinds of condition: MtPE1-Mb/TEA/NADP+, MtPE1-Mb/TEA/NADP+ without irradiation and kept in the dark for 5 days, MtPE1-Mb/TEA/NADP+ irradiated 5 h and kept in the dark for 5 days. ... 57
Figure 4-27 Absorbance change at 340 nm in the solution containing 10 μM of (a) H2PE1-Mb (b) CoPE1-Mb (c) NiPE1-Mb (d) CuPE1-Mb (e) ZnPE1-Mb, 1 M TEA and 5 mM NADP+ after 5 h irradiation. ... 58
Figure 4-28 Four kinds of reaction conditions. (A) NADP+ was mixed with ZnPE1-Mb in photoirradiated process
without TEA and then TEA was added in the dark reaction, (B) ZnPE1-Mb was photoirradiated without TEA and NADP+, and then TEA and NADP+ were added in the dark reaction, (C) TEA was mixed with
TEA and NADP+ were mixed and photoirradiated simultaneously. The experiment was carried out at with
10 μM of ZnPE1-Mb, 1 M of TEA, and 5 mM of NADP+ in a 100 mM phosphate buffer (pH 9.2). ... 59
Figure 4-29 (A)Comparing the peak shift of ZnPE1-Mb after 12 h irradiation in different conditions, including ZnPE1-Mb only, ZnPE1-Mb/TEA, ZnPE1-Mb/NADP+, and ZnPE1-Mb/TEA/NADP+. (B) Magnify of Soret
band ... 60
Figure 4-30 UV-Visible spectral change for 10 μM MtPE1-Mb, 1 M of TEA, and 5 mM of NADP+ in 100 mM
phosphate buffer (pH 9.2) upon continuous photoirradiation. (A) ZnPE1-Mb, (B) H2PE1-Mb, (C)
CoPE1-Mb, (D) NiPE1-Mb, and (E) CuPE1-Mb. ... 62
Figure 4-31 Absorbance change at 340 nm of the solution containing 10 μM (a) H2PE1-Mb, (b) CoPE1-Mb, (c)
NiPE1-Mb, (d) CuPE1-Mb, and (e) ZnPE1-Mb, 1 M of TEA, 5 mM of NADP+ upon continuous
photoirradiation. ... 62
Figure 4-32 UV-Visible spectral change of (A) H2PE1-Mb, (B) ZnPE1-Mb, (C) CoPE1-Mb, (D) NiPE1-Mb, and (E)
CuPE1-Mb and TEA were photoirradiated for 5 h then added NADP+ to keep in the dark for 5 days. ... 63
Figure 4-33 Absorbance change at 340 nm, (A) H2PE1-Mb, (B) ZnPE1-Mb, (C) CoPE1-Mb, (D) NiPE1-Mb, and
(E) CuPE1-Mb and TEA were photoirradiated for 5 h then added NADP+ to keep in the dark for 5 days. ... 64
Figure 4-34 UV-Visible spectral change for 10 μM MtPE1, 1 M of TEA, and 5 mM of NADP+ in 100 mM
phosphate buffer (pH 9.2) upon 5 h photoirradiation. (A) H2PE1, (B) CoPE1, (C) NiPE1, (D) CuPE1 and (E)
ZnPE1. ... 65
Figure 4-35 Absorbance change at 340 nm contains 10 μM MtPE1, 1 M of TEA, and 5 mM of NADP+ in 100 mM
phosphate buffer (pH 9.2) upon 5h photoirradiation. (A) H2PE1, (B) CoPE1, (C) NiPE1, (D) CuPE1, and (E)
ZnPE1. ... 66
Figure 4-36 Absorbance change in the solution containing 0.625, 2, 5, and 10 μM of ZnPE1-Mb, 1M of TEA, and 5mM of NADP+ in 100mM phosphate buffer (pH 9.2) upon 5 h photoirradiation. (Appendix 1)... 67
Figure 4-37 Test of TEA effect. (A) Similar experiment as Fig.4-24, but changed the concentration of TEA. (B) Combined overall efficiency after 5 days of different concentration TEA. (Appendix 2) ... 68
Figure 4-38 The difference of fluorescence emission spectra for ZnPE1-Mb in variety condition: before (A) and after (B) photoirradiated with λex = 340 nm. ... 70
Figure 4-39 Fluorescence emission comparison of variety condition, including 100 mM KPi, 1M TEA, 2.5 mM NADP+, 2.5 mM NADPH, NADP++TEA. ... 71
Figure 4-40 The emission intensity of different concentration NADPH. ... 71
Figure 4-41 UV-vis absorption spectra of MtPE1-Mbs on TiO2 film ... 72
Figure 4-42 The photovoltaic characteristics of (A)H2PE1-Mb, (B)CoPE1-Mb, (C)NiPE1-Mb, (D)CuPE1-Mb, and
(E)ZnPE1-Mb –sensitized solar cells. All measurements were performed under AM1.5 illumination (100 mW cm-2). For comparison, the individual blank TiO
1. Introduction
1.1 The global energy crisis
Abundant energy is indispensable for modern civilizations. But the energy crisis has become the most important issue in nowadays. Some investigations point out that the supply of oil and natural gas will be unable to keep up for demand, and the production of oil and natural gas would be shortage at 2015. We need alternative energy urgently. Alternative energy we need is not based on the burning of fossil fuels or the splitting of atoms which will cause undesirable effects of pollution, such as greenhouse effect and nuclear waste, etc. Fortunately there are many means of harnessing energy which have less damaging impacts on our environment.
The sun supply Earth with a steady stream of energy. The total solar energy absorbed by Earth's atmosphere, oceans and land masses is approximately 3,850,000 exajoules (EJ) per year.(Fig.1-1)1 The amount of solar energy reaching the surface of the planet is so vast that in one year it is about twice as much as will ever be obtained from all of the Earth's non-renewable resources of coal, oil, natural gas, and mined uranium combined.No other energy supply could conceivably be as plentiful as the 120,000 terawatts the sun provides ceaselessly and unbidden. 2
If we could convert sun energy into useful forms, the reliance on fossil fuels and nuclear power don’t be needed. And the production of climate-change agents and hazardous waste materials could be substantially reduced. The question is how can all of this freely available solar energy be captured and transformed into useful energy forms?
Figure 1-1 About half of the incoming solar energy reaches the earth’s surface.1
1.2 Techniques for converting sunlight into electricity
Solar photovoltaic cells capture the light energy and convert it into electric power, are one of the most promising devices for sustainable and renewable sources of clean energy. Now, solar cells are classified into three developing directions: (1) silicon based, (2) chemical based, and (3) new materials in the field of solar cell research. (Fig.1-2)
Among them, the operational principle of dye sensitized solar cell (DSSC) is given in fig. 1-3.3 The DSSC consists of photoactivated-dye, mesoscopic oxide semiconductor (TiO2, ZnO, Nb2O5),
redox electrolyte or an organic hole conductor (usually I-/I3- in acetonitrile), conducting glass (usually ITO, FTO) and cathode (Pt). Monolayer photo-sensitized dye is absorbed on the surface of the nanocrystalline film and immersed in a redox mediator. When the dye is excited by incoming light to become excited state (electron + hole); the electron is injected into the conduction band of the semiconductor, while the hole remains on the dye, which gets into an oxidized state (missing an electron). The redox electrolyte provides electron to the dye, and gets oxidized in turn. The electron in the semiconductor is injected into the anode. And electrolyte regenerate at the counter electrode by electrons passed through the load.
Figure 1-3 The working principle of DSSC. Photoexcitation of the sensitizer (S) is followed by electron injection into the conduction band of an oxide semiconductor film. The redox system regenerates the dye molecules, and the dye molecules are regenerated at the counter electrode by electrons passed through the load. Potentials are referred to the normal hydrogen electrode
(NHE).3
1.3 Natural photosynthesis mechanisms
Extremely fine craftsmanship of nature is the ultimate goal for chemist.Natural photosystem plays a role of solar energy harvesting and energy conversion. The importance and complexity of photosynthesis has led many researchers to look for ways to duplicate the fundamental characteristics of these electron transfer reactions in simplified chemical systems. And it’s an integrated system including light harvesting, photo-induced charge separation, and synthesis of higher-energy compounds.
Photosynthetic apparatus consists of a number of photoactive proteins, which harvest solar energy and synchronize all of their function to make photosynthesis unabridged and efficient. During photosynthesis, plants and certain bacterial systems convert light energy into electrochemical energy and eventually into chemical potential energy stored in carbohydrates and other compounds. Photosynthesis start by the absorption of a photon by light-harvesting (antenna) complexes that usually comprise a large number of pigments embedded in protein matrices. This process is followed by an efficient energy migration over many pigments within the antenna system until a reaction center is encountered.
Knowing how plants and bacteria harvest light for photosynthesis so efficiently may provide a new idea for energy requirements.
Photosynthesis, natural biosphere drives energy from sunlight energy. Photosynthetic organisms,
i.e., plants, algae and photosynthetic bacteria, have developed efficient systems to harvest the light of
the sun and to use the light energy to drive their metabolic reactions.
1.3.1 Bacterial photosynthesis -Purple bacteria
of a photon is transferred to the reaction center. In purple bacteria, the photosynthetic membranes contain two types of light-harvesting complexes: light harvesting complex I (LH-I) and light harvesting complex II (LH-II). The structure is showed in Fig.1-4.4
Figure 1-4 Photoexcited electron transfer in the bacterial photosynthetic unit. LH-II contains two types of BChls: B800 (dark blue) and B850 (green), which absorb at 800 nm and 850 nm. BChls in LH-I absorb at 875 nm and labeled B875 (green). PA and PB refer to the RC special
pair, and BA, BB refer to the accessory BChls in the RC. The figure demonstrates the coplanar
arrangement of the B850 BChl ring in LH-II, the B875 BChl ring of LH-I, and the RC BChls PA, PB, BA, BB.4
X-ray structure of RC (from Rhodopseudomonas viridis, Rps. V) was first published in 1985. Typically, RC (from Rb. S) is embedded in the bacterial cytoplasmic membrane and is composed of three subunits labeled L, M and H. The L and M subunits, each forming five transmembrane α-helices, are related by an axis of approximate two-fold symmetry. The more hydrophilic subunit H is located at the cytoplasmic surface and binds to both the L and M subunits. Except the one carotenoid molecule, cofactors including a bacteriochlorophyll (BChl) dimer (termed as P) known as the primary donor, two monomer bacteriochlorophylls (BChlA and BChlB), two bacteriopheophytins
(BPheA and BPheB), two quinones (QA and QB) and one non-heme iron are symmetrically arranged
in the L and M subunits .5
All of the cofactors are binding to the proteins non-covalently. It is the well established photo-induced electron transfer (ET) system. Via the photoexcitation of P or received excitation energy transferring from the antenna, the excited state of P (P*) forms and then decays in about 3–4 ps to form the charge separation state P+BPheA−. Subsequently, BPheA− transfers an electron to QA
with a constant of about 200 ps at room temperature, yielding the state P+QA−. And ET from QA− to
QB takes a few hundred μs. (Fig.1-5)5
.
Figure 1-5 (A) Three-dimensional structure of RC from Rhodobacter sphaeroides (Rb. S). The L, M and H subunits are shown as orange, green and blue ribbons. (B) Schematic of the cofactors
arrangement and the photo-induced ET present in RC.5
1.3.2 Plant photosynthesis
Light-dependent reactions take place in the thylakoid membranes of the chloroplasts in green plant. Plants synthesize ATP and NADPH by utilizing light energy. One molecule of the pigment chlorophyll absorbs one photon and drives the electron to phenophytin. And pheophytin passes the electron to a quinine molecule, starting a flow of electrons down an electron transport chain that leads to reduction of NADP+ to NADPH at last. A proton gradient is created across the chloroplast
membrane. Its dissipation is used by ATP synthase for the concomitant synthesis of ATP. The chlorophyll molecule regains the lost electron from a H2O molecule and releases a dioxygen (O2)
molecule. The overall reaction for the light-dependent reactions under the conditions of non-cyclic electron flow in green plants is:
2H2O +2 NADP+ +2 ADP + 2 Pi + light→2 NADPH +2 H+ + 2 ATP +O2
Some specific wavelengths of light can support photosynthesis. It depends on the type of accessory pigments present. There are two forms of light-dependent reaction: non-cyclic and cyclic reaction. In the non-cyclic reaction, the photons are captured in the light-harvesting antenna complexes of photosystem II by chlorophyll and other accessory pigments. When a chlorophyll molecule of the photosystem II reaction center obtains sufficient excitation energy from the adjacent antenna pigments, an electron is transferred to the primary electron-acceptor molecule, pheophytin. This process called photo-induced charge separation. These electrons are transported through an electron transport chain, called Z-scheme, that generates a chemiosmotic potential across the membrane. In Z-scheme, electrons are excited due to the light absorbed by the photosystem I. A second electron carrier accepts electrons, which again is passed down lowering energies of electron acceptors. The energy created by the electron acceptors is used to move hydrogen ions across the thylakoid membrane into the lumen. Electrons are used to reduce the co-enzyme NADP+, which has functions in the light-independent a reaction. An ATP synthase enzyme uses the chemiosmotic potential to make ATP during photophosphorylation. NADPH is the terminal product of redox reaction in the Z-scheme. The cyclic reaction is similar to that of the non-cyclic, but differs in the form that its generates only ATP, and no NADPH is created. The cyclic reaction takes place only at photosystem I. Once the electron is displaced from the photosystem, the electron is passed down the electron acceptor molecules and returns back to photosystem I, from where it was emitted, hence the
name cyclic reaction.6 (Fig.1-6)
Figure 1-6 Light-dependent reactions of photosynthesis at the thylakoid membrane.
1.3.3 The importance of protein scaffold in photosystem
Photosynthetic apparatus is a typical electronic device, including molecular optical and electronic circuitry organized by a protein scaffold. It occurs with an amazingly high efficiency. Photo-induced electron transfer to yield long-lived charge-separated (CS) states is the most fundamental energy conversion process.Photosynthetic membrane proteins play a role of bio-device for solar energy harvesting and energy conversion. They can stabilize the charge-separated state and excited-state lifetimes. Protein structural deformation will induce lifetime shortening of excited state.7-10
1.4 Artificial photosynthesis
Artificial photosynthesis is a way to mimic the photosynthesis of plants artificially. The photosynthetic apparatus of both photosynthetic bacteria and higher plants involves a reaction center
surrounded by intricate arrays of pigments that form an energy gradient for efficient light collection. Artificial systems that can mimic this excellent natural system have attracted great interest.
1.5 Biosolar cell
Presently, the great part of biosolar cell applies the organisms directly from natural plant or photosynthetic bacteria to create the biophotoelectric devices.8,9Minority are artificial materials.11,12
To convert sun energy to electric energy, utilization of novel nanoporous materials as powerful electrode surfaces for biomolecules immobilization has achieved significant progress. The advantages of these matrixes with nanoporous structure are high surface area, pore volume, ideal biocompatibility, and improved electrochemical, photoelectrochemical activity, etc. These characteristics can entrap and retain the high activity of protein and promote the direct or photo-induced ET. Increased efforts on constructing nanoporous films for biomolecules entrapments have provided great possibilities to the development of versatile biosensors and bioelectronics.12
Lu et al. constructed a nano-crystalline TiO2 films prepared by anodic electrodeposition which
was successful for RC adsorption. The porosity of the TiO2 film provided a relatively high surface
area for RC immobilization and retained the activity of the protein. They proved that protein was unaltered on the electrode surface. WO3–TiO2 and RC had well-matched energy levels to enhance
photoelectric performance of the derived bio-PEs especially in the red to NIR region as compared with that of the TiO2-RC ones.(Fig.1-7) The pigment exchanged RC (BPhe was replaced to Phe)
adsorbed onto the above-mentioned nanostructured WO3–TiO2 could strongly promote the
photocurrent generation. (Fig. 1-8) Phe was utilized to replace BPhe in the native-RC for decreasing the ultrafast excited-state relaxation rate of RC itself. Improved photo-induced ET from RC mutant to the WO3–TiO2 electrodes, which was deduced from the experimental results of femtosecond (fs)
pump-probe dynamics, fluorescence (FL) emission and NIR photoelectric responses, was proved undoubtedly.13
Figure 1-7 Schematic working principle of the RC based bio-photoelectric cell. The photoanode is ITO/WO3–TiO2/RC film and Pt as the counter-electrode. The electrolyte is pH 8.0 Tris–HCl buffer containing 8 mM sodium dithionite. a1: Vb of WO3, a2: Cb of WO3, b1: Vb of TiO2, b2:
Cb of TiO2, c1: PBPheQAFe2+QB, c2: P*BPheQAFe2+QB, c3: P+BPhe−QAFe2+QB, c4:
P+BPheQA−Fe2+QB, c5: P+BPheQAFe2+QB−.13
Figure 1-8 Illustration of the Phe-RC/WO3–TiO2 PE and photo-induiced ET. Cb, conduction band; Vb, valence band; P, BChl dimmer; BPhe, bacteriopheophytin; Phe, pheophytin; QA, the
primary quinone; QB, the secondary quinine.13
1.6 Myoglobin
Myoglobin is a single-chain globular protein with 153 amino acids, containing a heme (iron-containing porphyrin) prosthetic group in the center around which the remaining apoprotein folds. It has eight alpha helices (named A-H) and a hydrophobic core. (Fig.1-9) It has a molecular weight of 16,700 daltons, and is the primary oxygen-carrying pigment of muscle tissues. In 1958, Kendrew et al first used X-ray crystallography technology to solve the structure of myoglobin, it was the first solved protein crystal structure. The X-ray structure shows the relative position of amino acid residues and prosthetic group. The hydrophobic amino acid residues are folded into Mb molecule and surround the prosthetic group; the hydrophilic amino acid residue are positioned at outer surface and provide solubility in water. On the other hand, due to its commercial availability, a single electro-active iron heme as a prosthetic group and a known structure, Mb is considered to be an ideal model protein for the study of heme proteins or enzymes.14,15
Figure 1-9 Crystal structure of myoglobin and the prothetic group, heme.
The ability of Mb to bind oxygen depends on the presence of heme, when this prosthetic group is lost, Mb maintains its native solubility and conformational structural characteristics and refers as apo-Mb. Apo-Mb demonstrates various differences from its holo-form; its red color is lost and the protein has both a lower ellipticity, lower stability, and less compact.16
We are interested and focus on the electron-transfer (ET) reaction and the chemical reactivity of Mb, because the small globular Mb could be a suitable model to understand the physicochemical properties of hemo-proteins.17 The heme pocket of Mb can stabilize the reduced and oxidized states of the iron complex. There are three types of methods to give Mb with new functions: (i) modification of functional group on protein surface18 (ii) mutation of amino residues for Mb19 (iii) reconstitution of an artificial prosthetic group with apo-Mb.18-21 The reconstitution of Mb with an artificially created prosthetic group is a unique method for introducing a new chemical function into the protein. (Fig1-10)22
Figure 1-10 Schematic representation of myoglobin modifications. An artificial prothetic group inserted into apo-Mb.
1.6.1 Why is myoglobin?
Prothetic group heme is non-covalently bound in the cavity of myoglobin. Artificial prothetic group (photosensitizer) can easily be replaced into protein cage. Native heme is the analog of porphyrin. Different metals integrated with porphyrins the function and the property will be variable. And it can be modified with chromophores to enhance the ability of photosensitization. In homologous protein (cytochrome c), the prothetic group is covalently bound in the cavity. The process of removing the prothetic group, the destructive HF is necessary. So we chose myoglobin as our protein model.
1.6.2 Pigment (MtPE1)
Metallo-5-(4-carboxy-phenylethynyl)-10, 20-biphenylporphines (MtPE1) were denoted as H2PE1, CoPE1, NiPE1, CuPE1, and ZnPE1. The structure of MtPE1 system is comprised by three
parts : (i) metallo biphenylporphyrin (MtBPP) unit serves as light-harvesting center to provide photo-induced electrons, (ii) the PE group is connected to the meso position of the porphyrin to transfer the electrons efficiently, and (iii) the carboxylic acid (CA) attached to the end of the spacer serves as an anchoring group to bond tightly onto the surface of TiO2 nanoparticles.(Fig1-11).23
1.7 The application of myoglobin in electron transfer study.
1.7.1 Myoglobin based triads
Hu et al. created a protein-based semi-synthetic photoreaction center which used Mb as a model protein to study photo-induced electron transfer processes (ET).24 To mimic the function of photosynthetic organisms that converted light energy to chemical potential in the form of long-lived charge-separated states, the system was constructed in a protein by cofactor reconstitution. Two factors (FeIIIOH2)-Ru2+-BXV4+(1) and (Zn)-Ru2+-BXV4+(2) (Fig1-12) were reconstituted with the
acceptor (cyclobis(paraquat-p-phenylene) BXV4+) and the sensitizer (Ru(bpy)3) are noncovalently
linked in a catenane type, and the sensitizer is covalently linked with the donor (metallo-protoporphyrin) located in the myoglobin pocket.(Fig1-13)
Figure 1-12 Chmical structure of (1) (FeIIIOH2)-Ru2+-BXV4+ and (2) (Zn)-Ru2+-BXV4+. The
structure was composed by donor (metalo-proporphyrin)-sensitizer(Ru(bpy)3)-acceptor(cyclobis(paraquat-p-phenylene)
Figure 1-13 Schematic illustration of the reconstitution if 1 and 2 with apo-Mb to afford the myoglobin-based triads, Mb(FeIIIOH2)-Ru2+-BXV4+ and Mb(Zn)-Ru2+-BXV4+.24
The resulting electron transfer processes of reconstituted Mb(FeIIIOH2)-Ru2+-BXV4+ and
Mb(Zn)-Ru2+-BXV4+ were analyzed by steady-state absorption, fluorescence and transient absorption. In summary, their study clearly demonstrated that Mb plays a critical role in biological electron transfer, including (1) isolation of the redox partners in a multicomponent assembly to prevent their stacking in the ground state, (2) fixation of the conformation of a chromophore and the protein surface, (3) regulation of the ET pathway among singlet ET, triplet ET, a short-cut process and stepwise process, and (4) control of the lifetime of a resultant charge-separated state. (Fig1-14)
(a)
(b)
Figure 1-14 (a) Energetics and selected pathways for Mb(FeIIIOH2)-Ru2+-BXV4+ in buffer solution after excitation to the Ru(bpy)3 excited state. The energy of the excited Ru(bpy)3 component was calculated from the absorption and emission spectra of catenane 5. The energies of the various charge-separated states were estimated from the corresponding redox
potentials of models for the components of Mb(FeIIIOH2)-Ru2+-BXV4+. The energy levels are not corrected for any Coulombic stabilization of the intermediates. (b) Energy levels of the
locally excited state of the Ru2+(bpy)3 moiety and the hypothetical ion-pair states of
Mb(Zn)-Ru2+-BXV4+ and the pathways available for their interconversion. For comparison purpose, the excited states of ZnPP are not present.24
1.7.2 Photochemical reduction of NADP+ by Zn-Mb as simple model of photosystem Ι Nishiyama et al. reported a simple model of photosystem I by forming NADPH. Zinc protoporphyrin (Zn-PP) reconstituted myoglobin (ZnMb) as a photo-sensitized enzyme, triethanolamine (TEA) as a sacrificial donor, and NADP+ as an electron acceptor. Upon irradiation, the absorbance increase at 340nm which is attributed to NADPH formation. (Fig1-15) When Zn-PP used as a photo-sensitizer instead of Zn-Mb, the NADPH absorbance is not apparent. The difference of the efficiency may be caused by the lifetime of excited triplet. When Zn-PP reconstituted with apo-Mb, excited triplet lifetime increase apparently and cause the high efficiency of NADPH formation.25,26
Figure 1-15 UV–visible spectral change for 10 mM of Zn–Mb, 1 M of TEA, and 1 mM of
NADP+ in 10 mM of phosphate buffer (pH 9.0). (a) Before irradiation. (b) After 3.5 h of
irradiation with visible light (λ > 390 nm) at an intensity of 2.8 mW. Following the irradiation, spectra were measured after 1 (c), 2 (d), 3 (e), 6 (f), and 9 (g) days in the dark under an atmosphere of N2.
2. Specific aims
Biosolar cell is our ultimate aim. First, we need to construct a simple artificial photosynthetic apparatus. MtPE1 are series of photo-sensitizers. Due to the MtPE1 are easy to self-aggregation and self-quenched, we reconstituted MtPE1 with apo-Mb to let them as a monomer inside the protein and attempt to stabilize excited lifetime.
Some basic studies help us to understand the properties of MtPE1-Mb. UV-Vis, fluorescence, TCSPC help us to recognize whether MtPE1s are inside the protein or not. To compare the photo-induced NADP+ conversion efficiency of MtPE1-Mb which is photo-sensitized enzyme, triethanolamine (TEA) was used as a sacrificial donor and NADP+ was used as an electron acceptor. CV analysis helps us to infer whether is the well-matched energy level of electron donor and acceptor from HOMO and LUMO.
2.1 Reconstitution of MtPE1 with wild-type apo-Mb
We reconstitute dye with apo-Mb to prevent prosthetic groups aggregation and to extend the lifetime of charge-separation state. The MtPE1 dyes trend to self-aggregate and the photo-induce excited state lifetime will be self-quenched. The situation of self-quench will decrease the conversion efficiencies (η). So we reconstitute MtPE1 with apo-Mb to avoid the aggregation. First, we need to purify the wild-type apo-Mb by ethyl methyl ketone method.27 After we get apo-Mb, reconstitution of various MtPE1 with apo-Mb is the critical step in our project. Base on the principle of changing pH to induce apo-Mb unfolding and refolding, various prosthetic groups can be reconstituted with apo-Mb. This procedure can keep prosthetic group monomer inside the apo-Mb, and this method is convenient for us to further proceed in our experiments.
2.2 Optic assay of reconstituted MtPE1-Mb (UV-Vis, fluorescent and TCSPC)
In order to create a biosolar cell system, the basic knowledge of optic and electrochemistry is prerequisite. We detect UV-Vis spectra to confirm the light absorption range of these proteins and compare the peak shift in different condition. The detection of fluorescent emission spectra which is excited at Soret band will be analyzed and getting preliminary information of photo-induce electron transfer process. Time-correlated single-photon-counting system (TCSPC) and fluorescence optically gated (up-conversion) system (FOG) are two critical technologies for us to distinguish photo-induced charge-separated state and to understand the details of the photo-induced electron transfer mechanism. In our proposal, these detections are essential for us to research basic optic information of these reconstituted MtPE1-Mbs and apply it in biosolar cell study.
2.3 Electrochemistry assay of reconstituted MtPE1-Mb (CV)
Directionality of electron transfer is a basic feature of many biological processes, (e.g., photosynthesis). We can use the reduction potential, oxidation potential and cooperate with UV-Vis analysis to calculate the LUMO, HOMO and band gap. Studies with protein solution often are confronted with such challenges as the difficulty to achieve the direct electrochemistry of protein on some bare electrodes as well as the poor reversibility of the direct heterogeneous electron transfer reactions between electrode and protein .When electrode surface modified with detergent (didodecyldimethylammonium bromide, DDAB) can get reversible electron transfer between protein and electrode. DDAB films would provide a biomembrane-like microenvironment for incorporated proteins.
2.4 Photoirradiation assay of reconstituted MtPE1-Mb
About converting light energy to chemical energy, well-matched energy level electron donor and acceptor are needed. Triethanolamine (TEA) is used as a sacrificial donor, NADP+ is used as an
electron acceptor and MtPE1-Mb is photo-sensitized enzyme. Based on this simple system, we compared the photo-induced NADP+ conversion efficiency of free base and MtPE1-Mb.
2.5 Photoelectronics assay of reconstituted MtPE1-Mb (IV)
For biosolar cell study, current/voltage measurement (IV curve) is essential indexes to judge the photovoltaic performances of the solar cell. The IV curve shows a graphical presentation of the current versus the voltage from a photovoltaic cell as the load is increased from the short circuit (no load) condition to the open circuit (maximum voltage) condition. The shape of the curve characterizes cell performance. (Fig. 2-1)
Figure 2-1 A typical current-voltage curve. This maximum current is called the short circuit current, abbreviated Isc. When the module is shorted, the voltage in the circuit is zero. Conversely, the maximum voltage is produced when there is a break in the circuit. This is called the open circuit voltage, abbreviated Voc. Under this condition the resistance is infinitely high and there is no current, since the circuit is incomplete. These two extremes in load resistance, and the whole range of conditions in between them, are depicted on a graph
called an I-V (current-voltage) curve. Current, expressed in amps, is on the vertical Y-axis. Voltage, in volts, is on the horizontal X-axis
3. Experimental materials and procedures
3.1 Experimental materials
Acetic acid (Merck)
30% Acrylamide (GE Healthcare) APS (GE Healthcare)
2,2,-azino-bis(3-ethybenthiazoline 6-sulfonic acid)(ABTS)(Sigma) Amicon ultrafitration membrane (Millipore)
Ammonium sulfate (Merck)
Coomassie® Brilliant blue R 250 (Merck) DEAE Sephacel (Amersham Pharmacia Biotech) Dialysis membrane (Cellu®Sep T1)
Didodecyldimethylammonium bromide (DDAB) (Aldrich) Dimethyl sulfoxide (MP Biomedicals)
Ethyl methl ketone (Merck) Glycerol (Merck)
Hydrogen chloride (Merck)
LMW-SDS Marker Kit (Amersham Pharmacia Biotech) Methanol (Merck)
2-mercaptoethanol (Merck)
Metallo-5-(4-carboxy-phenylethynyl)-10,20-biphenylporphines (C.-Y. Lin Lab) Myoglobin (Sigma-Aldrich)
Nicotinamide adenine dinucleotide phosphate (NADP+) (Fluka) Potassium chloride (Merck)
Potassium diphosphate (Merck) Potassium phosphate (Merck) Sephadex G-25 (GE Healthcare) Sodium acetate (Merck)
Sodium bromide (Merck) Sodium chloride (AMRESCO) Sodium hydroxide (Merck) TEMED (GE Healthcare) Tris base (USB)
Triethanolamine (TEA) (Merck) TiO2 film (Eric W.-G. Diau Lab)
3.2 Experimental apparatus
AllegraTM 21R Centrifuge (Beckman Coulter)
8453 UV-Visible Spectrophotometer (Agilent Technologies) Fluorescence Spectrophotometer (USB2000FLG, Ocean Optics)
Time-correlated single-photon-counting system (TCSPC, FluoTime 200, PicoQuant) CHI electrochemical analyzer (CH Instruments)
Photochemical reactor PR-2000 (Panchum)
3.3 Obtain wild type apo-Mb from myoglobin by Methyl ethyl ketone method
Methyl ethyl ketone method was used to extract the heme from the Mb protein matrix.27 Briefly, 100 mg of Mb (Sigma-Aldrich) that was without additional purification was dissolved in 30 ml of ice-cold, salt-free PBS. The pH was adjusted to 2.0 by adding 0.1 N HCl dropwise while stirring in order to denature the protein and let the heme prothetic group to be extracted easily. Equivalent of ice-cold methyl ethyl ketone (30 mL) was mixed with the acid denatured Mb solution and shook in a separating funnel for a short time. After extraction, a hazy pale yellow aqueous layer (bottom) which contained the protein (apo-Mb) was separated from the dark brown methyl ethyl ketone layer which contained heme. The aqueous (apo-Mb) layer was shook with a 30 ml of ice-cold methyl ethyl ketone again in order to separate apo-Mb and heme thoroughly. The apo-Mb solution was transferred to a dialysis belt which had been prepared according to a standard procedure. The solution was then dialyzed against ddH2O for 2 to 3 hours to remove methyl ethyl ketone. The procedure was repeated
for two times with renewed ddH2O and finally the solution was dialyzed in salt-free PBS buffer
overnight. After dialysis, the pH of protein solution was adjusted to 7.0 to enhance the yield of apo-Mb and preserved at -20 degree.
3.4 Reconstitution of apo-Mb with MtPE1
Reconstitution of metallo--5-(4-carboxy-phenylethynyl)-10,20-biphenylporphines (MtPE1) into apo-Mb followed the modified method of Axup et al.28 Briefly, a 1.5-fold excess of metallo-protoporphyrins in dimethyl sulfoxide (DMSO) solution was added dropwise to a 10 mM KPi/DMSO (4/1) buffer pH 12 containing apo-Mb and cooled in an ice bath. After incubation for 15 min, the solution was adjusted to pH 6.8 and was allowed to stir for 6h at 4 ℃. The solution was transferred into a dialysis membrane against ddH2O, with two changes of ddH2O to remove DMSO,
followed by additional dialysis against 10 mM KPi buffer pH 6.8 for overnight. The solution was then filtrated with 0.45 μm cellulose membrane before applied to a Sephadex G-25 column,
equilibrated with 100 mM KPi buffer pH 6.8, and eluted with the same buffer at 4 ℃. The protein band was collected and stored at -20 ℃ for later experiments.
3.5 Steady-state spectral measurements
UV-visible spectra of MtPE1 and reconstituted MtPE1-Mbs were recorded with 8453 UV-Visible Spectrophotometer (Agilent Technologies). Emission spectra were measured with a composite CCD spectrometer (USB2000FLG, Ocean Optics). The excitation source contains a pulsed diode-laser head (LDH-P-C-400, PicoQuant) coupled with a laser-diode driver (PDL-800B, PicQuant) that produces excitation pulses at 435 nm with an average power ~700 μW.
3.6 Picosecond fluorescence decays
Picoseconds lifetime was measured by time-correlated single-photon-counting system (TCSPC, FluoTime 200, PicoQuant). The excitation source came from either a femtosecond laser system (Verdi-10 and Mira 900D, Coherent) at 435 nm (double from an 860-nm, PicoQuant) at 435 nm; the instrument response is ~30 ps using the fs laser system while it increases to ~80 ps using the ps laser system. The temperature of fluorescence decay experiments was kept at 10 °C.
3.7 CV analysis and differential pulse voltammetry (DPV)
A CHI electrochemical analyzer (CH Instruments) was used for cyclic and differential pulse voltammetry. In electrochemical measurement, experiments employed a three-electrode cell with Ag/AgCl reference electrode, a platinum wire auxiliary electrode and a glassy carbon electrode (GCE) as working electrode. Before each experiment, the glassy carbon electrode was published with powered alumina and rinsed with distilled water as a pretreatment. 10 mM DDAB suspensions were dissolved in water and ultrasonicated for several hours to produce clear vesicle dispersions. Clear vesicle dispersions of 10 mM DDAB containing 0.25 mM protein was used to make films.
Equal volumn of protein and dispersion were spread on a GCE and dried overnight. Cyclic voltammetry at DDAB-protein film was performed in 50 mM acetate buffer pH 7. Prior to measurements, buffer solution was purged with nitrogen gas at least 15 min, and then stopped apply nitrogen gas during the experiment.29-31
3.8 Photoirradiation experiment
The reduction efficiency of MtPE1-Mbs were recorded with photochemical reactor PR-2000 (Panchum). Photoirradiation was carried out under room temperature using 16 W Xe lamp. The light intensity at the cell was 6 mW / cm2.
3.9 Photoelectrochemical measurements
The photovoltaic property of MtPE1 and reconstituted MtPE1-Mbs adsorbing on nanocrystalline TiO2 films were analyzed by I-V measurements, a 300-W xenon light source of solar
simulator (SAN-EI ELECTRIC) was used as the irradiation source. The spectral output of the lamp matched the AM 1.5 (100 mW/cm2) solar spectrum. Incident light intensities were adjusted with neutral wire mesh attenuators. The current-voltage characteristics were determined by applying an external potential bias to the cell and measuring the photocurrent using a Keithley model 2400 digital source meter. The overall conversion efficiency η of the photovoltaic cell is calculated from the integral photocurrent density (Jsc), the open-circuit photovoltage (Voc), the fill factor of the cell (ff),
and the intensity of the incident light (IPh).
4. Result and discussion
4.1 Wild type apo-Mb purification
The acid–acetone method was usually used to extract heme from hemeproteins in previous study. In this method, protein is precipitated as solid phase and can be collected by filtration and centrifugation. However, high concentration of acetone was used to ensure the protein was completely precipitated, but protein denatured usually occurs. And it makes the method difficult to apply quantitatively. Methyl-ethyl ketone (MEK) substitution for acetone can avoid to exposure the protein to high concentration of acetone and the bothersome step of re-dissolving the precipitation. It attributes to MEK is just partially miscible with water, enable heme and protein to be rapid and completely separated to organic layer and liquid layer.
The result of apo-Mb purification by MEK method is shown in figure 4-1. The absorption spectrum of MbWT showed absorption protein peak at 280 nm and Soret band at 410 nm in buffer solution. The absorption spectrum of heme showed absorption absorption maximum of Soret band at 383nm in MEK and THF. Apo-Mb extracted from Mb by MEK method gave only one signal at 280nm, and no Soret band. It proved that heme group was removed from Mb and gained apo-Mb. And figure 4-2 showed the SDS-PAGE result of purification by MEK method.
Figure 4-1 UV-Vis results : To confirm that heme has been removed by MEK method.
Figure 4-2 SDS-PAGE result: To confirm apo-Mb in each steps (a) Lane 1: Apo-Mb (b) Lane 2: commercial myoglobin (c) Lane 3: Apo-Mb before dialysis (d) Lane 4: Apo-Mb after dialysis.
4.2 UV-Vis and fluorescence analysis
4.2.1 UV-Vis analysis results of reconstituted MtPE1-Mbs
The absorption spectra of MtPE1-Mbs all consist of two branches, the Soret (or B) band in the higher energy region and weak Q bands in lower energy region, traditionally identified as the S0→S2
(n→π*) and S0→S1 (π→π*) transitions, respectively. (Fig4-3)
Figure 4-3 Absorption spectra of ZnPE1-Mb in KPi solution with B (Soret) and Q bands.
We have successfully reconstituted five MtPE1 (H2PE1, CoPE1, NiPE1, CuPE1 and ZnPE1)
with apo-Mb. Figure 4-4 to 4-8 showed the UV-Vis spectrum comparison of reconstituted MtPE1-Mbs in KPi buffer, MtPE1 in KPi buffer, and MtPE1 in tetrahydrofuran (THF). UV-Vis
spectrum could be used to ascertain if MtPE1 were successfully reconstituted with apo-Mb. MtPE1 almost could not dissolve in phosphate buffer, so there was no absorption in UV-Vis spectrum. Reconstituted MtPE1 with apo-Mb could enhance the solubility in KPi buffer. Comparing with
MtPE1 dissolved in THF, the UV-Vis spectra of reconstituted MtPE1-Mbs were shifted in both Soret and Q band. The spectral shift was related to the polarity of surrounding environment for MtPE1. The absorption spectrum of MtPE1 in KPi buffer were red shift for the Q bands by comparing with MtPE1 in THF. In theory, increasing the polarity of environment leads to decreasing energy of a typical π→π* state and red shift of absorption peak in porphyrins. So the energy gap of S0→S1
transition of MtPE1-Mb was smaller than that of MtPE1 in THF, which was consistent with the red shift spectral feature of Q bands. However, the broad and red shifted spectral features of MtPE1 in 100mM Kpi buffer pH 7 were generally attributed to the formation of MtPE1 aggregation. MtPE1 might change the structure via the same procedure of MtPE1-Mb reconstitution, but without apo-Mb. (Maybe different solvent and pH value cause the different form of aggregation for MtPE1 and result in various shift of absorption peaks) (Fig. 4-4 to Fig. 4-8 blue line) A conjecture was apo-Mb could protect MtPE1 against the excessive pH change in the process of reconstitution. When MtPE1 were reconstituted with apo-Mb to form MtPE1 complex in buffer solution, the Soret band of the complex became sharp and blue shift.
Table 4-1 listed the absorption maxima and extinction coefficients of MtPE1. The extinction coefficients decreased from Zn, H2, Cu, Co to NiPE1. Q bands of H2PE1 were divided into four
Figure 4-4 Normalized steady-state absorption spectra of H2PE1 in THF, 100mM KPi buffer and reconstituted with apo-Mb in 100mM KPi.
Figure 4-5 Normalized steady-state absorption spectra of CoPE1 in THF, 100mM KPi buffer and reconstituted with apo-Mb in 100mM KPi.
Figure 4-6 Normalized steady-state absorption spectra of NiPE1 in THF, 100mM KPi buffer and reconstituted with apo-Mb in 100mM KPi.
Figure 4-7 Normalized steady-state absorption spectra of CuPE1 in THF, 100mM KPi buffer and reconstituted with apo-Mb in 100mM KPi.
Figure 4-8 Normalized steady-state absorption spectra of ZnPE1 in THF, 100mM KPi buffer and reconstituted with apo-Mb in 100mM KPi.
Table 4-1 Absorption maxima (nm) and the extinction coefficients (cm-1M-1)of MtPE1
Entrya Soret (log ε) Q (log ε)
H2PE1 430 (5.54) 526 (4.12), 566 (4.37) 604 (3.77), 661 (3.96) CoPE1 430 (5.40) 541 (4.15), 577 (4.09) NiPE1 427 (5.36) 538 (4.23), 573 (4.14) CuPE1 431 (5.50) 552 (4.24), 594 (4.20) ZnPE1 439 (5.65) 568 (4.23), 616 (4.44)
Table 4-2 Absorption maxima (in nm)of MtPE1-Mbs
Entrya Soret band Q band
H2PE1-Mb 418 534, 576 615, 666 CoPE1-Mb 444 558, 607 NiPE1-Mb 412 548, 581 CuPE1-Mb 413 557, 599 ZnPE1-Mb 444 576, 628
a This work was measured in 100mM KPi buffer
The Soret band of ZnPE1 in KPi buffer became much broader than that of ZnPE1-Mb in Kpi buffer and Zn-PP in THF, whereas red-shift was observed for the Soret and Q bands. The broad and red-shifted spectral features of ZnPE1 in KPi buffer are generally attributed to a side-by-side aggregation (J type aggregation) of ZnPE1 aggregates in aqueous solution. Ribo et al. discussed in detail the formation of H- and J-aggregates, which are characterized by face-to-face and side-by-side arrangements of the porphyrins, respectively.32 In the case of J-aggregates, a red shift of the Soret band is expected.32 The putative red-shifted Q-band absorption peaks signify that the assembly
consists of head-to-tail aggregates (J-aggregates).33,34A red-shift was observed for both the Soret and the Q bands of ZnPE1-Mb in KPi buffer solution. Because the energy of a typical π-π* state in
porphyrins decreases with increasing solvent polarity, the energy gap of the S0 → S1 transition for
ZnPE1-Mb in KPi buffer is smaller than that of Zn-PP in THF, which is consistent with the red shifted spectral feature of the Q band of the former with respect to the latter. The same is true for the S0 → S2 transition of ZnPE1-Mb in KPi buffer for which a 5 nm red-shift of Soret band was
4.2.2 Fluorescence analysis results
4.2.2.1 MtPE1
The Emission spectra of H2PE1 and MtPE1 (Co, Ni, Cu, Zn) in THF excited at 435nm were
shown in figure 4-9. The emission spectrum of H2PE1 showed emission maxima at 621, 663 and 723
nm, and MtPE1 (Co, Ni, Cu, Zn) at 621 and 670 nm. The emission fluorescence spectra of MtPE1
showed a mirror image of the Q band. By comparing with ZnPE1, the fluorescence intensity of MtPE1 (Co, Ni, Cu) was relatively weak. The lost of fluorescence might be quenched by the metal in the center of H2PE1 with unfilled d orbital. The fluorescence spectrum in THF shows S1→ S0
emission with corresponding maxima located at 621 and 663 nm, respectively.
Figure 4-9 The emission spectra of H2PE1 and MtPE1 (Co, Ni, Cu, Zn) in THF.
Figure 4-10 The steady-state emission fluorescence spectra of MtPE1 by exciting at 435nm. (a) H2PE1 (b) CoPE1 (c) NiPE1 (d) CuPE1 (e) ZnPE1
4.2.2.2 MtPE1-Mbs
The emission spectra of H2PE1-Mb and MtPE1-Mbs (Co, Ni, Cu, Zn) in 100 mM KPi excited at
435nm were shown in figure 4-11. The emission spectrum of H2PE1-Mb showed emission maxima
at 630, 668 and 730 nm, and MtPE1-Mbs (Co, Ni, Cu, Zn) at 621 and 670 nm. The emission
fluorescence spectra of MtPE1-Mbs showed a mirror image of the Q band. By Comparing with ZnPE1-Mb, the fluorescence intensity of other MtPE1-Mbs (Co, Ni, Cu) was relatively weak. Like the conjecture of MtPE1 in THF previously, the lost of fluorescence might be quenched by the metal in the center of H2PE1 with unfilled d orbital. The fluorescence spectrum in THF showed S1→ S0
emission with corresponding maxima located at 630 and 668nm, respectively.
Figure 4-11 The emission spectra of 2.5μM MtPE1-Mb in 100 mM Kpi.
Figure 4-12 The steady-state emission fluorescence spectra of MtPE1-Mb by exciting at 435 nm. (a) H2PE1-Mb (b) CoPE1-Mb (c) NiPE1-Mb (d) CuPE1-Mb (e) ZnPE1-Mb
4.3 Picosecond fluorescence decays
The relationship between protein concentration and fluorescence intensity were showed in figure 4-13. Based on the results, we could know that when the protein concentration was higher than ~2.5 μM, the fluorescence intensity was decreased by high concentration effect. To avoid self-quenching attributed to high concentration effect, adjustment of protein concentration was needed to keep off interaction between fluorescence molecules. In addition to retain high fluorescence intensity concurrently, the protein concentration for picosecond time-resolved fluorescence measurement is 2~2.5 μM.
Figure 4-13 The relationship between protein concentration and fluorescence intensity in 100mM KPi buffer. Obtain fluorescence intensity at λem=630nm (Co, Ni. Cu, Zn) and λem=668nm (H2) with excitation at λex=435nm.
According to Ching-Yao et. al. femtosecond investigation, the transients reflect the behavior occurring in electronic states S2 and S1 of ZnPE1 in THF, and discuss the internal conversion (IC)
S2→S1 and S1→T1 intersystem crossing (ISC).
Our relaxation dynamic studies were analyzed by picosecond measurement, and emphasized that S1→T1 intersystem crossing. The transients observed at λem = 620 nm (Co, Ni, Cu, Zn) and λem =
663 nm (H2) reflected the dynamical behavior occurring in electronic state S1 of MtPE1 in THF. And
the transients observed at λem = 630 nm (Co, Ni, Cu, Zn) and λem = 668 nm (H2) reflected the
relaxation dynamics in electronic state S1 of MtPE1-Mb in 100 mM KPi buffer. Figure 4-14 shows
the results of fluorescent decays. Comparing with the lifetime τ1= 2.338 ns of a monomeric ZnPE1 in
THF, the τ2= 2.4716 ns of ZnPE1-Mb in 100mM KPi was the S1→T1 intersystem crossing (ISC) of
the monomeric ZnPE1 inside the heme pocket of apo-Mb. The τ1 with short lifetime was contributed
by free ZnPE1 molecules out of the Mb in the form of ZnPE1 aggregates in KPi buffer. Except the lifetime of H2PE1 and H2PE1-Mb were 8.827 ns and 10.062 ns, respectively, the lifetime of others
Figure 4-14 Picosecond fluorescence transients of reconstituted MtPE1-Mb in buffer solution with λex = 435 nm at λem = 630 nm (Co, Ni, Cu, Zn) and λem = 668 nm (H2).
The fluorescence lifetime results of MtPE1 and MtPE1-Mb were summarized at Table 4-3 and Table 4-4.
Table 4-3 Fluorescence lifetimea of the excited state of MtPE1 in THF Entry emission /nm τS1/ns H2PE1 622, 664, 723 τ1=8.827 ns CoPE1 621, 671 τ1=0.65 (36%) τ2=2.371 (64%) NiPE1 620, 664 τ1=2.34 CuPE1 621, 665 τ1=2.34 ZnPE1 621, 670 τ1=2.338
a S1 lifetimes were monitored at 620nm or 664nm
Table 4-4 Fluorescence lifetimea of the excited state of MtPE1-Mb in 100mM KPi buffer Entry emission /nm τS1/ns H2PE1-Mb 668 τ1=0.8152(21%) τ2=10.062 (79%) CoPE1-Mb 630 τ1=2.317 NiPE1-Mb 629 τ1=2.30 CuPE1-Mb 629 τ1=2.31 ZnPE1-Mb 630 τ1=0.6128 (26%) τ2=2.4716 (74%) a S1 lifetimes were monitored at 630nm or 668nm