國 立 交 通 大 學
電信工程研究所
碩 士 論 文
正交分頻多工系統中降低峰均值功率比方法之
研究
A study on PAPR reduction methods for OFDM signals.
研 究 生:潘駿逸
指導教授:黃家齊 博士
國立交通大學
電信工程研究所
碩士論文
正交分頻多工系統中降低峰均值功率比方法之研
究
A Study on PAPR Reduction Methods for OFDM
Signals.
研 究 生: 潘駿逸
指導教授: 黃家齊 博士
正交分頻多工系統中降低峰均值功率比方法之研究
A Study on PAPR Reduction Methods for OFDM Signals.
研 究 生: 潘駿逸
Student:
Chun-Yi Pan
指導教授: 黃家齊 博士
Advisor:
Chia-Chi Huang
國立交通大學
電信工程研究所
碩士論文
A Thesis
Submitted to Institute of Communications Engineering College of Electrical Engineering
National Chiao Tung University in partial Fulfillment of the Requirements
for the Degree of Master
In
Communications Engineering August 2014
Hsinchu, Taiwan, Republic of China
正交分頻多工系統中降低峰均值功率比方法之研究
學生: 潘駿逸
指 導 教 授: 黃家齊 博士
國立交通大學電信工程研究所 碩士班
摘
要
為了使傳輸速率能夠更加快速,各國的研究人員發展出一連串提升傳輸率的方式。 在近幾年來,正交分頻多工系統被視為增加傳輸速率的主要核心。透過將頻帶切成許 許多多正交的子載波,正交分頻多工系統可提高頻譜使用效能,並且多重路徑的效果 能被以簡單的方式等化掉。總結以上的優點,正交分頻多工系統被視為近代主流的通 訊系統. 然而,正交分頻多工也有許多的缺點,其中一個主要問題是其高峰均值功率比。 當傳輸訊號操作在功率放大器的非線性區時,會造成訊號的失真,以及對鄰近頻帶的 干擾。而在我的研究中,我們提出三種降低高峰均值功率比的方法。首先,我們提出 不同於傳統 SLM 方法,透過使用展頻碼來傳送 SLM 方法的側信息,並且達到幾近相 同的表現。第二,透過使用展頻碼來傳送在消波方法中被截掉的訊號,藉以改善消波 方法的錯誤率表現。第三,我們提出將訊號傳送前,使用濾波器將波形整形,藉以降 低峰均值功率比。從模擬的結果顯示,透過提出的這些方法,不但峰均值功率比能夠 降低,錯誤率亦可改善。A Study on PAPR Reduction Methods for OFDM Signals.
Student:
Chun-Yi Pan
Advisor: Chia-Chi Huang
Institute of Communications Engineering
National Chiao Tung University
ABSTRACT
In order to meet the extreme requirement of data rate, researchers around the world have developed a lot of rate-increasing methods. Recently, orthogonal frequency division multiplex-ing(OFDM) has been regarded as one of the core rate-increasing technologies. By dividing the entire bandwidth into narrowband subcarriers, OFDM can provide high spectral efficiency. Also, the multipath effect can be easily equalized. Summarizing the above advantages, OFDM has become a key air interface for most modern wireless communication system.
However, OFDM system suffers from several difficulties. One of the major drawbacks is the high peak to average power ratio(PAPR) at the transmitter. As signals operate on the nonlinearity of a high power amplifier(HPA), it is distorted and causes in-band distortion and out-of-band radiation. In our research, we propose three different PAPR reduction methods. First, a SLM method with CDMA side information is proposed. The difference between the conventional SLM method and the proposed one is that it provides another channel to transmit the side information, i.e., the index of phase sequence. Second, in order to improve the BER performance of traditional clipping scheme, we exploit some spreading codes to transmit the lost information caused by clipping. Third, a novel idea, in which OFDM waveform is shaped by an FIR filter or an all pass filter, is proposed. The numerical results show that by using the proposed methods, the PAPR of OFDM can be reduced, and the performance of OFDM is improved.
誌
謝
首先感謝家齊老師這兩年來的指導,不論是在研究上亦或是生活上皆給了我許多啟發, 以及論文方向的建議,使我們得以完成碩士學位,由衷感謝。 接著要感謝實驗室大家長峻楹學長、煒翰學長不厭其煩的教導,並且給了許多研 究方面的建議,也使我受益良多。當中也特別感謝峻楹學長,在研究方面不斷的督導 以及給予許多論文撰寫的建議,讓我得以完成碩士論文。感謝實驗室同儕學璟、昕峰、 孟剛在學業、研究上所給予的激勵以及幫助,使我研究所日子不是如此乏味。也感謝 實驗室學弟明謙、庭豐、昨默、詠文、武璋為實驗室規劃出遊行程,並且帶給實驗室 不同於以往的歡樂。 最後要感謝家人在我背後默默的支持著我,讓我能沒有其他擔憂的將碩士學位完 成。 誌於 2014.08 新竹 交大 駿逸TABLE OF CONTENTS
中文摘要 . . . I ABSTRACT . . . II 誌謝 . . . III TABLE OF CONTENTS . . . IV
LIST OF TABLES . . . VII
LIST OF FIGURES . . . VIII
1 Introduction . . . 1
2 OFDM . . . 5
2.1 OFDM system model . . . 5
2.2 Peak-to-average power ratio[11] . . . 6
3 The selective mapping(SLM) method with CDMA side information . . . 9
3.1 Motivation . . . 9
3.2 System model . . . 10
3.3 Required SINR for CDMA signal demodulation . . . 12
3.4 OFDM signal demodulation . . . 14
3.5 Simulation results . . . 15
4 Filtered-OFDM . . . 19
4.1 Introduction . . . 19
4.2 System model of FIRP method . . . 20
4.3 Problem in the FIRP OFDM signals . . . 21
4.4 Pilot-aided channel estimation . . . 23
4.5 Remedy:APFP method . . . 23
4.6 Simulation results . . . 25
5 The clipped OFDM with CDMA side information . . . 30
5.1 Motivation . . . 30
5.2 System model . . . 31
5.3 Matched filter . . . 32
5.4 Quasi-exhaustive peak position searching algorithm . . . 36
5.5 Best linear unbiased estimator(BLUE) . . . 38
6 Conclusion . . . 43
LIST OF TABLES
3.1 Simulation parameters . . . 15
4.1 Simulation parameters . . . 25
5.1 Simulation parameters . . . 40
6.1 Comparison of three methods . . . 45
6.2 Comparison of Tx complexity . . . 45
LIST OF FIGURES
2.1 OFDM transmitter. . . 6
3.1 Block diagram of the SLM scheme of OFDM system combined with embedded CDMA signal. . . 11
3.2 Block diagram of embedded CDMA signal for phase sequence ru. . . 11
3.3 OFDM and CP-CDMA receiver structure. . . 14
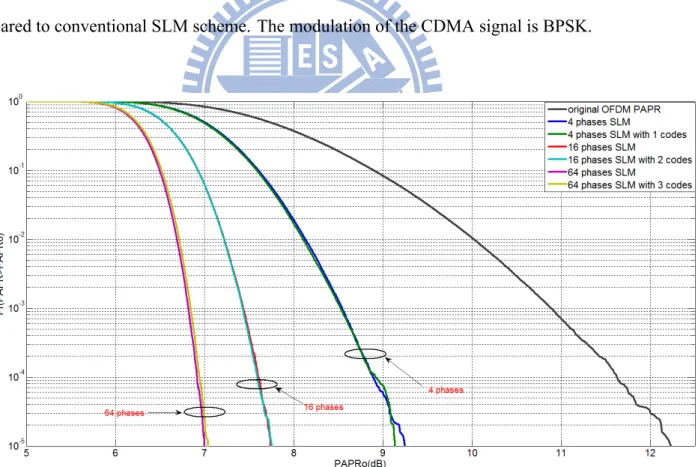
3.4 PAPR reduction behavior of proposed scheme with SINR=10dB,SNR=20dB compared to conventional SLM scheme. The modulation of the CDMA signal is BPSK. . . 17
3.5 PAPR reduction behavior of proposed scheme with SINR=10dB,SNR=5dB com-pared to conventional SLM scheme. The modulation of the CDMA signal is QPSK. 17
3.6 PAPR reduction behavior of proposed scheme with SINR=10dB,SNR=20dB compared to conventional SLM scheme. The modulation of the CDMA signal
is QPSK. . . 18
3.7 BER performance of OFDM and CDMA with 3 PN codes/64 SLM phases. . . 18
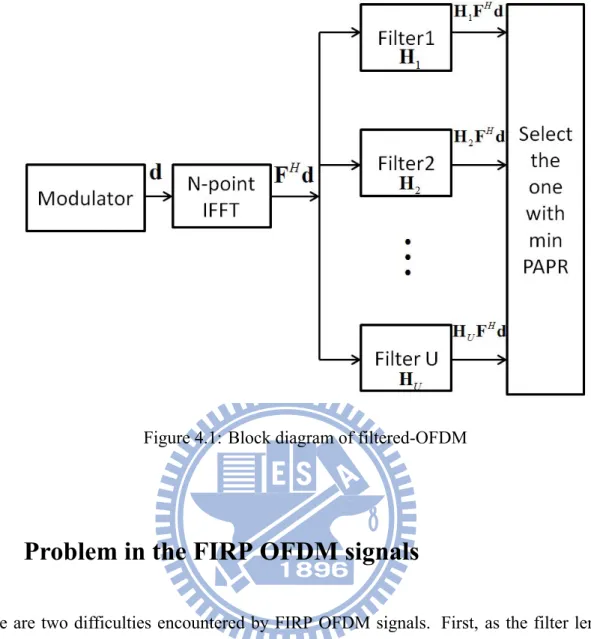
4.1 Block diagram of filtered-OFDM . . . 21
4.2 Frequency response of an effective channel with the number of filter taps=2 compared with the original channel. . . 22
4.3 Frequency response of an effective channel with the number of filter taps=4 compared with the original channel. . . 22
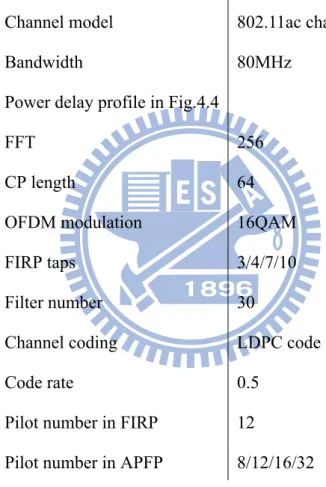
4.4 802.11n Physical model B:Power delay profile. . . 27
4.5 The PAPR reduction behavior of the FIRP and the APFP method as compared with the TR method. . . 27
4.6 BER performance of the FIRP method without channel coding. . . 28
4.7 BER performance of the FIRP method with channel coding. . . 28
4.8 BER performance of the APFP method. . . 29
4.9 BER performance of the APFP method compared with the FIRP(taps=3) method. 29 5.1 Block diagram of clipped OFDM and CDMA transmitter. . . 32
5.2 Block diagram of matched filter receiver and OFDM demodulation. . . 33
5.3 Example of a bank of correlators that matches to h1. . . 35
5.4 BER performance of clipped-OFDM with CDMA signal. The clipping num-ber=1, clipping ratio=0.2 and power ratio=2.5 . . . 41
5.5 BER performance of clipped-OFDM with CDMA signal. The clipping num-ber=2, clipping ratio=0.2 and power ratio=2.5 . . . 42
5.6 PAPR reduction performance with different clipping number, clipping ratio=0.2 and power ratio=2.5. . . 42
CHAPTER
1
Introduction
Recently, orthogonal frequency division multiplexing(OFDM) has been used as one of core technologies for wireless communication systems. Due to the advantages of achieving high data transmission in wireless communication systems and robust to frequency selective fading channel, OFDM is an attractive technique. For example, in wireless local area network, digital audio broadcasting, and digital video broadcasting, OFDM has been adopted as a standard.
However, OFDM systems suffer from its high peak-to-average power ratio(PAPR) which is one of the major bottleneck for the transmitter. Because of the nonlinearity of power amplifier, signal distortion such as in-band distortion and out-of-band radiation is incurred. In general, there are some backoff required to reduce the distortion caused by the nonlinearity of PA. It also gives rise to low power efficiency that leads to large energy loss, not only deteriorating the system efficiency, but also exacerbating thermal issues with devices. In addition, the complexity of analog-to-digital converter(ADC) and digital-to analog converter(DAC) will also increase
owing to larger PAPR. Therefore, reducing PAPR has become one of the most important research area for the OFDM systems.
There are several schemes to reduce PAPR. In general, they can be classified into “mul-tiplicative” and “additive” methods. Selective mapping(SLM) [1]-[4] and partial transmit se-quence(PTS) [5] are categorized as multiplicative schemes because input symbol vectors of OFDM signal are multiplied by multiple phase sequences. On the other hand, tone reservation [6], peak cancelling and clipping method [8]-[10] are categorized as additive schemes because artificially induced signals are added to the original OFDM signals. Additionally, in tone in-jection scheme, each point of the original constellation will be mapped into several equivalent points in the expanded constellation which results in extra degree of freedom. The active con-stellation extension method extends outer signal concon-stellation points to mitigate PAPR without degrading of performance.
The schemes of SLM will generate several candidate signals, and the one with minimum PAPR OFDM signal will be transmitted. Although the conventional SLM approach provides good performance for PAPR reduction, it suffers from the high computation complexity of banks of IFFT. In [2], the performance of small number IFFT blocks of the modified SLM can reach almost the same performance of more number of IFFT blocks of the conventional SLM. In [3]-[4], some kinds of low-complexity conversions to replace the IFFT blocks in the conventional SLM were presented. Besides, in order to recover data, the index of phase sequence should also be sent to the receiver. In [2], a portion of subcarriers is reserved for the transmission of the phase sequence index. Although the PAPR can be reduced by the SLM method, the bandwidth is sacrificed for the transmission of the index of phase sequence. In Chapter 3, we introduce a novel SLM method with CDMA side information that the index of the selective phase sequence for SLM is transmitted by spreading codes embedded in the OFDM signal. Thus, we do not need to reserve subcarriers to transmit the index of phase sequence and the sacrifice of bandwidth is completely avoided.
In Chapter 4, filtered-OFDM, which reduces PAPR by filtering OFDM waveform, is pro-posed. Due to filtering, the effective channel varies symbol by symbol. Consequently, channel estimation is needed for every OFDM symbol. Two types of filters will be applied for PAPR reduction. One is finite impulse response(FIR) filters and the other is all pass filters. It should be noted that all pass filters pre-filtering method was also proposed in a parallel work [13]. In order to determine CP length, only effective filter length is considered in [13]. Additionally, fi-nite number pre-defined all pass filters are used. Hence, at receiver, the selected all pass filter ID is received as the side information. Different from [13], we use arbitrary generated first-order all-pass filters that the filter ID does not require to be transmitted to receiver. The effective channel can be estimated and equalized with the aid of pilot subcarriers.
Clipping is a simple and intuitive method to reduce PAPR of OFDM signal. However, it has two major drawbacks. First, clipping generates self interference by distorting the signal amplitude which increases the BER. Second, it also gives rise to out-of-band side-lobe, i.e., the adjacent bands will be interfered. In [8], clipping and filtering was used to reduce PAPR and suppress the out-of-band clipping noise. However, filtering after clipping may cause some peak regrowth. Hence, the iterative clipping and filtering process is needed. In [10], a technique called decision-aided reconstruction(DAR), where the symbols are decided in frequency domain and come back to time domain so as to regrowth some peaks iteratively, can significantly reduce the error floors introduced by the clipping noise. Unlike [10], we utilize the CDMA signal to transmit the clipped peaks directly. In Chapter 5, only few peaks of ”high PAPR” OFDM sig-nals will be clipped. Then, the information of the clipped peaks will be transmitted by spreading codes. At receiver, the clipped OFDM signals will be restored by adding the clipped peaks and subtracting CDMA signals from the received signal. The numerical results show that by using these proposed method, the PAPR of OFDM can be reduced and the performance of OFDM improved.
defi-nition is described in Chapter 2. In Chapter 3, we introduce the SLM method with CDMA side information and compare the PAPR reduction performance with the conventional SLM scheme. In Chapter 4, a filtered-OFDM method is proposed. In addition to investigating the PAPR reduc-tion behavior, we also discuss some problems in this method. In Chapter 5, in order to improve the BER performance of clipping method, we use spreading codes to transmit the clipped in-formation. Finally, Chapter 6 gives the conclusion of this thesis and compares the complexity among these PAPR reduction methods. It should be noted that Chapter3-5 have their own system models and simulation results.
The following notations are used throughout this thesis. The superscript (·)H and (·)T denotes Hermitian and transpose of a vector or matrix. The superscript of (·)∗ represents opti-mal/suboptimal solution of a vector or matrix. F is the N × N unitary discrete Fourier trans-form(DFT) matrix whose entry (m, n)thentry is given by√1
Ne −j2πmn
N , with m, n∈ {0, 1, · · · , N−
1}. We define diag(x) as a diagonal matrix with vector x on its diagnal. We use tr(·) to rep-resent trace operation. E is statistic expectation. n∼CN (0, Σ) represents a complex Gaussian distributed random vector with zero mean and covariance matrix Σ. G and Υ denote operation of CP insertion and CP removal, respectively. He and Λ are a circular channel matrix and a diagonal matrix of channel frequency response, separately. d is OFDM input symbol sequence in frequency domain. ⊗ and ⊗c denote convolution and circular convolution. Without loss of
CHAPTER
2
OFDM
2.1
OFDM system model
Let d = [
d0 d1 · · · dN−1
]T
deonte an input symbol vector in frequency domain, where dk
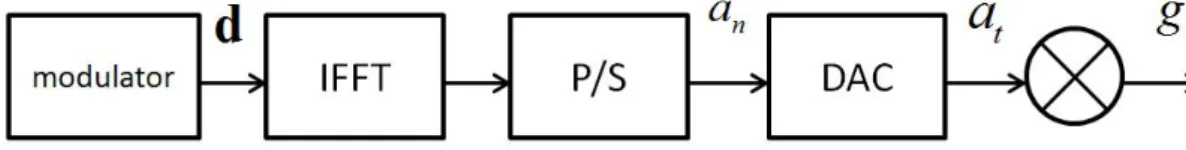
represents the complex data of the kth subcarrier and N is the number of total subcarriers. A continuous-time baseband OFDM signal is defined as
at= √1 N N−1 ∑ k=0 dkej2πN tsk t, 0≤ t ≤ Nt s (2.1)
Where ts is the sampling period. The discrete-time baseband OFDM signal an sampled at the Nyquist rate t = ntscan be written as
an = √1 N N−1 ∑ k=0 dkej2πNkn, n = 0, 1· · · , N − 1 (2.2)
Let a = [
a0 a1 · · · aN−1
]T
denote a discrete-time baseband OFDM signal vector. a cor-responds to the inverse fast Fourier transform(IFFT) of d, i.e., a = FHd. The block diagram is
depicted in Fig 2.1.
Figure 2.1: OFDM transmitter.
2.2
Peak-to-average power ratio[11]
In the following, we will generally introduce the issue of PAPR. In general, PAPR has three different definitions according to different stages. At the first stage, the discrete-time baseband OFDM signal is generated. The PAPR definition of an is the ratio of maximum peak power divided by the average power of OFDM, that is,
PAPRa n = max 0≤n≤N−1|an| 2 Pav(an) , Pav(an) = 1 N N∑−1 n=0 E{|an|2} (2.3)
At the second stage, the continuous-time baseband OFDM signal at is generated by passing
an to an digital-to-analog converter(DAC). The PAPR of at defined as the ratio of maximum instantaneous power divided by the average power of OFDM, can be expressed as
PAPRa t = max 0≤t≤Nts |at|2 Pav(at) , Pav(at) = 1 N ts ∫ N ts 0 E{|at| 2}dt (2.4)
At the third stage, the radio frequency(RF) OFDM signal gtis produced by modulating atto a radio frequency fc, i.e., gt = Re{atej2πfct}. The PAPR of continuous-time passband OFDM
signal gtis also defined as
PAPRg t = max 0≤t≤Nts |gt|2 Pav(gt) (2.5)
2.3
Relationship between the three different PAPRs
The discrete-time baseband OFDM signals are transformed to continuous-time baseband sig-nals by DAC. The peak power of continuous-time baseband OFDM signal can be increased while maintaining a constant average power. The average power of discrete-time baseband and continuous-time baseband OFDM signal is derived as follows
Pav(an) = 1 N N∑−1 n=0 E{|an|2} = 1 N N∑−1 n=0 E{ana∗n} = 1 N N∑−1 n=0 E{1 N N∑−1 k=0 |dk| 2} = 1 N N∑−1 k=0 E{|dk| 2} (2.6) Pav(at) = 1 N ts ∫ N ts 0 E{|at| 2}dt = 1 N ts ∫ N ts 0 1 N N∑−1 k=0 E{|dk| 2}dt = 1 N N∑−1 k=0 E{|dk| 2} (2.7)
Usually, the PAPR of a continuous-time baseband OFDM signal is larger than that of its discrete-time baseband version by 0.5 ∼ 1 dB. Mixing the continuous-time baseband OFDM signal with the radio frequency generates the continuous-time passband OFDM signal. It does not change the peak power, but the average power of the passband OFDM signal is half the average power of the continuous-time baseband signal. The average power of passband OFDM
signal is derived as follows, and atis equal to aI+ jaQ Pav(gt) = 1 N ts ∫ N ts 0 E{|gt| 2}dt = 1 N ts ∫ N ts 0
E{|aIcos(2πfct)− aQsin(2πfct)|2}dt
= 1 N ts ∫ N ts 0 {E[a2 I]cos 2 (2πfct) +E[a2Q]sin2(2πfct)}dt = E[a 2 I] +E[a2Q] 2 = E[a 2 t] 2 = Pav(at) 2 (2.8)
Thus, the PAPR of the continuous-time passband signal is generally larger than that of the continuous-time baseband OFDM signal by 3 dB. The relationship of the above PAPRs is given as
PAPRa
CHAPTER
3
The selective mapping(SLM) method with CDMA side information
3.1
Motivation
In the conventional SLM scheme [1], the OFDM signal with minimum PAPR among U candi-date signals, which are generated by multiplying the input symbol sequence d with predefined phase sequences, is selected and used for transmission. In order to decode data, the index of phase sequence should also be sent to the receiver. The side information of the index should be protected by channel coding. In [2], a portion of subcarriers of the OFDM signal is reserved for the transmission of the phase sequence index. Although the SLM method can reduce PAPR, additional bandwidth is sacrificed for the transmission of the phase sequence index.
3.2
System model
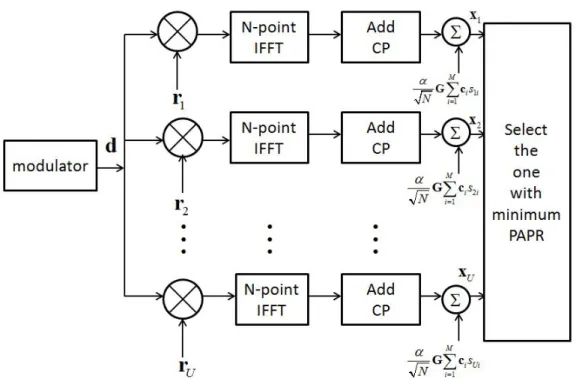
In this chapter, a novel idea that the index of phase sequence is transmitted by spreading codes embedded in the OFDM signal is proposed. By using this method, the data rate of OFDM can be maintained and PAPR reduced. Moreover, the penalty of bandwidth is completely avoided in the proposed method.
The block diagram is illustrated In Fig3.1. In out proposed method, U alternative sequences are generated as xu = GFHRud + α √ NG M ∑ i=1 cisui, 1≤ u ≤ U (3.1)
where Ru is the diagonal matrix related to the uth phase sequence ru, G is the operation of
adding CP, su1· · · suM are the M encoded symbols corresponding to the index of uth phase
sequence, c1· · · cM are the M spreading codes used to transmit su1· · · suM and α is a power
coefficient used to adjust the receiver SINR for CDMA signal. The definition of phase sequence is ru = [ru1ru2· · · ruN]T with r
un ∈ ±1.
Afterwards, the signal xu˜ with minimum PAPR among U candidate signal vectors {xu}
is selected and transmitted. Without loss of generality, we make the following normalizations: E[|sui|2] = 1 for i = 1· · · M, u = 1 · · · U, N1E[dHd] = 1, cHi ci = N for i = 1· · · M.
Figure 3.1: Block diagram of the SLM scheme of OFDM system combined with embedded CDMA signal.
3.3
Required SINR for CDMA signal demodulation
The major challenge of this work is the following question: “how can we demodulate the OFDM signal embedded with CDMA?”. In this paper, we propose a demodulation method based on a successive interference cancellation(SIC) approach. First, the receiver demodulates the CDMA signal and eliminates the CDMA signal from the received signals. Then, if the interference for OFDM signal, i.e., CDMA signal, can be perfectly cancelled, the OFDM signal will be interference-free. However, in order to make the OFDM signal almost interference-free, CDMA detection should be nearly perfect. Hence, we need to select a power coefficient α that makes the CDMA signal achieve a predefined SINR. In the following, we will derive the coefficient α corresponding to a predefined SINR β.
The received signal can be expressed as
y = Hxu˜+ n = HGFHRu˜d + α √ NHG M ∑ i=1 cisui˜ + n (3.2)
where H is the channel matrix, and n ∼ CN (0, σ2I). After CP removal and FFT, the signal
vector can be expressed as
r = FΥy = FΥHGFHRu˜d + α √ NFΥHG M ∑ i=1 cisui˜ + FΥn = ΛR˜ud + b + FΥn (3.3)
where Λ is a diagonal matrix of channel frequency response, and Υ is the operation of CP removal.
From (3.3), we rewrite vector b as follows b = √α NFΥHG M ∑ i=1 cisui˜ = √α NFΥHGF H F M ∑ i=1 cisui˜ = √α NΛ M ∑ i=1 ˜ cis˜ui = √α NΛ [ ˜c1 · · · ˜cM ] su1˜ .. . s˜uM = √α NΛCs = α √ NAs (3.4) where ˜ciequals to Fci.
Therefore, we can easily use ZF or MMSE equalizer to decorrelate the interference between the different phase PN codes. The vector r can be rewritten as
r = ΛRu˜d + √α
NAs + FΥn (3.5)
In the following, ZF equalizer is utilized to decorrelate interference:
v = (AHA)−1AHΛRu˜d + √α Ns + (A H A)−1AHFΥn = (AHA)−1AHΛRu˜d + √α Ns + (A H A)−1AHF˜n (3.6)
In order to achieve reliable transmission, the SINR of demodulated CDMA signal should be controlled such that it is greater than a predefined threshold β. The effective SINR can be obtained as SINR = a2 Ntr{E[ss H]}1 M 1 Mtr{E[(A HA)−1AHΛddHΛH A(AHA)−1]} + 1 Mtr{E[(A HA)−1AHF˜n˜nHFHA(AHA)−1]} = α2M N tr[(AHA)−1AHΛΛH A(AHA)−1] + σ2 ntr[(AHA)−1] (3.7)
To find the coefficient α SINR≥ β ⇒ α2 ≥ N Mβ{tr[(A HA)−1AHΛΛH A(AHA)−1] + σn2tr[(AHA)−1]} ⇒ α ≥ √ N Mβ{tr[(A HA)−1AHΛΛHA(AHA)−1] + σ2 ntr[(AHA)−1]} (3.8)
3.4
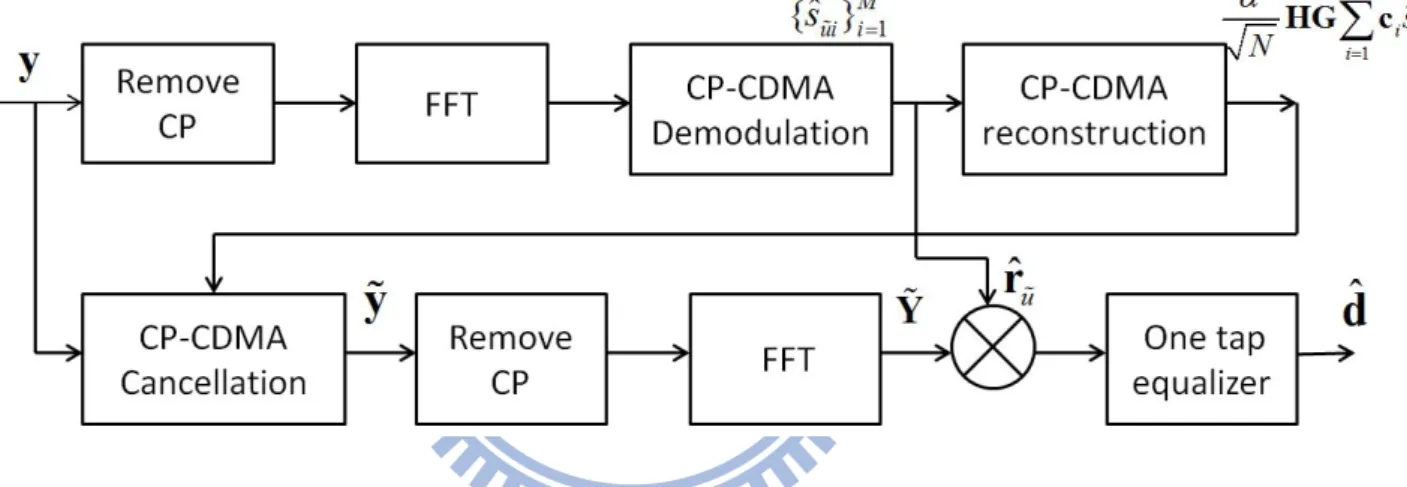
OFDM signal demodulation
From the above, we derive the coefficient α to achieve the required SINR β of CDMA signal. Next, we have to demodulate OFDM signal. The detection procedure is shown in Fig3.3.
Figure 3.3: OFDM and CP-CDMA receiver structure.
After CP-CDMA signal demodulation and reconstruction, we can subtract the interference of CP-CDMA signal from OFDM.
˜ y = Hxu˜+ n− α √ NHG M ∑ i=1 ciˆsui˜ = HGFHRu˜d + α √ NHG M ∑ i=1 ci(sui˜ − ˆsui˜ ) + n (3.9)
If CP-CDMA signal can be reconstructed perfectly, the interference of CP-CDMA can be ig-nored. Then, after CP removal and FFT, the vector ˜Y is given as
~
Y = FΥHGFHR˜ud + FΥn
= ΛRu˜d + FΥn
Finally, after one-tap equalization and multiplying the detected phase sequence ˆru˜, the estimated
information data vector is
ˆ
d = d + Λ−1Rˆu˜FΥn (3.11)
3.5
Simulation results
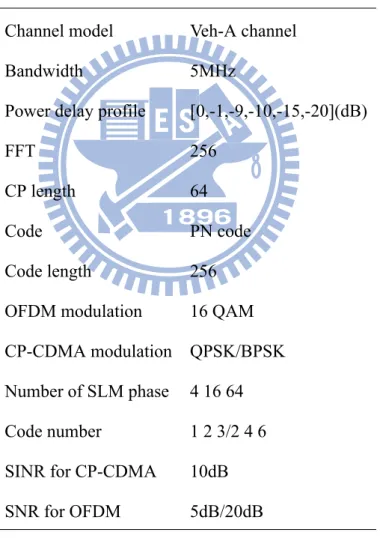
In my simulations, both PAPR reduction behavior and BER performance are presented. The simulation parameters are listed in Table 3.1.
Table 3.1: Simulation parameters
Channel model Veh-A channel
Bandwidth 5MHz
Power delay profile [0,-1,-9,-10,-15,-20](dB)
FFT 256
CP length 64
Code PN code
Code length 256
OFDM modulation 16 QAM
CP-CDMA modulation QPSK/BPSK
Number of SLM phase 4 16 64
Code number 1 2 3/2 4 6
SINR for CP-CDMA 10dB
SNR for OFDM 5dB/20dB
In Fig.3.4-3.6, the PAPR reduction performance of the proposed scheme is compared to the conventional SLM scheme. In Fig.3.4, the modulation of the CDMA signal is BPSK, SINR=10 dB for CDMA signal, SNR=20 dB for OFDM signal, and 4,16,64 phase sequences are used. In
Fig.3.5, the modulation of the CDMA signal is QPSK SINR=10 dB for CDMA signal, SNR=5 dB for OFDM signal, and 4,16,64 phase sequences are used. In Fig.3.6, the modulation of the CDMA signal is QPSK, SINR=10 dB for CDMA signal, SNR=20 dB for OFDM signal, and 4,16,64 phase sequences are used.
When the number of phase sequence increases, the proposed scheme requires more PN codes to transmit the index of phase sequence. In other words, the PAPR of proposed scheme increases as more PN codes are used. Thus, in Fig.3.4, the gap of PAPR between the proposed scheme and the conventional SLM method increases with the increase of phase sequence. In addition, the amplitude ratio α is inversely proportional to SNR of OFDM. With the decrease of SNR, the coefficient α will increase and the PAPR of proposed scheme will also increase. Therefore, in Fig.3.5, the PAPR of the proposed scheme with lower SNR may slightly larger than the PAPR of the proposed scheme in Fig.3.6 with higher SNR. Overall, the proposed scheme has similar PAPR reduction performance compared to the conventional SLM method, if the number of spreading codes used in the proposed scheme is limited.
The BER performance of the proposed scheme is presented in Fig.3.7. The modulation of CDMA signal is QPSK and the number of phase sequence is 64. As the predefined SINR is 10 dB for CDMA signal, the BER approaches to 10−3. Even though 20− 30% power of the OFDM signal is allocated to transmit the CDMA signal, the corresponding BER degradation is only 0.8− 1.1dB. However, with the increase of SNR, the BER of the OFDM signal has an evident error floors. To overcome this problem, we can promote the pre-defined SINR or decrease modulation scheme for CDMA signal.
Figure 3.4: PAPR reduction behavior of proposed scheme with SINR=10dB,SNR=20dB com-pared to conventional SLM scheme. The modulation of the CDMA signal is BPSK.
Figure 3.5: PAPR reduction behavior of proposed scheme with SINR=10dB,SNR=5dB com-pared to conventional SLM scheme. The modulation of the CDMA signal is QPSK.
Figure 3.6: PAPR reduction behavior of proposed scheme with SINR=10dB,SNR=20dB com-pared to conventional SLM scheme. The modulation of the CDMA signal is QPSK.
CHAPTER
4
Filtered-OFDM
4.1
Introduction
In this chapter, an innovative idea, named filtered-OFDM, is proposed. The core idea behind this method is to reduce PAPR via filtering OFDM waveform. The original OFDM signal is passed through distinct filters. Then, the one with minimum PAPR among all alternative filtered-OFDM signals is selected and transmitted. By filtering the waveform, the original high peaks of the OFDM signal can be significantly smoothed.
The main parameters that determine the PAPR reduction capability are the number of filter taps and the number of alternative filtered-OFDM signals. Clearly, as the number of alternative filtered-OFDM signals and the number of filter taps increase, the amount of PAPR reduction becomes more significant.
Two types of filtered-OFDM methods will be covered in the following. At first, finite impulse response pre-filtering(FIRP) method, which uses finite impulse response(FIR) filters will be introduced. Then, we introduce all-pass filter pre-filtering(APFP)[13] method, where the OFDM signal is passed through an first-order all-pass filter.
4.2
System model of FIRP method
The block diagram is shown in 4.1. At first, U FIR pre-filtering(FIRP) OFDM signals are gen-erated, and the uth candidate OFDM signal xu is given as
xu = FHd⊗chu
= HuFHd, 1≤ u ≤ U
(4.1)
where the operation⊗c denotes circular convolution, hu = [hu[0]· · · hu[Lf − 1]]T represents
the vector of filter taps, Hurepresents circular filter matrix, and Lf is the filter length.
For the purpose of normalization, the coefficients of filter taps are constrained by
L∑f−1
i=0
|hu[i]|
2
Figure 4.1: Block diagram of filtered-OFDM
4.3
Problem in the FIRP OFDM signals
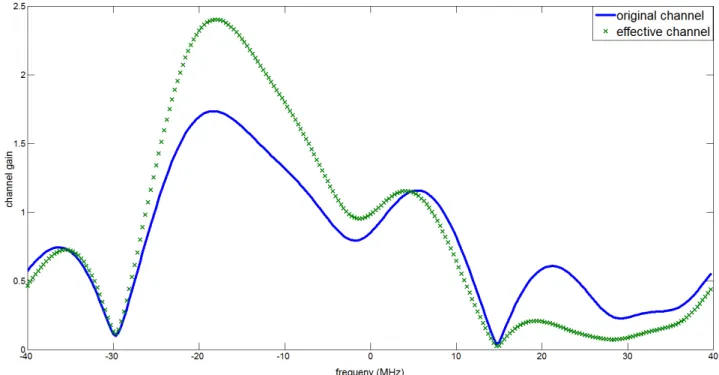
There are two difficulties encountered by FIRP OFDM signals. First, as the filter length in-creases, more pilot tones are required to estimate the effective channel. Second, as the number of filter taps increases, channel selectivity becomes more serious. We take Fig.4.2 and Fig.4.3 as two examples. Fig.4.2 and Fig.4.3 show two typical channel realizations and their corre-sponding filtered effective channel with two taps and four taps, respectively. It can be observed from these two figures that with the increase of the number of filter taps, the effective channel becomes more and more frequency-selective. As channel coding and interleaving can provide diversity gain in OFDM systems, they are used here to combat frequency selectivity.
Figure 4.2: Frequency response of an effective channel with the number of filter taps=2 com-pared with the original channel.
Figure 4.3: Frequency response of an effective channel with the number of filter taps=4 com-pared with the original channel.
4.4
Pilot-aided channel estimation
We assume the channel length is Lh, filter length is Lf and pilot number is P. The effective
channel length L = Lh + Lf − 1 is also assumed to be smaller than CP length so that ISI is
avoided. The received signal after CP removal and FFT operation can be written as
Y =Hd + n
= diag{FN×L¯hL×1}d + n
= diag{FN×L¯hL×1}dpilot+ diag{FN×Lh¯L×1}ddata+ n
(4.3)
whereH is a diagonal matrix of channel frequency response and ¯hL×1 is the effective channel to be estimated. Then, we extract the pilot components from (4.3) and get
¯
YP×1 = diag{FP×Lh¯L×1}¯dpilot+ z = diag{¯dpilot}FP×Lh¯L×1+ z
(4.4)
Let A = diag{¯dpilot}FP×L. Finally, by least square principle, the effective channel can be esti-mated as
ˆ ¯
hL×1 = (AHA)−1AHY¯P×1 (4.5)
4.5
Remedy:APFP method
Although the FIRP OFDM signal can reduce PAPR significantly, it suffers from the BER degra-dation incurred by its high frequency selectivity. As a result, in order to limit the frequency selec-tivity, an all-pass filter pre-filtering(APFP) method, with unit magnitude response, is exploited. Since all-pass filter does not change the magnitude of a channel, the frequency selectivity in-creasing problem faced by FIRP can be totaly prevented.
It is notable that the APFP method is analogous to the SLM method, for they both change only the phases of input symbol vectors in frequency domain. However, as presented in the
chapter 3, additional bandwidth is sacrificed for the transmission of the phase sequence index in the SLM method, whereas the APFP method, which uses the pilot to estimate the effective channel, needs not the transmission of the phase sequence index. Besides, the complexity of the APFP method is lower than IFFT. Therefore, using the APFP method may be a good solution in both complexity reduction and frequency selective mitigation in the FIRP method.
In the following, we review the transfer function and the corresponding impulse response of a first-order all-pass filter. The transfer function of a firs-order all-pass filter is written as
H(z) = z −1− z∗ 0 1− z0z−1 = z −1 1− z0z−1 − z0∗ 1− z0z−1 (4.6)
where z0is a complex number that|z0| ∈ (0, 1) and ∠z0 ∈ (0, 2π)1The corresponding impulse
response of (5.4)
h[n] = z0n−1u[n− 1] − z0∗z0nu[n] (4.7) where u[n] is an unit step function.
In the previous section, the information of effective channel length is needed at receiver. However, when using all-pass filter, the effective channel is an infinite impulse response(IIR) filter and its effective channel length is, strictly speaking, unlimited. Fortunately, from (4.7), it is observed that most energy is concentrated in the most few preceding taps, and the effect of other taps can be neglected. However, as different z0s will produce different effective channel length, the effective channel length might have a wide range. Hence, it is difficult to apply time-domain channel estimation described in section 4.4. This problem can be easily solved by using frequency-domain channel estimation to replace time-domain channel estimation. In other words, the channel frequency response can be interpolated from pilot subcarriers.
On the other hands, in order to use time domain channel estimation and use the same number of pilot subcarriers as the FIRP method, we constrain the amplitude of z0 between 0.01 and 0.5.
By this way, the most energy of all pass filter will concentrate on the forward taps, so using the time domain cahnnel estimation will not cause serious mistake.
4.6
Simulation results
The simulation parameters are listed in Table 4.1.
Table 4.1: Simulation parameters
Channel model 802.11ac channel model
Bandwidth 80MHz
Power delay profile in Fig.4.4
FFT 256
CP length 64
OFDM modulation 16QAM
FIRP taps 3/4/7/10
Filter number 30
Channel coding LDPC code
Code rate 0.5
Pilot number in FIRP 12
Pilot number in APFP 8/12/16/32
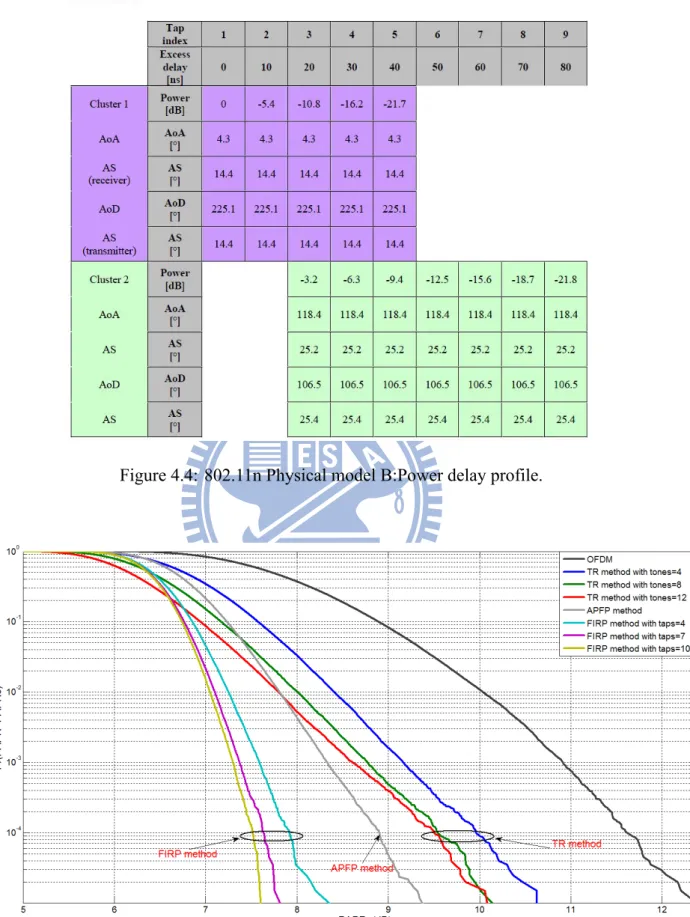
In Fig.4.5, the PAPR reduction performance of different taps FIRP OFDM signals and APFP OFDM signals is presented. In addition, it is also compared to the tone reservation(TR) method [6]. The TR method is formulated as convex optimization problem in Appendix A ac-cording to reference [6]. We just use matlab software to solve the complex optimization problem. Although the APFP method can suppress frequency selectivity, the PAPR reduction performance is inferior to the FIRP method. There is a tradeoff between the PAPR reduction performance
and the BER degradation. Moreover, the PAPR reduction performance of the FIRP method and the APFP method are both superior to the TR method.
In Fig.4.6-Fig.4.7, we compare the BER performance of Lf = 3 taps FIRP OFDM signal
with and without channel coding. Without channel coding, the BER degradation of the FIRP OFDM signal approximates to 8dB. Remarkably, with channel coding, the BER degradation of the FIRP OFDM signal shrinks from 8dB to 2.7dB. The BER penalty is severe in the FIRP OFDM signals. It is apparent that the BER distortion of the FIRP OFDM signal can be lightened with channel coding.
In Fig.4.8, the BER performance of the APFP method, which uses different pilot num-ber to estimate the effective channel in frequency domain, is presented. It is intuitive that the channel estimation becomes more precise when more pilot subcarriers are used to interpolate the effective channel. Therefore, the BER performance of the APFP method will be improved when more pilot subcarriers are used.
In Fig.4.9, we compare the BER performance of the AFPF and FIRP method. In the APFP method, the amplitude of z0is constrained between 0.01 and 0.5. In the FIRP method, the filter number is 3. The pilot subcarriers in both methods are the same. It is obvious that the APFP method has better BER performance compared to the FIRP method due to the usage of all pass filters.
Figure 4.4: 802.11n Physical model B:Power delay profile.
Figure 4.5: The PAPR reduction behavior of the FIRP and the APFP method as compared with the TR method.
Figure 4.6: BER performance of the FIRP method without channel coding.
Figure 4.8: BER performance of the APFP method.
CHAPTER
5
The clipped OFDM with CDMA side information
5.1
Motivation
Clipping is a simple method to reduced the PAPR of OFDM signal. However, because clipping is a nonlinear process, it has two main drawbacks. First, clipping generates self interference by distorting signal amplitude which increases the BER. Second, it also gives rise to re-growth of the high frequency components.
The basic idea of this method is that we use the CDMA signals to transmit the clipped signals. However, because the clipped signals are directly transmitted by CDMA without any modulation scheme used, the demodulation of the clipped signals will be interfered. With the increase of the clipped signals, the interference to each demodulated clipped signal will be con-siderable. As another point of view, the BER performance of the proposed method may be
infe-rior to the clipping method if the number of clipped signals is not small enough or the clipping level is not low enough. Thus, in order to highlight the performance of the proposed method, we deal with the special case that few peaks of OFDM signals with high PAPR are clipped. Then, CDMA signals are utilized to transmit the lost information caused by clipping. At receiver, af-ter detecting the clipped peaks, the clipped OFDM signal can be restored within an acceptable distortion range.
Because a portion power of OFDM is used to transmit the clipped signals by CDMA, we expect that the OFDM signal will have some BER distortion. Even though the clipped signals can be reconstructed perfectly, the BER degradation is still unavoidable. Thus, we have to find a “suitable” power ratio that the clipped signals can be reconstructed as perfect as possible and the power loss of OFDM can be minimized.
5.2
System model
We assume that an OFDM signal has M peaks clipped. A PN code with a choosen phase is used to transmit the M clipped signals. The code length is equal to FFT size. Then, the different sampling time of an OFDM signal can be represented by different phase code. In Fig.5.1, the transmitted signal can be expressed as
x = GFHd− Gϵ + αG M ∑ i=1 ˜ cis˜i (5.1)
where G is the operation of adding CP, ˜s1· · · ˜sM are the clipped signals, ˜c1· · · ˜cM are different phase PN codes to carry the clipped time index, α is a coefficient to adjust the power ratio between OFDM and CDMA signal, ϵ is the clipped signal vector of OFDM, ˜s1· · · ˜sM are the nonzero elements in ϵ.
Figure 5.1: Block diagram of clipped OFDM and CDMA transmitter.
The clipping ratio [8] is defined as
CR = A
σ (5.2)
where A is a clipping level and σ is the rms of an OFDM signal.
The received signal y can be represented as
y = Hx + n = HGFHd + αHG M ∑ i=1 ˜ cis˜i− HGϵ + n (5.3)
where H is the channel matrix, and n∼ CN (0, σ2I).
5.3
Matched filter
The demodulation procedure is the same as chapter 3 based on a successive interference can-cellation(SIC) approach. First of all, the receiver needs to detect the clipped signals transmitted
by CDMA. Second, the receiver reconstructs the CDMA signal and the clipped vector. Third, it subtracts the interference from the CDMA signal and restores the clipped OFDM. In order to detect the clipped signals, the most direct method is to use a matched filter receiver. If the power of the clipped signals is large enough, the clipped signals can be detected after N matched filter banks. The overall block diagram of the receiver structure is shown in Fig.5.2.
Figure 5.2: Block diagram of matched filter receiver and OFDM demodulation.
After CP removal, the received signal vector
v = ΥHGFHd + αΥHG
M
∑
i=1
˜ci˜si− ΥHGϵ + Υn (5.4) where Υ is the operation of CP removal. Furthermore, (5.4) can be derived as
v = ΥHGFHd + αΥHG˜c1˜s1+ αΥHG˜c2˜s2+· · · + αΥHG˜cMs˜M
− ΥHGϵ + Υn
= iOF DM + αHe˜c1s˜1 + αHe˜c2s˜2+· · · + αHe˜cMs˜M − Heϵ + ˜n
= iOF DM + α˜h1s˜1 + α˜h2s˜2+· · · + α˜hM˜sM − Heϵ + ˜n
(5.5)
where He is a circular matrix of channel impulse response h, ˜h1 = He˜c1, ˜h2 = He˜c2,· · · , ˜hM =
After N matched filter banks, we obtain vector z = z1 z2 .. . zN = hH 1v hH 1h1 hH 2v hH 2h2 .. . hHNv hH NhN (5.6)
Where h1 = Hec1,· · · , hN = HecN. Then, the largest M elements in z are chosen as the
esti-mated clipped signals.
For example, consider the case that h1is to be matched. Since h1 can be written as
h1 = ΥHGc1 = Hec1 = [ c1 c2 · · · cL ] α1 α2 .. . αL , (5.7)
Figure 5.3: Example of a bank of correlators that matches to h1.
In addition, the performance of matched filter can be improved by sequentially matching the larger peaks and subtracting the corresponding interference. By using the modified matched filter, the interference to each code can be lightened. The algorithm is described as follows
Algorithm 1 Sequentially-matched filter Initial ˆϵN×1 = 0N×1 for m = 1 ; m ≤ M ; m + + do zN×1 = 0N×1 for n = 1 ; n≤ N ; n + + do aN×1 = αHecn= αhn z(n) = (aHa)−1aHv end for
Find maximum z(n∗) as the detected clipped signal and save it in ˆϵ(n∗)
Subtract the interference of the reconstructed CDMA signal:v = v− αHecn∗z(n∗)
end for
As a result, the ˆϵN×1is the detected clipped vector.
5.4
Quasi-exhaustive peak position searching algorithm
Although the matched filter receiver is an intuitive method to detect peaks, we have no idea what the best receiver in this problem is. In the following, we will analyze the problem mathematically and find an optimal and a suboptimal solutions. In order to further improve the performance, we rewrite (5.4) as v = HeFHd + αHe [ c1 c2 · · · cN ] ϵ− Heϵ + Υn = He(αC− I)ϵ + ¯n = Aϵ + ¯n (5.8)
Here, we combine clipped vector and CDMA signal as the desired signal, where C is a matrix containing different phase code vector ci, i = 1· · · N, ¯n is the effective noise including OFDM
In order to estimate ϵ more precisely, we need to find the correct code phases that carry the clipped signals. In the following , we introduce exhaustive and quasi-exhaustive peak position searching algorithms to find the code phases accurately. Because only M elements in ϵ are nonzero, the best method to find the code phases is exhaustively searching all combinations. We assume M peaks in ϵ and calculate the corresponding matched filter matrix.
¯
A = He(αCM − IM) (5.9)
where CM and IM are the M column vectors in C and I corresponding to M nonzero elements
in ϵ
Algorithm 2 Exhaustive peak position searching algorithm
Initial J = 1,A∗ = 0N×M
repeat
Select M column vectors in C and I without repetition Calculate ¯A = He(αCM − IM)
Calculate ˆϵM×1 = ( ¯AHA)¯ −1A¯Hy
Assign ˆϵM×1 ⇒ ˆϵN×1according to which column vectors have been selected.
Calculate ¯J =∥v − He(αC− I)ˆϵN×1∥
if ¯J < J then J = ¯J , A∗ = ¯A end if
until All possible combinations of code phases are searched and the A∗ is the ML matched filter matrix.
However, due to the high complexity of exhaustive peak position searching algorithm, we apply an alternative quasi-exhaustive peak position searching algorithm. In the following, we introduce the quasi-exhaustive peak position searching algorithm.
Algorithm 3 Quasi-exhaustive peak position searching algorithm Initial C∗M = 0N×M for m = 1 ; m ≤ M ; m + + do for n = 1 ; n≤ N ; n + + do ˆ ϵN×1 = 0N×1 Cm = arrange [ cn C∗m−1 ] in right order. A = He(αCm− Im)→ ˆϵm×1= (AHA)−1AHy ˆ ϵm×1 → ˆϵN×1 → Jn=∥v − He(αC− I)ˆϵN×1∥ end for
Find minimum Jn∗ and save n∗ as the clipped index
C∗m ← cn∗
end for
A∗ = He(αC∗M − IM)
5.5
Best linear unbiased estimator(BLUE)
From the above, we know that the best matched filter matrix is A∗ = He(αC∗M − IM). The
suboptimal peak value estimation can be found by LS solution. Then, the estimated M clipped peak values are
ˆ
ϵ∗M = (A∗HA∗)−1A∗Hv (5.10)
The estimated M clipped peak values are assigned to ˆϵ corresponding to the estimated code phase position.
By Gaussian-Markov Theorem [12], we know that if the data are of general linear model form
v = A∗ϵM + ¯n (5.11)
and ¯n is a N × 1 noise vector with zero mean and covariance Rc, then the best linear unbiased
estimator(BLUE) of ϵM is ˆ
ϵ∗M = (A∗HR−1C A∗)−1A∗HR−1C v (5.12)
where RCis the covariance matrix given by
Rc =E{¯n¯nH} =E{(HeFHd + Υn)(HeFHd + Υn)H} = HeHHe + σ 2 nI (5.13)
If the data are truely Gaussian, then the BLUE is also the minimum variance unbiased estima-tor(MVUE). Afterwards, the OFDM signal will be recovered by reconstructing the estimated clipped vector to the received signal and subtracting the reconstruction of CDMA signal from the OFDM signal.
5.6
Simulation results
Table 5.1: Simulation parameters
Channel model Veh-A channel
Bandwidth 5MHz
Subcarrier spacing 19.53kHz
Power delay profile [0,-1,-9,-10,-15,-20](dB)
FFT 256
CP length 64
Code PN code
Code length 256
OFDM modulation 16QAM
Clipped peaks number 1/2
Clipping ratio 0.2/0.2
Power ratio2 2.5/2.5
Clipping threshold 9dB
In Fig.5.4-Fig.5.5, because a portion power of the OFDM signal is used to transmit the clipped signal carried by the CDMA, the original BER distortion is about 1.46dB. Nevertheless, there is still additional BER degradation owing to the imperfect clipped vector reconstruction and interference cancellation. Finally, the BER distortion becomes more and more serious when the number of clipped signals increases. Thus, the number of clipped signals should be constrained to prevent the BER from serious degradation. Furthermore, in Fig.5.4-Fig.5.5, it is apparent that BLUE and sequentially-matched filter have similar BER performance, whereas the compu-tational complexity of sequentially-matched filter is significantly less than BLUE. Hence, the sequentially-matched filter is a better receiver in both BER performance and complexity.
In Fig.5.6, the PAPR reduction performance of the proposed scheme is compared to the
clipping method. As the clipping threshold is 9 dB, the high PAPR OFDM signals have some PAPR regrowth at 9 dB threshold. This is because there are several high peaks in the high PAPR OFDM signals that are clipped with only few peaks. Therefore, the PAPR reduction performance is limited.
Figure 5.4: BER performance of clipped-OFDM with CDMA signal. The clipping number=1, clipping ratio=0.2 and power ratio=2.5
Figure 5.5: BER performance of clipped-OFDM with CDMA signal. The clipping number=2, clipping ratio=0.2 and power ratio=2.5
Figure 5.6: PAPR reduction performance with different clipping number, clipping ratio=0.2 and power ratio=2.5.
CHAPTER
6
Conclusion
In the first method, we provide an additional CDMA channel to transmit the index of phase sequence.It’s PAPR reduction capability is similar to traditional SLM method. In addition, by designing the power coefficient α related to a predefined SINR β, the BER of the CDMA signal can be controlled. Then, the BER degradation of OFDM can be maintained in an acceptable range.
In the second method, we use filters to reduce the PAPR of OFDM signals. We pro-pose two filtered-OFDM methods:the FIR pre-filtering(FIRP) method and the all-pass filter pre-filtering(APFP) method. The FIRP method has better PAPR reduction performance when more filter taps are used as well as more alternative filtered-OFDM signals are generated. Ad-ditionally, in order to avoid the frequency-selectivity enhancement caused by FIRP method, the APFP method is proposed. The PAPR reduction performance of the APFP method is inferior to the FIRP method, but the BER degradation of the FIRP method can be lightened significantly
by using the APFP method. By using 32 pilot subcarriers to estimate the effective channel fre-quency response, the BER degradation is about 1.5 dB. In addition, by using 12 pilot subcarriers to estimate the effective channel in time domain, the BER degradation is about 3 dB.
In the third method, we only clip few peaks from the high PAPR OFDM signals. However, because a portion power(power ratio=2.5) of the OFDM signal is used to transmit the clipped signals carried by the CDMA, the original BER distortion is about 1.46 dB. On the other hand, there is still additional BER degradation owing to the imperfect clipped vector reconstruction and interference cancellation. Finally, the clipped OFDM signal can be restored with an acceptable distortion range. Nevertheless, its PAPR reduction performance is limited because only few peaks are clipped.
We compare the PAPR reduction performance and the BER distortion in Table 6.1. From the previous simulation results, we observe the following results. The PAPR reduction perfor-mance of SLM with CDMA method is better than FIRP, APFP and clipping method. The PAPR reduction performance of clipping scheme is inferior to other methods. Next, the FIRP and clip-ping method suffer from severe BER distortion. The SLM with CDMA and APFP method have slight BER distortion.
In Table 6.2, the complexity of transmitter is presented, and we observe the following facts. First, the clipping method does not require complex multiplications. Second, the APFP method has less complex multiplications compared to the SLM with CDMA method. Third, the FIRP method requires more complex multiplications when more filter taps are used for fixed U .
In Table 6.3, the complexity of receiver is shown, and we observe the following facts. First, the clipping method requires high complex multiplications due to peaks searching and equalization. Second, the SLM with CDMA method also requires more complex multiplications since complicated equalization is required. Third, compared to the SLM with CDMA and the clipping method, the filter method has lower complexity, for only channel estimation is needed.
Table 6.1: Comparison of three methods
SLM with CDMA Clipping FIRP OFDM APFP OFDM
(without coding)
PAPR reduction high low medium medium
Distortion low high high low
Table 6.2: Comparison of Tx complexity Tx Complexity Complex multiplications
SLM with CDMA U N logN
Lf taps FIRP LfN U
APFP 2N U
Table 6.3: Comparison of Rx complexity
Rx Complexity Complex multiplications
SLM with CDMA M3+ 2M2N + M N + N2M + N logN
Lf taps FIRP with
L3+ 2L2P + 2LP + N logN
time domainchannel estimation APFP(effective channel length=L) with
L3+ 2L2P + 2LP + N logN
time domainchannel estimation APFP with
2N logN frequency domainchannel estimation
Clipping(matched filter) 2N2 Clipping 2N2M (sequentially-matched filter ) Clipping(LS) M3+ 2M2N + M N + ∆ Clipping(BLUE) 2N3+ M3+ 2M2N +2N2M + M N + ∆ Clipping ∆ =∑Mm=1[N (m3+ N2m + 2N m2+ 2N m)]
Bibliography
[1] R.W.B¨auml, R.F.H.Fischer, and J.B.Huber,“Reducing the peak-to-average power ratio of
multicarrier modulation by selected mapping,”Electron Lett, vol. 32, pp. 2056-2057, Oct. 1996.
[2] S.J.Heo, H.S.Noh, J.S.No, and D.-J.Shin,“A modified SLM scheme with low complexity for PAPR reduction of OFDM systems,”IEEE Trans. Broadcast, vol. 53, no. 4, pp. 804– 808, Dec. 2007.
[3] C.-L.Wang, M.-Y.Hsu, and Y.Ouyang,“A low-complexity peak-to-average power ratio re-duction technique for OFDM systems,”in Proc. 2003 IEEE Global Telecommun. Conf.
(GLOBECOM 2003), San Francisco, CA, pp. 2375-2379, Dec. 2003.
[4] C.-L Wang and Y.Ouyang,“Low-complexity selected mapping schemes for peak-to-average power ratio reduction in OFDM systems,”IEEE Trans. Signal Process., vol. 53, no. 12, pp. 4652–4660, Dec. 2005.
[5] L.J.Cimini and N.R.Sollenberger,“Peak-to-average power ratio reduction of an ofdm signal using partial transmit sequences,”IEEE Commun. Letters, vol. 4, no. 3, pp. 86–88, Mar. 2000.
[6] B.S.Krongold and D.L.Jones,“An active-set approach for OFDM PAR reduction via tone reservation,”IEEE Trans. Signal Process., vol. 52, no. 2, pp 495-509, Feb. 2004.
[7] R.van Nee and A. de Wild,“Reducing the peak-to-average power ratio of OFDM,”in 48th
IEEE Veh. Technol. Conf., vol. 3, Ottawa, ON, Canada, pp. 2072–2076, May 1998.
[8] X. Li and L. J. Cimini Jr.,“Effects of clipping and filtering on the performance of OFDM,”Proc. IEEE 47th Veh. Technol. Conf., pp. 1634–1638, 1997.
[9] L. Wang and C. Tellambura,“A simplified clipping and filtering technique for PAR reduc-tion in OFDM Systems,”IEEE Signal Process. Letters, vol. 12, no. 6, pp. 453-456, June 2005.
[10] D. Kim and G. L. Stuber,“Clipping noise mitigation for OFDM by decision-aided recon-struction,”IEEE Commun. Letters, vol. 3, no. 1, pp. 4–6, Jan. 1999.
[11] D.-W. Lim, S.-J. Heo, and J.-S. No,“An overview of peak-to-average power ratio reduction schemes for OFDM signals,”J. Commun. Netw, vol. 11, no. 3, pp. 229–239, June 2009.
[12] S. M. Kay,Fundamentals of Statistical Signal Processing: Estimation Theory, Englewood Cliffs, NJ: Prentice-Hall, 1993.
[13] E. Hong and D. Har, “Peak-to-average power ratio reduction in OFDM systems using all-pass filters,”IEEE Trans. Broadcast, vol. 56, no. 1, pp. 114–119, Mar. 2010.
APPENDIX
A
Problem Formulation for Tone Reservation [6]
Using the reserved tones to derive a peak-cancelling signal c, the PAR of DMT signal can be reduced. Adding c to the data-bearing signal x produces the new composite signal.
¯ x = x + c = FH(X + C) (A.1) Where x = [x[0]· · · x[N − 1]]T, c = [c[0]· · · c[N − 1]]T, X = [X 0· · · XN−1]T and C =
[C0· · · CN−1]T. With PAR defined as
PAPR(¯x) = max|x[n] + c[n]| 2
E[|x[n]|2] (A.2)
For distortionless data transmission, the vectors X and C cannot both be nonzero on a given DMT tone, i.e., Xk+ Ck = Xk, k∈ Uc Ck, k∈ U (A.3)
whereUc represents the set of data-bearing subchannels andU represents the set of available
subchannels for PAR reduction.
A minimax PAR problem can be formulated as
C∗ = arg min
C∈C∥F
H(X + C)∥
∞ (A.4)
where FH is the IFFT operator andC is the signal space of all possible peak-compensation signals