‐ 1 ‐
Using Balanced Scorecard and System Dynamics in Exploring the
Performance of Taiwan's Pharmaceutical Industry
李亭林 楊淑涓
國立高雄大學 國立高雄大學
亞太工商管理學系 亞太工商管理學系
linda_lee@nuk.edu.tw m0987115@mail.nuk.edu.tw
Abstract
“Balanced Scorecard (BSC)” is one of the popular performance measure methods which can translate the strategy into a set of clear performance indicators and manage the status of implementing the strategy. However, BSC is unable to simulate the complicated environment, to be short of the strategy’s simulation, and usually used on business unit level, only few studies have ever tried to use it on other levels. Therefore, this study tries to combine BSC with SD to explore Taiwan’s pharmaceutical industry that had formulated the relevant strategy of development since 1982 but its contribution is still limited at present. Based on four perspectives of BSC, the related indicators will be conducted. Mainly, the purpose of this study is to investigate and build the complex system of Taiwan’s pharmaceutical industry, and amend the policy direction to enhance its performance. This paper not only integrates the research tools and gives the suggestions to improve the performance of this industry, but also assists Taiwan in becoming a R&D, manufacturing and operations center in Asia-Pacific region in the future.
Keywords:Balanced Scorecard, System Dynamics, Pharmaceutical Industry
Ⅰ. INTRODUCTION
Although the development of the pharmaceutical industry in Taiwan is later than America and Europe, but it's earlier than the emerging countries. In addition, because of near to the third-largest market “China”, Taiwan not only owns an important advantage of location in developing the pharmaceutical, but also plays an important role between the developed and developing countries. By the help of the government, the pharmaceutical industry had been developed since 1982, and the civil societies are also to invest heavily and to promote this industry. But, the contribution of this industry is still limited at present in Taiwan. Thus, over the past few years a considerable number of studies have been made on the performance of the pharmaceutical industry in Taiwan.
According to the article, “2010 White Paper on the biotechnology industry in Taiwan”, among the Asian countries, Singapore, South Korea, China, and India have been most successful in developing biotechnology, and retain double-digit biotech industry sales growth in ever year, yet Taiwan's biotech industry had total sales revenue of NT$210.5 billion in 2009, which represented growth of only 5% compared with 2008. Within the biotech sector as a whole, the pharmaceutical industry grew at a rate of only 1% (Industrial-Development-Bureau, 2010a). This result shows that this industry still needs to reinforce in Taiwan.
Since Robert S. Kaplan and David Norton proposed the concept “Balanced Scorecard” (BSC), it has been one of the most popular performance measure methods and also a strategic management approach. By this method, the organizational strategy can be translated into a set of clear performance indicators, and then to measure and manage the status of implementing the strategy. An organization that has strategies but always lacks the executions needs BSC. Taiwan’s pharmaceutical industry that had formulated the relevant strategy and objective of development since 1982 but still didn’t be developed to the best conditions occurs the same problem.
In general, BSC is usually used on the business unit level, and only few studies have ever tried to use it to analyze the performance of an industry of national development. Nevertheless, Science & Technology Policy Research and Information Center (STPI) point out that if use the concept of enterprise to promote to the industry, or the national level tool is applied to the enterprise level, it will help business and government to be more clearly to carry out the strategic planning and policy planning (David, 2008). Thus, the author attempts to use BSC on the industry level.
Furthermore, some literatures showed that the BSC theory and practice had some limitations. The root of limitations is “cause and effect are not closely related in time and space” (Tu, 2004). Although BSC is static, one-way causality link from bottom to top, unable to simulate the complicated environment and also fail to judge and certify the influence of events’ time-delay, but System Dynamics s can make up its deficiency (Tu, 2004; L. H. Wu, 2005). As a result, the author also tries to take BSC and SD as the research methods to investigate and model the complex structure, behavior and performance in the pharmaceutical industry in Taiwan.
The purpose of this study is to attempt to combine BSC with SD to explore the complex system and performance about the pharmaceutical industry in Taiwan, and then try to amend the policy direction of this
‐ 2 ‐
industry to enhance the performance in Taiwan. Our concerns are to report four objectives:
1. Based on four perspectives of BSC, to find the related indicators of the development to build the dynamic structure in this industry.
2. Mapping the stocks and flows diagram to simulate and analysis the development of this industry in Taiwan, then
3. Finding the key decision points which actually affect the performance of this industry in Taiwan.
4. According to the result of the policy testing to give the suggestions of amending the policy direction of this industry and then to enhance the performance in Taiwan.
Ⅱ. OVERVIEW OF TAIWAN'S PHARMACEUTICAL INDUSTRY
According to Industrial Development Bureau, Ministry of Economic Affairs in Taiwan, the pharmaceutical industry includes drug substance, western medicine, and Chinese herbal medicine. And the Law of Pharmaceutical Affairs which is the basis for market regulation defines the pharmaceutical industry as: “The pharmaceutical manufacturers in this law are meant the manufacturers who operate the manufacturing and working of drugs, products wholesale and export, and importation of raw materials for own use.” Therefore, the author considers that the pharmaceutical industry includes drug substance, western medicine, Chinese herbal medicine and their related industries and products.
Important Development Projects
Since 1982, Taiwan’s government identifies biotechnology as one of the eight key technologies, Academia Sinica set up the preparation office for the Molecular Biological Research Institute and the Biomedical Research Institute. In 2002, Executive Yuan reviewed and approved the Challenge 2008 six-year (2002-2007) national development plan, and then proposed a project named “Two Trillion Twin Star (2T2S) plan” to promote the pharmaceutical industry. Among these six years, the government had started to promote the more perfect plans of science and technology, enhance the laws and regulations about pharmaceutical industry, and build the related institutions and systems, such as the information network about drug regulations and clinical trial, research centers and experimental centers (Industrial-Development-Bureau, 2010b-a, , 2010b-b).
On the subjects of growing population, serious aging problem and an unspectacular growth rate in the emerging countries’ drugs market, the government included the biotechnology industry in “Six Key Emerging Industries”, and started a plan, “Diamond Action Plan for Biotech Takeoff” in 2009. The purpose of these plans is let government play an active role to invest and build the based environment, and then guide private investment funds to invest in the most efficient target with the help of venture capital experts.
Domestic Market Summary
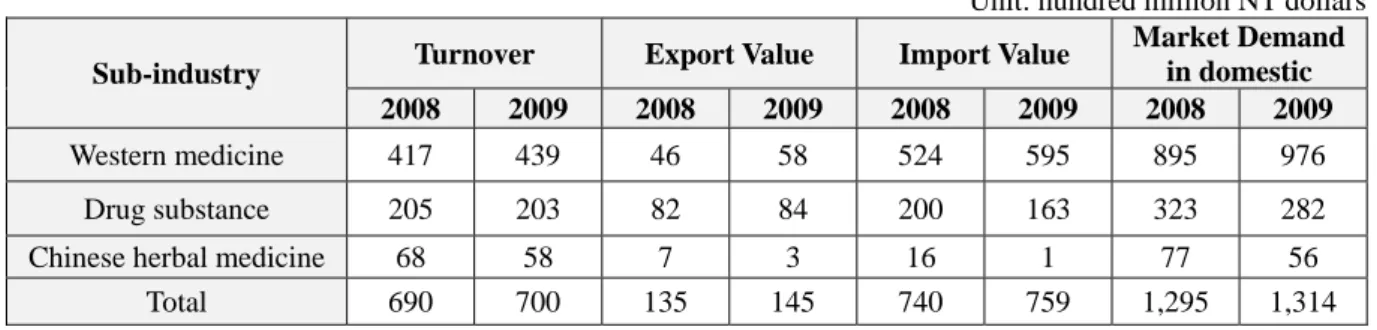
According to the report from Business-Monitor-International in 2010, Taiwan’s US$3.81 bn pharmaceutical market is the sixth largest in Asia Pacific. Annual per-capita spending on medicines is US$165, just above the regional average of US$142 (Business-Monitor-International, 2010). In Taiwan, the turnover of pharmaceutical industry is up to NT$70 billion in 2009, and the scale of western medicine is the biggest among this industry (Table 1). However, this table tells us that this industry grew at a rate of only 1% from 2008 to 2009 and export value was much less than import value. This reason is that the pharmaceutical market is dominated by foreign multinational firms selling patented medicines for chronic conditions. Although local drug markets specialize in generic medicines, they are increasingly engaging in original research to move up the value chain (Business-Monitor-International, 2010).
Table 1: Output value of the pharmaceutical industry in 2008 and 2009
Unit: hundred million NT dollars
Sub-industry Turnover Export Value Import Value
Market Demand in domestic
2008 2009 2008 2009 2008 2009 2008 2009
Western medicine 417 439 46 58 524 595 895 976
Drug substance 205 203 82 84 200 163 323 282
Chinese herbal medicine 68 58 7 3 16 1 77 56
Total 690 700 135 145 740 759 1,295 1,314
Source: (Industrial-Development-Bureau, 2010a)
Research Boundary
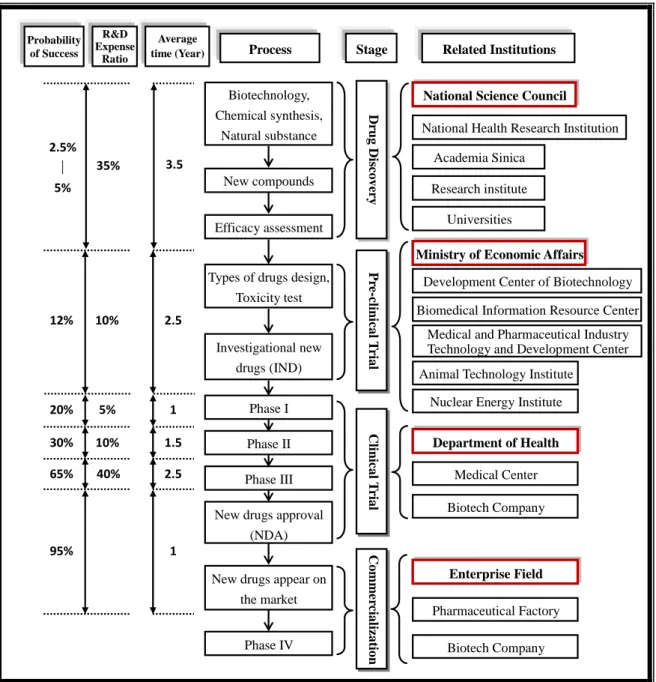
In this study, the discussion will be limited to two parts. First one is concentrated on the value chain (Figure 1) and R & D system about the pharmaceutical industry, including the interaction between the companies, government, academic and research agencies in Taiwan (Figure 2) and the four perspectives of BSC. The second
‐ 3 ‐
Process Related Institutions
Dru g D iscov ery Biotechnology, Chemical synthesis, Natural substance New compounds Efficacy assessment
National Science Council
Pr e-clini cal T rial
Types of drugs design, Toxicity test Investigational new drugs (IND) Phase II Clinic al T rial
New drugs approval (NDA) Phase I
Phase III
New drugs appear on the market Comm e rcial izat io n Phase IV
National Health Research Institution Academia Sinica
Research institute Universities
Ministry of Economic Affairs
Development Center of Biotechnology Biomedical Information Resource Center
Medical and Pharmaceutical Industry Technology and Development Center Animal Technology Institute
Nuclear Energy Institute
Biotech Company Medical Center Department of Health Enterprise Field Biotech Company Pharmaceutical Factory R&D Expense Ratio Stage Probability of Success 35% 10% 5% 10% 40% 2.5% │ 5% 12% 20% 30% 65% 95% Average time (Year) 3.5 2.5 1 1.5 2.5 1 R&D Manufacturing Warehousing and Distribution Marketing Service
Drug Discovery Pre-clinical Trial Clinical Trial Commercialization
is focused on the relevance between the technological policy and the development of the pharmaceutical industry. Out of these parts, like foreign direct investment (FDI), ethics, or political elections are not the scopes of this paper.
Figure 1: The value chain of the pharmaceutical industry in Taiwan Source:(Deng, 2007; H. H. Wang, 2004)
Figure 2: The R & D system of the pharmaceutical industry in Taiwan Source: (Deng, 2007; F. C. Lee, 2003); This Study
‐ 4 ‐ The Direction of Development
According to “Diamond Action Plan for Biotech Takeoff”, “National Science and Technology Program for Biotechnology and Pharmaceuticals (NSTPBP)” and “2010 White Paper on the biotechnology industry in Taiwan”, this study integrate the visions, strategies and objects about the development of Taiwan’s pharmaceutical industry as below:
• Vision:
Establish Taiwan as an important part of international biotechnology community development and commercialization and assist Taiwan in becoming a R&D, manufacturing and operations center of biotechnology in Asia-Pacific region.
• Strategy:
1. Strengthen the role of R & D in this industry’s value chain; focus on the industrial application development of R & D results, and help the research result smoothly transfer to industry.
2. Continue to promote the output of successful investment cases in biotechnology industry.
3. Integrate the limited sources and the channel of communication to promote the co-operation among industry, government, academic and the institute, and then form a virtual R & D team of efficiency to contribute to the output of domestic drugs.
4. Shorten the time to market, build a good investment measures and environmental, and establish an alliance about drug export to expand domestic and foreign markets.
5. Expand the training and recruiting of biotechnology talent.
6. Improve Taiwan’s pharmaceutical legal and regulatory environment.
• Objective:
1. The turnover of the biotechnology industry average growths 25% per year in the next 5 years and drive 150 billion investments (From 2003 to 2007).
2. Increase R&D contribution in the field of biotechnology to some 3% of GDP by 2014.
3. Increase the annual output value of biotech industry to more than TWD1trn (US$30.86bn) in four years (2010~2014).
Ⅲ. LITERATURE REVIEW
Balanced Scorecard (BSC)Since Kaplan and Norton published their first article on the balanced scorecard, “The Balanced Scorecard: Measures that Drive Performance” in 1992, this concept has been one of the most important management innovations of the 20th century. The traditional performance measurement methods are almost focused on the financial perspective, thus most companies place on short-term financial measures leave a gap between the development of a strategy and its implementation (Kaplan & Norton, 1996a). There is a characteristic of time-delay for many strategies to bring the results, take the pharmaceutical industry for example. It is a long-term action to invest in the drug development: 12 years on average (Deng, 2007). Because the results brought by the investment project could not show on the financial statements instantly, these investments are always treated as the expense item.
Different from the traditional methods, the balanced scorecard supplemented traditional financial measures with criteria that measured performance from three additional perspectives – those of customers, internal business processes, and learning and growth (Kaplan & Norton, 1996a). This measurement is an integral part of the mission identification, strategy formulation, and execution processes, with a focus on translating strategy into an integrated set of financial and non-financial measures (Chow, Ganulin, Teknika, Haddad, & Williamson, 1998). Four perspectives and their relationships are introduced as followed:
Four Perspectives of BSC
• Learning and Growth: “Can we continue to improve and create value?”
An organization’s ability to innovation, learning, and improvement implicates directly to the organization’s value (Kaplan & Norton, 1992). Organizational learning and growth come from three principal sources: people, systems, and organizational procedures (Kaplan & Norton, 1996b). They are the drivers of success for the financial, customer, and internal business process objectives. In this dimension, the staffs’ competence, technological structure, and culture must be clarified, then the organization will be able to adjust the human resources and information technology to act in concert with the mission and strategy (Kaplan & Norton, 2000).
• Internal Business Processes: “What must we excel at?”
Customers’ concerns tend to fall into four categories: time, quality, performance and service, and cost (Kaplan & Norton, 1992). This perspective asks what must be done internally to meet and exceed the customers’ need (Brewer & Speh, 2000). Thus, the internal measures for the balanced scorecard should stem from the business processes that have greatest impact on customer satisfaction (Kaplan & Norton, 1992). According to
‐ 5 ‐
Kaplan and Norton’s report (1996b), the internal business processes include three parts: innovation cycle – the long-wave of value creation, operations cycle – the short-wave of value creation, and post-sale service cycle – the middle-wave of value creation. Therefore, a comprehensive strategy should be pursued at these parts in the overall improvement of internal processes, and then to generate the revenue (Kaplan & Norton, 2000).
• Customer: “How do customers see us?”
The purpose of this perspective is to measure the organization’s ability to achieve overall customer satisfaction. No matter the measures chosen are general, such as those focusing on customer value, and customer retention, or they are specific addressed a dimension of customer value such as product and service quality, response time, flexibility, or cost, they should capture customer opinion (Brewer & Speh, 2000). To put the balanced scorecard to work, organizations should articulate goals for what customers’ concerns and then translate these goals into the core outcome measures (Kaplan & Norton, 1992). Kaplan and Norton (1996b) consider that the core outcome measures include customer satisfaction, customer retention, new customer acquisition, customer profitability, and market and account share in targeted segments.
• Financial: “How do we look to shareholders?”
Based on the above three dimensions, this perspective is focused on the ability to make profit; it includes measures such as operating income, revenue growth, cost reduction, asset utilization and economic value added (Bader, 2007; Kuo, 2004). On the other hand, it also indicates whether the strategy, implementation, and execution are contributing to bottom-line improvement (Kaplan & Norton, 1992). At the different stage of the life cycle, an organization should development different financial indicators to link with its different strategical goals. Kaplan and Norton (1996b) take an example to show how the balanced scorecard can be used to make explicit the financial strategy of a business unit, and how to customize financial objectives and measures to business unit strategy.
Cause and Effect Relationships
A strategy is a set of hypotheses about cause and effect (Kaplan & Norton, 1996b). The balanced scorecard links a series of strategies, objectives and measures that are both consistent and mutually reinforcing (Kaplan & Norton, 1996b). Thus, Kaplan and Norton (1996b) assume the balance scorecard is like a flight simulator, it should incorporate the complex set of cause-and-effect relationships among the critical variables and feedback loops that describe the trajectory, the plan, and the strategy.
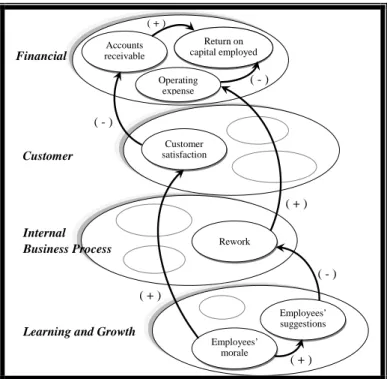
The chain of cause and effect should pervade all four perspectives of a balanced scorecard (Kaplan & Norton, 1996b), and the relationship between these perspectives is: measures of organizational learning and
growth → measures of internal business processes → measures of the customer perspective → financial measures (Nørreklit, 2000), see Figure 3. Therefore, the learning and growth perspective is the root of the
scorecard, and the measures of the learning and growth perspective are the drivers of the internal business processes. Similarly, the measures of the internal business processes are the drivers of the measures of the customer perspective, and the drivers of the financial measures come from the customer perspective (Kaplan & Norton, 1996b; Nørreklit, 2000).
The emphasis on cause and effect in constructing a scorecard introduces dynamic systems thinking. It enables individuals in various parts of an organization to understand how the pieces fit together, how their role influences others and, eventually, the entire organization (Kaplan & Norton, 1996c).
The Limitations of BSC
Although BSC contains outcome measures and the performance drivers of outcomes, linked together in cause-and-effect relationships, and thus aims to be a feed-forward control system (Nørreklit, 2000). Nevertheless, a number of inherent weaknesses have also been reported in the BSC literature (Akkermans & Oorschot, 2002). These disadvantages are described below.
1. Cause and effect are not closely related in time and space: BSC measures cause and effect at the same
time without considering any time lag, so it has no time dimension (Nørreklit, 2000). This limitation which is fail to judge and certify the influence of events’ time-delay causes the user focus on the short-term object and ignore the long-term influence(Tu, 2004).
2. Unidirectional causality too simplistic: The use of causal-loops alone is seen as problematic because
these loops do not capture the notion of strategic factors accumulating and depleting (Akkermans & Oorschot, 2002). Nørreklit (2000) even questions the existence of the one-way causality which only links from bottom to top between the areas of measurement in the BSC. This author believes that the relationship is more one of interdependence, or bi-directional causality (Akkermans & Oorschot, 2002). As Kaplan and Norton's point of view, promoting the BSC should be based on the balanced development of the four dimensions, and focus on the strategy alignment between four dimensions. However, because of these limitations, the decision makers will make the wrong decisions and actions. Thus, the related scholars have addressed various studies about using “System Dynamics” to support and improve the BSC.
‐ 6 ‐ Employees’ suggestions Employees’ morale Rework Customer satisfaction Return on capital employed Operating expense Accounts receivable ( - ) ( - ) ( - ) ( + ) ( + ) ( + ) ( + ) Financial Customer Internal Business Process
Learning and Growth
Figure 3: How to linked measures from the four perspectives Source: Kaplan and Norton, 1996a
System Dynamics (SD)
The theory of System Dynamics was developed in the late 1950s and early 1960s by Jay W. Forrester of the Massachusetts Institute of Technology (MIT). He and his associates started pursuing feedback concepts in the research of what was originally called “Industrial Dynamics”. After the study, he realized that the name of “Industrial Dynamics” was restraining the idea that the approach could be applied to complex systems in several disciplines. Thus, he renamed it as “System Dynamics”. In contrast with other theories such as the input-output model, the econometrics model, or the economics of control model, System Dynamics emerged and currently provides a strong theoretical basis for analyzing such systems, in terms of nth-order, non-linear, long-term, quantitative analyses (Y. L. Lee, 2002; Su, 1988).
Forrester explains that SD is an approach which combines the theory, methods, and philosophy needed to analyze the behavior of systems. It can provide a common foundation that can be applied wherever we want to understand and influence how things change through time in not only management, but also in environmental change, politics, economic behavior, medicine, engineering, and other fields (Forrester, 1991).
Coyle (1996) defines SD as a method that through qualitative and quantitative models to describe, design, and model robust information feedback structures and control policies through simulation and optimization. Coyle claims that managers can use System Dynamics s to deal the time-dependent behavior of managed systems, and understand interrelationships among variables influence the behavior of the system over time (Coyle, 1996; Suryani, 2010).
Sterman (2000) considers that learning about complex dynamic systems requires more than technical tools to create mathematical models. In addition to be grounded in the theory of nonlinear dynamics and feedback control developed in mathematics, physics, and engineering, SD also draws on cognitive and social psychology, economic, and other social sciences. Thus, SD is fundamentally interdisciplinary and very suitable to support managers to learn and understand complex systems (Sterman, 2000).
Su (1988) describes System Dynamics s as a quantitative method that is based on the theory of feedback control and takes the computer simulation as a mean to study the complex social and economic systems (Su, 1988). Han (2002) also emphasizes that the application of System Dynamics s must be based on system thinking to build the system model, and takes the computer simulation as a mean to verify the system behavior. By this application, we can truly grasp the essence of System Dynamics s, and then understand the superiority and uniqueness of System Dynamics s (Han, 2002).
According to the above description, we can know that System Dynamics s which is based on the theory of nonlinear dynamics, system thinking and feedback control is a method to understand how things change and the influence over time. The framework of SD is focused on systems thinking, but takes the additional steps of constructing and testing a simulation model (Suryani, 2010). By applying computer simulation, SD can show how structure, policies, decisions and time delays within organizations and business systems are interrelated and influence growth and stability (Y. L. Lee, 2002), and further help us to learn about dynamic complexity and the
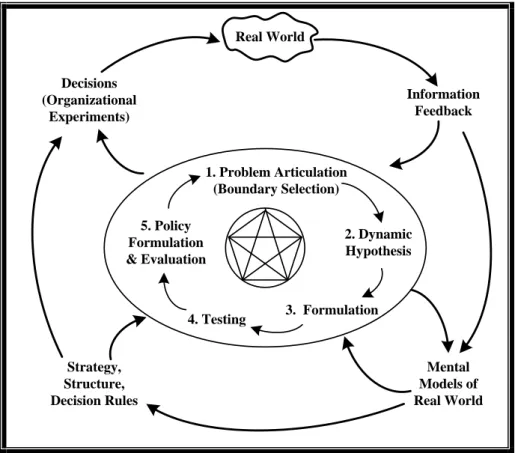
‐ 7 ‐ 1. Problem Articulation (Boundary Selection) 2. Dynamic Hypothesis 3. Formulation 4. Testing 5. Policy Formulation & Evaluation Information Feedback Decisions (Organizational Experiments) Strategy, Structure, Decision Rules Mental Models of Real World Real World
sources of policy resistance, and provide more effective policy suggestions (Sterman, 2000).
The Modeling Process of System Dynamics
Since Forrester (1961) proposing SD to now, there have been many kinds of SD modeling processes, but the main steps are almost the same. Here, the author uses the modeling process proposed by Sterman (2000) to provide a whole picture of the implementation of modeling real world problems.
According to Sterman (2000), there are five essential steps to modeling that are characteristics of all successful modeling efforts:
1. Articulating the problem to be addressed (Boundary Selection): In this most important step, the
modeler needs to select the theme or problem, identify key variables, decide the time horizon, and dynamic problem definition (reference modes);
2. Formulating a dynamic hypothesis about the causes of the problem: The modeler needs to generate the
initial hypothesis, explain the endogenous consequences of the feedback structure, and map boundaries, subsystems, causal loops, stock and flow diagrams, etc.;
3. Formulating a simulation model to test the dynamic hypothesis: After converting the causal loop
diagram into the stock and flow diagram, the modeler should specify how the system description is translated into level, rate and auxiliary equations. The modeler also needs to illustrate the estimation of parameters, behavioral relationships, and initial conditions.
4. Testing the model until satisfied that it is suitable for the purpose: In this phase, the modeler should
compare with reference modes, and examine the robustness and sensitivity under extreme conditions. Many other tests also must be thorough and continuous testing to build confidence in the model.
5. Designing and evaluating policies for improvement: This step is including about scenario specification,
policy design, the effects of policies, sensitivity analysis, and interactions of policies. Because the real systems are highly non linear, the impact of combination policies is usually not the sum of their impacts alone.
The modeling process which embedded in single- and double-feedback learning loops is showed in Figure 4. Iteration can occur from any step to any other step (indicated by the interconnections in the centre of the diagram). Simulation models are informed by our mental models and by information gathered from the real world. Figure 4 also shows an effective modeling involves the constant iteration between experiments and learning in the virtual world and in the real world (Y. L. Lee, 2002; Sterman, 2000).
Figure 4: Modeling is embedded in the dynamics of the system Source: (Sterman, 2000)
‐ 8 ‐
Ⅳ. RESEARCH DESIGN
Research Framework
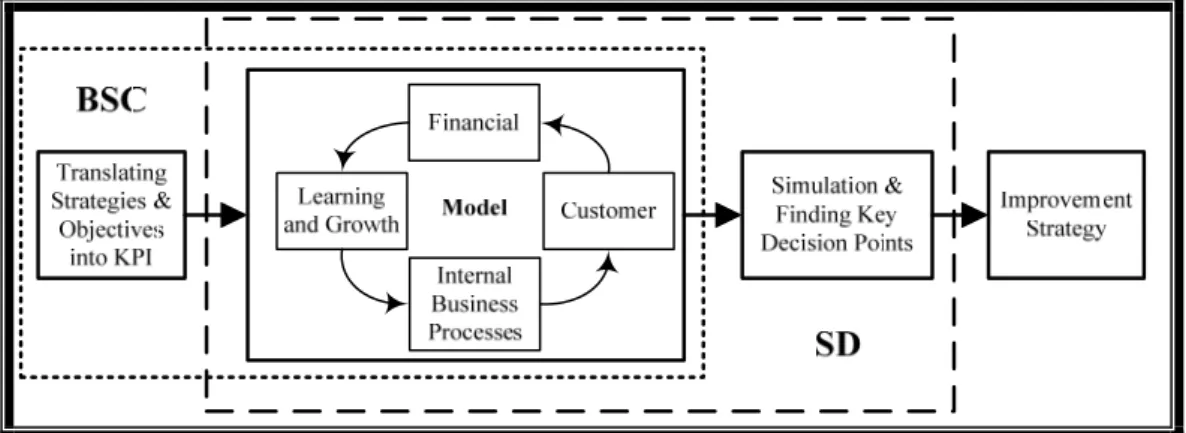
This study is distinguished in to four parts (Figure 5). Based on four perspectives of BSC, the first section is translating strategies and objectives into KPI which is sorted out from literature review and expert interviews. Second, according to the concepts of BSC and SD we build the model of this research. Sequentially, the author applies the computer simulation to find the key decision points which actually affect the performance of pharmaceutical industry in Taiwan. Finally, the author will propose the improvement strategies.
Figure 5: The conceptual structure of this research
Data Collection, Research Period and Simulation Tool
Because all variables in the model of System Dynamics should be measurable that this research needs some datum to simulate (Chin, 2009). It is for this reason that the author collects second data from many databases, including “Science and Technology Statistics Database”, “Medical and Pharmaceutical Industry Technology and Development Center”, “Science and Technology Policy Research and Information Center”, “National Statistics”, “Food and Drug Administration”, and so on.
In the process of collecting second data, there are some missing values and some variables even have no related data. According to Su (1988), SD model is based on the system structure rather than the statistical correlation, and the focal point of building model is to understand the interactive relationship and the mutative trend. Thus, the accuracy of parameter values will not affect the operation of the model (Su, 1988). In another word, some parameter values can be estimated reasonably when we can’t collect the related data. The methods about estimated the parameter values are described as below:
1. To fill the missing values in the middle by interpolation or extrapolation. 2. Interviews with experts, such as Delphi, Questionnaire and so on.
3. Refer to the relevant studies, including books, newspapers, magazines, local records and theses.
4. Reasonable guess: Setting two extreme values and then finding a reasonable value between the extreme values. This method is considered only when other methods cannot be used (Su, 1988).
The data collection covers the period during AD 2001 to AD 2009. Simulation time is expected to AD 2020. Related data collection, estimate and sources have been order in Appendix I.
At present, the main System Simulation Tools including: iThink, STELLA, Vensim and so on. In this study, the author used Vensim DSS for Windows Version 5.6a which was developed by Ventana Systems, Inc. to execute the simulation.
Expert Interview
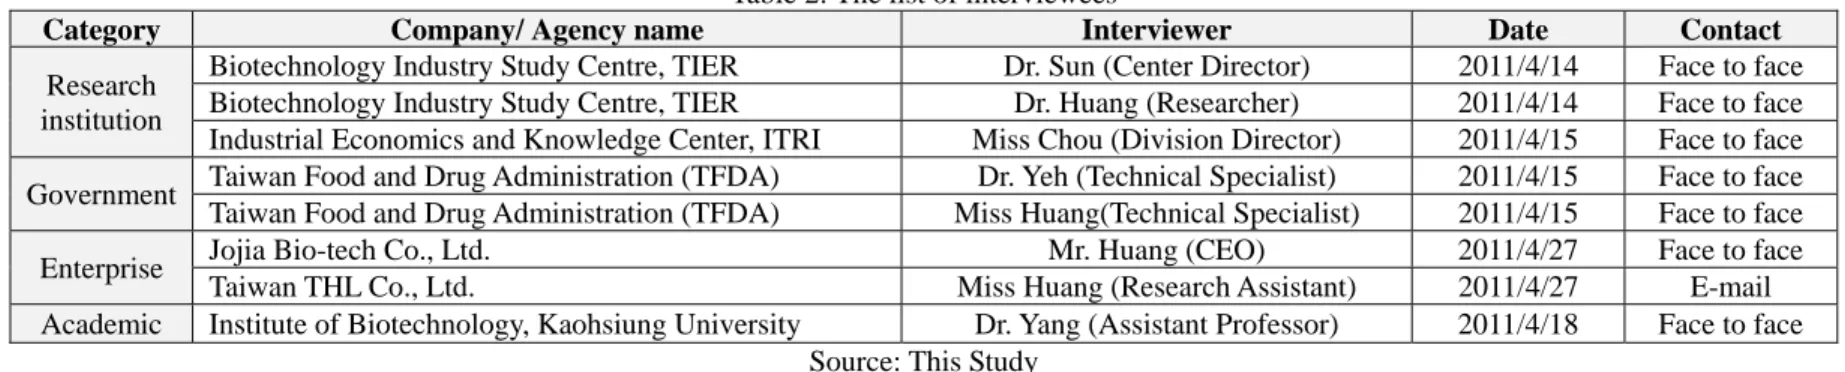
In this research, expert interview is designed with the aims of to confirm the relationship between each variable and to estimate the parameters value of some variable. The development of pharmaceutical industry is a complex interaction between enterprise, government, research and academic institutions, therefore, the objects of interview are distributed in four categories. The list of interviewees is outline as Table 2.
The Main Variables of Four Dimensions
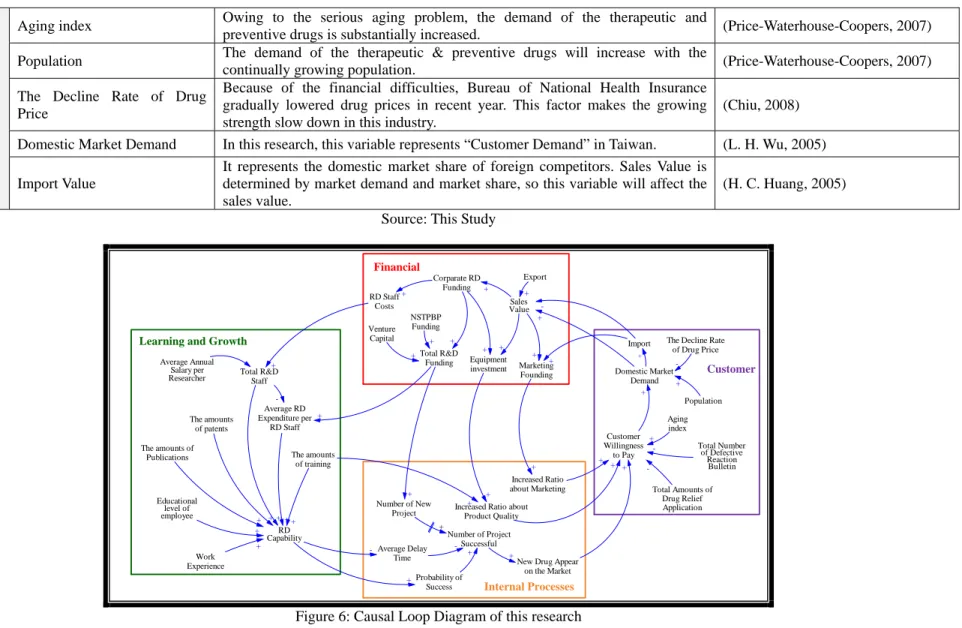
According to BSC, most of people accept the representative balanced scorecard including at least four perspectives, including “Learning and Growth”, “Internal Processes”, “Customer” and “Financial”. Thus, the author takes these perspectives as the research dimensions in this study. Based on the development strategy and the literature review, the measured variables of four dimensions are selected and classified as Table 3. And the Causal Loop Diagram is built as Figure 6.
‐ 9 ‐
Table 2: The list of interviewees
Category Company/ Agency name Interviewer Date Contact
Research institution
Biotechnology Industry Study Centre, TIER Dr. Sun (Center Director) 2011/4/14 Face to face
Biotechnology Industry Study Centre, TIER Dr. Huang (Researcher) 2011/4/14 Face to face
Industrial Economics and Knowledge Center, ITRI Miss Chou (Division Director) 2011/4/15 Face to face
Government Taiwan Food and Drug Administration (TFDA) Dr. Yeh (Technical Specialist) 2011/4/15 Face to face
Taiwan Food and Drug Administration (TFDA) Miss Huang(Technical Specialist) 2011/4/15 Face to face
Enterprise Jojia Bio-tech Co., Ltd. Mr. Huang (CEO) 2011/4/27 Face to face
Taiwan THL Co., Ltd. Miss Huang (Research Assistant) 2011/4/27 E-mail
Academic Institute of Biotechnology, Kaohsiung University Dr. Yang (Assistant Professor) 2011/4/18 Face to face
Source: This Study
Table 3: The Main Variables of Four Dimensions
Dimensions Variable Description Reference
Financial
Sales Value In this study, sales value represents the income and profits of Taiwan
pharmaceutical industry.
(Chow & Haddad, 1997; Hsiao, Tai, & Liu, 2010)
Equipment Investment It means the founding which is invested in the working capital every year. (Kaplan & Norton, 1996b)
Marketing Founding This variable means the founding which is invested in the marketing every year. (Chang, Hawkins, & Zussa, 2005; Kaplan & Norton, 1996b)
Total R&D Funding
It represents that Taiwan pharmaceutical industry invests how much money in R&D. This variable includes corporate, government founding and venture capital.
(Hsia, 2007; W. T. Hung, Chu, & Yao, 2009; F. C. Lee, 2003)
Staff Costs This variable only represents the total R&D staff salary in this study. (Chung, Tai, Ma, & Chang, 2004;
Kaplan & Norton, 1996b)
Learning and Growth
Total R&D Staff R&D Staff is an important input factor in RD activities. The quality of
researchers is the key point in the achievement of R&D.
(H. H. Huang, 2002; W. T. Hung, et al., 2009)
Educational level of employee
The average educational level of staff is related with the accumulation of knowledge and capability. High-tech industry needs professional knowledge and ability, so it is an important factor in this industry.
(Hsia, 2007; C. S. Hung & Huang, 2008; Y. L. Lee, 2002; C. S. Wang, Hsu, & Lin, 2004; A. Wu, 1999)
Work Experience Longer work experience should translate in to greater R&D capability. (C. S. Hung & Huang, 2008; Y. L.
Lee, 2002) The amounts of patents "Patent" is the lifeblood of the pharmaceutical industry. It can be used to
measure technology competence.
(Chow & Haddad, 1997; De Carolis, 2003; Kasch & Dowling, 2008; F. C. Lee, 2003)
The amounts of Publications
It includes the papers which are published in Science Citation Index (SCI) or the Science & Technology Policy Research and Information Center (STPI) research projects. Published papers show the result of continually investing in RD area.
(Cheng, Sun, Hou, Chao, & Chang, 2006; Y. L. Lee, 2002; C. Y. Wu, 2004)
‐ 10 ‐
Total number of RD training Training can improve and strengthen the knowledge and ability. It is one of a channel for learning and growth.
(Chow & Haddad, 1997; Chung, et al., 2004; Y. L. Lee, 2002; A. Wu, 1999)
Average RD Expenditure per RD Staff
This variable means that average per RD staff has the R&D resources can be used. It is one of the important items of estimation in the RD field.
(C. S. Hung & Huang, 2008; Y. L. Lee, 2002)
RD Capability
“RD is only one of these technological innovation activities and may be carried out at different phases of the innovation process, acting not only as the original source of inventive ideas but also as a form of problem-solving which can be called on any point up to implementation.”(OECD, 1994)
(Chen, 2007; Y. L. Lee, 2002)
Internal Processes
The Number of New Drug Project
This variable represents the number of projects putting in the “Drug Discovery” which is one of RD stages in Pharmaceutical industry.
(Deng, 2007; Kaplan & Norton, 1996b; F. C. Lee, 2003)
Average Delay Time This variable is one of productivity evaluation indicators. It represents the delay time from “Drug Discovery” to “New Drug Appear on the Market”.
(Deng, 2007; Kaplan & Norton, 1996a; F. C. Lee, 2003; A. Wu, 1999) Probability of Success It is one of productivity evaluation indicators. It represents the probability of
success from “Drug Discovery” to “New Drug Appear on the Market”.
(Deng, 2007; F. C. Lee, 2003; A. Wu, 1999)
Number of Project Successful This variable represents the number of projects passed from “Drug Discovery” to “New Drug Appear on the Market” in Pharmaceutical industry.
(Deng, 2007; Kaplan & Norton, 1996b; F. C. Lee, 2003)
New Drug Appear on the Market
It represents the products which have commercialization. It means the result in
the innovation cycle. (Kaplan & Norton, 1996b)
Production Quality and Capability
In this study, the author used “Increased Ratio about Equipment investment” and “Increased Ratio about Training Opportunities” to measure the production capacity and quality in operations cycle.
(Kaplan & Norton, 1996b) Increased Ratio of Marketing It is used to measure the “Deliver the Products/Services” in operations cycle. (Kaplan & Norton, 1996b)
Customer
Total Amounts of Defective Reaction Bulletin
It means that during the using process of drugs, there had some side effects which are unexpected or harmful, including significantly less than the expected pharmacological effects. This bulletin resource is come from manufacturers, medical person and the public. This variable represents “the defect rate of product quality”. The defect rate of product quality is related with customer willingness to pay.
(M. H. Lee, 2007; L. H. Wu, 2005)
Total Amounts of Drug Relief Application
It means the number of application cases that in accordance with the instructions of doctors or drugs labeled to use legal drugs, but still occurring serious side effects, such as death, disability or serious illness. In this study, it represents “consumer complaint cases”. Customer complaint Behavior is related with customer willingness to pay.
(M. H. Lee, 2007; L. H. Wu, 2005)
Customer Willingness to Pay This variable includes the effect about positive and negative factors which affect
‐ 11 ‐
Learning and Growth
Financial Internal Processes Customer Sales Value Equipment investment Marketing Founding Total R&D Funding RD Staff Costs + + + Corparate RD Funding + NSTPBP Funding + + Total R&D Staff + Educational level of employee Work Experience The amounts of patents The amounts of
Publications The amounts
of training Average RD Expenditure per RD Staff RD Capability + + + + + + + + Number of New Project Average Delay Time Probability of Success Number of Project Successful
New Drug Appear on the Market Increased Ratio about
Product Quality Increased Ratio about Marketing -+ + + + -+ + + + Customer Willingness to Pay Domestic Market Demand Aging index Total Number of Defective Reaction Bulletin + + + -+ + + -Total Amounts of Drug Relief Application -Average Annual Salary per Researcher -+ Venture Capital + Export Import -+ + +
The Decline Rate of Drug Price
-Population
+
Aging index Owing to the serious aging problem, the demand of the therapeutic and
preventive drugs is substantially increased. (Price-Waterhouse-Coopers, 2007)
Population The demand of the therapeutic & preventive drugs will increase with the
continually growing population. (Price-Waterhouse-Coopers, 2007)
The Decline Rate of Drug Price
Because of the financial difficulties, Bureau of National Health Insurance gradually lowered drug prices in recent year. This factor makes the growing strength slow down in this industry.
(Chiu, 2008) Domestic Market Demand In this research, this variable represents “Customer Demand” in Taiwan. (L. H. Wu, 2005) Import Value
It represents the domestic market share of foreign competitors. Sales Value is determined by market demand and market share, so this variable will affect the sales value.
(H. C. Huang, 2005) Source: This Study
Figure 6: Causal Loop Diagram of this research Source: This Study
‐ 12 ‐
V. MODELING AND ANALYZE
Model Construction
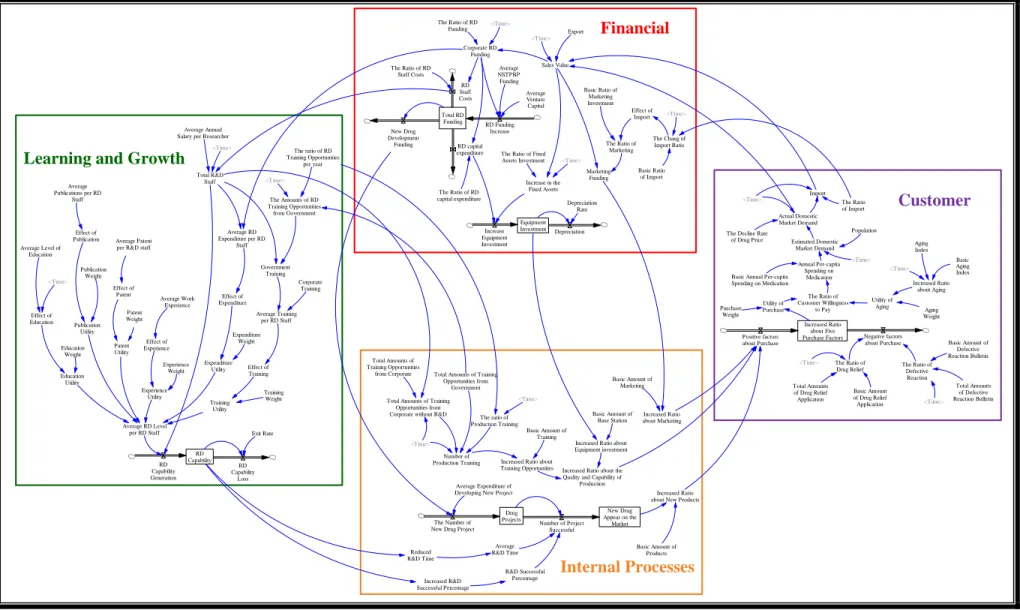
Based on the key variables mentioned in Table 3 and the Causal Loop Diagram of this research (Figure 6), the author will construct the quantitative model (Figure 7) and then simulate by Vensim in this section.
i. Financial Sub-system
This Sub-system is divided to four parts including made two stocks and two important auxiliaries. One of stocks is “Total RD Funding”, and the other one is “Equipment Investment”. The important auxiliaries are “Sales Value” and “Marketing Funding”.
• Total RD Funding
Unlike Japan and Korea, about 98% of Taiwan’s enterprises are small-and-medium size businesses. These companies are unable to afford enormous long-term R&D expenditures for high technology, although their strong flexibility and adaptability enable these businesses to survive (Y. L. Lee, 2002). As described in the preceding section, because the pharmaceutical industry is one of the country's key industries, in addition to companies’ investment in R&D funding, there also has the input from the government, and the venture capital is also attracted to invest in this industry. Therefore, the author uses “Corporate RD Funding”, “Average NSTPBP Funding” and “Average Venture Capital” to represent “RD Funding Increase”, and the initial level of Total RD Funding is set to 13.16 billion based on the sum of “Corporate RD Funding”, “Average NSTPBP Funding” and “Average Venture Capital” in 2001.
In the light of the analysis of the central government budget each year, “National Science and Technology Program for Biotechnology and Pharmaceuticals (NSTPBP)” is the main source of government investment in pharmaceutical industry. Thus, the government investment is represented by “Average NSTPBP Funding” and it is assumed to be 1 billion which is the average value and referred to the analysis of the central government budget from National Statistics, R.O.C. Following the investment of government, the venture capital continuously invests. Here the Average Venture Capital is assumed to be 10.8 billion from Biotechnology & Pharmaceutical Industries Program Office.
The resource of Corporate RD Funding comes from sales value, and the ratio of Corporate RD Funding is based on information taken from “Indicators of Science and Technology” from 2001 to 2009. By type of costs, Corporate RD Funding is divided into RD Capital Expenditure, Labor Costs, Material Costs and Others. The Labor Costs is named “RD Staff costs” in this research. We distinguish “RD Staff costs” to the learning and growth perspective to explore the increasing or decreasing trend of RD manpower in recent years. On the other hand, the RD Capital Expenditure is distinguished to “Equipment Investment” to connect to the dimension of internal processes. Here the Ratio of RD Staff Costs is assumed to be a constant 40% and the Ratio of RD Capital Expenditure is approximately 11% of Corporate RD Funding taken from “Indicators of Science and Technology”.
• Equipment Investment
By renewing and investing the equipment, the industry's manufacturing capacity and product quality can be upgrade. In this study, the “Increase Equipment Investment” is equal to RD Capital Expenditure plus Increase in the Fixed Assets. The Ratio of Fixed Assets Investment collected Department of Statistics, MEA is represented how much percentage is the Fixed Assets increased from sales value. With the increase in service life of the equipments investment, its value would be reduced. Thus, “Equipment Investment” is equal to Increase Equipment Investment minus Depreciation. In this research, the depreciation rate is hypothesized as 10%. • Sales Value
According to Huang (2005), Sales Value is determined by market demand and market share. Therefore, the Sales Value of Taiwan’s pharmaceutical industry is related with three parts, including domestic market demand, export and import in this research. The domestic market demand and export represent the market demand, and the import represents the market share. The data of these three parts are collected from Biotechnology and Pharmaceutical Industries Program Office (BPIPO), MOEA. “Sales Value” is equal to “Actual Domestic Market Demand” minus “Import” and then plus Export.
• Marketing Funding
The ratio of sales cost is about 20% to 30% in the pharmaceutical industry around the world (Berardi, 2003). Therefore, the author conservatively estimated that Basic Ratio of Marketing Investment is about 20% of Sales Value in Taiwan. On the other hand, the higher competitive rivalry will lead to lower prices and margins, and increased marketing costs to attract and retain customers (H. C. Huang, 2005). Thus, when the ratio of import increased, the enterprises may increase marketing expenditure to face this charge and improve market demand. For this reason, the author presumes the ratio of marketing is equal to “Basic Ratio of Marketing Investment” plus “Effect of Import”, and “Effect of Import” is equal to “The Chang of Import Ratio”. The function relating “Effect of Import” and “The Chang of Import Ratio” is assumed to be linearly increasing. However, the change of Effect of Import is limited from 0 to 0.1 by the author, because the general ratio of total marketing funding is about 20%~30%, and Basic Ratio of Marketing Investment has be assumed to 20%. If the variable is not limited, the ratio of marketing may be more than reasonable. Furthermore, “The Chang of Import
‐ 13 ‐
Ratio” is equal to “The Ratio of Import” minus “Basic Ratio of Import”. This variable represents the increased amount of market share about foreign competitors. Due to “The Ratio of Import” is 40% in 2001, the “Basic Ratio of Import” is assumed to 0.4.
ii. Learning and Growth Sub-system
In knowledge economy era, the first emphases are on knowledge and innovation. To borrow Kaplan & Norton’s phrase, an organization’s ability to innovation, learning, and improvement implicates directly to the organization’s value. Lii (2006) thought R&D capability is the major factor to affect enterprises' revenue and value. Therefore, the R&D Capability is the crucial stock in the learning and growth sub-system.
Some scholars thought that the ability of organizational innovation is closely related to intellectual capital (Subramaniam & Youndt, 2005). And some scholars propose that innovative comes from a combination of human wisdom and knowledge, while the human capital is the primary factor in the intellectual capital (William & Johnson, 2002). On the other hand, according to the results of expert interviews from Lee (2002), 2M (manpower and money) is the key factor for R&D capacity and 2Q (quality and quantity) is mainly concerned with manpower.
Here the author also refers to Lee (2002) to apply six critical ingredients to determine “R&D Capability”: level of education, work experience, training, annual RD expenditure per researcher, granted patents and published publications. Owing to these six indicators cannot directly product R&D capacity without ‘people’. Therefore, the author uses the “Total R&D Staff” to represent the quantity of R&D manpower in Taiwan’s pharmaceutical industry; the “Average RD Level per RD Staff” to represent how much R&D capacity will these six indicators per staff generate.
“R&D Capability” is increased by generation and decreased by loss. According Lee (2002), RD Capability is the stock of assets which have been accumulated over time. As a result, “R&D Capability” is defined as “RD Capability Generation” minus “RD Capability Loss”. The generation is determined by the current average R&D level multiplied by Total RD Staff. Here the initial “RD Capability” is set as 432.02 which is the data of “RD Capability Generation” in 2001. On the other hand, because human capital will flow, when one of staff resigns his work, the company would loss the human capital owned by this staff. For this reason, RD Capability Loss is determined by the exit ratio of RD Staff. Here the exit rate is set to 0.014 which is the average value from 2001 to 2009 and based on Directorate-General of Budget, Accounting and Statistics, Executive Yuan.
iii. Internal Processes Sub-system
According to (1996b), the internal business processes include three parts: innovation, operation and post-sale service stages. Moreover, Berardi (2003) also divided the cost of pharmaceutical industry into three sections, containing sales cost, R&D cost and operating cost. Each of these sections accounts for about 20%~30% of total income, so we can understand that these sections are all important in the pharmaceutical industry. Therefore, this sub-system is separated into three parts.
• Innovation Stage
The innovation system of pharmaceutical industry is concentrated on “Drug Development”. The funding of “Drug Development” is from the R&D funding. Based on an interview with Dr. Sun, we can speculate and estimate that the “Average Expenditure of Developing New Project” is about 90 million. Owing to the long time, many processes and low successful rate of R&D, there must a delay effect between “Drug Projects” and “New Drug Appear on the Market”. Therefore, “Number of Project Successful” is related with development time, successful rate of R&D and the function of this variable is set to DELAY function. Pharmaceutical industry is a R&D-oriented industry, thus, RD capability can affect the development of this industry. Through the expert interview, most experts recognized that the enhancement of RD capability can improve the successful rate of R&D and also may reduce development time in drug development stage.
• Operation Stage
Theory of total quality management points out that human is the basis for quality improvement. When staff received relevant training to improve the manufacturing and service process, it cannot only reduce costs, but also reduces product defect rate and then enhances the customer satisfaction (Wen, 2006). Pharmaceutical industry is a high-technology industry that it needs to upgrade human quality continually. Furthermore, this industry also needs many highly-skilled types of equipment. Based on the expert interview, we can confirm that training and equipment investment will help Taiwan’s pharmaceutical industry to enhance the quality and capability of production. As described above, this stage is including two parts: training and equipment investment.
• Post-sale service Stage
By comparing Kaplan and Norton’s post-sale service cycle with Michael Porter’s Value Chain, this cycle is including “marketing and sales” and “after-sales service”. Combined with the important ratio of sales cost described by Berardi (2003), this section is focused on “marketing and sales”. By using marketing founding, the reputation of drugs and manufacturers will be established and improved.
‐ 14 ‐ iv. Customer Sub-system
In recent years, the power of consumers continues to increases, if the more demand of customer we can hold, the more market share we can get. Nevertheless, the factors that influence consumer purchase intention are too broad that we are unable to explore each one. Thus, base on the export interview and the data collection, we choose six factors to measure “Customer Willingness to Pay”, including: “Marketing”, “Quality and Capability of Production”, “New Products”, “Drug Relief Application”, “Defective Reaction Bulletin” and “Aging”.
According to the literature review, owing to the continually growing population and the serious aging problem, the demand of drugs is substantially increased. It can clearly be seen that “aging” is the most important factor in six factors. Yet, this factor cannot be controlled by human. For these reasons, we separate this factor from other five factors. In the following part we will first describe other five factors and then describe the factor about aging. The author uses the stock of “Increased Ratio about Five Purchase Factors” to represent the effect of five factors. Because the factors affecting the purchase includes positive and negative, in this sense that the five factors are divided into two parts, including positive factors and negative factors. And then we talk about domestic market to connect financial sub- system finally.
• “Increased Ratio about Five Purchase Factors”
According to the expert interview, we can know that the reputation of drugs and manufacturers is one of the factors affecting customer willingness to pay. Marketing founding is the mainly resource to establish the reputation, and if the more marketing funding to invest, the more effect of customer willingness to pay will happened. So this is one of positive factors.
“Product Quality” is one of the factors affecting customer willingness to pay. As mentioned in “Internal Process Sub-system”, improve the manufacturing process cannot only reduce costs, but also reduces product defect rate and then enhances the customer satisfaction. Thus, we can confirm that “Quality and Capability of Production” is also one of positive factors.
The purpose of drug development is to provide better and more effective drugs to customers or to develop solutions to some diseases which are still incurable. So when there are better products or new products appeared on the market, it will also attract consumers to buy. In the sense that “New Products” is distinguished in to positive factors.
The definition of “Drug Relief Application” and “Defective Reaction Bulletin” are given in Table above. These variables represent customer complaint cases and the defect rate of product quality in this study. When the more complaint cases and higher defect rate, the customer willingness will be lower. Therefore, there is negative relationship between these variables and purchase.
Judging from the above, the function of “Increased Ratio about Five Purchase Factors” is equal to “Positive factors about Purchase” minus “Negative factors about Purchase”.
• “Aging Problem” and “Customer Willingness to Pay”
Aging index is an indicator to measure the degree of aging in an area. According to Directorate-General of Budget, Accounting and Statistics, Executive Yuan, the function of “Aging Index” is as follow:
Through the literature review and expert interview, we get one of information is that “Aging” is most important factor to affect customers to spending money on drugs. The other information is that other five factors mainly affect hospitals and pharmacies, those end-customers are less to be affected. It is for these reasons that “Aging Weight” is set to 1 and “Purchase Weight” is only assumed to 0.05. “Customer Willingness to Pay” is equal to “Utility of Aging” plus “Utility of Purchase”. The stock of “Increased Ratio about Five Purchase Factors” is including five factors. Thus, this stock should divide by 5 and then multiply “Purchase Weight” to represent “Utility of Purchase”.
• Domestic Market Demand
When “The Ratio of Customer Willingness to Pay” is increased, “Annual Per-capita Spending on Medication” will increased. Here the “Annual Per-capita Spending on Medication” is equal to “Basic Annual Per-capita Spending on Medication” multiply “The Ratio of Customer Willingness to Pay”. “Basic Annual Per-capita Spending on Medication” is set to 3450 which is equal to the actual data of domestic market demand in 2001 divided by population in 2001. Then we can estimate that Taiwan’s domestic pharmaceutical market is equal to “Annual Per-capita Spending on Medication” multiply “Population”. Nevertheless, because of the financial difficulties, Bureau of National Health Insurance gradually lowered drug prices in recent year (Chiu, 2008). Thus, the function of “Actual Domestic Market Demand” is equal to 100% minus The Decline Rate of Drug Price and then multiplies to Estimated Domestic Market Demand. According to The Biotechnology and Pharmaceutical Industries Program Office, MOE, the domestic market demand will be satisfied by import and domestic manufacturers. So “Actual Domestic Market Demand” will be linked to “Import” and “Sales Value”.
‐ 15 ‐
Learning and Growth
Financial
Internal Processes
Customer
Increased R&D Successful Percentage Average R&D Time Drug Projects Number of Project Successful Average Expenditure ofDeveloping New Project
The Number of New Drug Project
R&D Successful Percentage
Increased Ratio about the Quality and Capability of
Production Basic Amount of
Training Total Amounts of Training
Opportunities from Government Basic Amount of Base Station New Drug Appear on the Market Increased Ratio about Equipment investment Increased Ratio about
Training Opportunities <Time> Reduced R&D Time Increased Ratio about Marketing Basic Amount of Marketing Number of Production Training The ratio of Production Training <Time> Total RD Funding RD Funding Increase Sales Value Average NSTPBP Funding The Ratio of RD Funding The Ratio of RD Staff Costs Total R&D Staff <Time> The Amounts of RD Training Opportunities from Government RD Capability RD Capability Generation Average RD Level per RD Staff Average Training per RD Staff Average Publications per RD Staff Corporate RD Funding <Time> Total Amounts of Defective Reaction Bulletin <Time> Increased Ratio about Five Purchase Factors Positive factors about Purchase Negative factors about Purchase Annual Per-capita Spending on Medication Population Estimated Domestic Market Demand <Time> Export <Time> RD Capability Loss Average Level of Education Average Work Experience
Basic Annual Per-capita Spending on Medication
<Time>
Increased Ratio about New Products
Basic Amount of Products The Ratio of Defective Reaction Exit Rate The ratio of RD Training Opportunities per year Average RD Expenditure per RD Staff <Time> Average Annual Salary per Researcher
Average Patent per R&D staff
<Time>
Increase in the Fixed Assets The Ratio of RD
capital expenditure
The Ratio of Fixed Assets Investment Basic Amount of Defective Reaction Bulletin Effect of Education Effect of Expenditure Effect of Experience Effect of Patent Effect of Publication Effect of Training Education Weight Experience Weight Patent Weight Publication Weight Training Weight Expenditure Weight Education Utility Experience Utility Patent Utility Publication Utility Training Utility Expenditure Utility Marketing Funding The Ratio of Customer Willingness to Pay Aging Index <Time> Increased Ratio about Aging Basic Aging Index Equipment Investment Increase Equipment Investment Depreciation Depreciation Rate <Time> Total Amounts of Drug Relief Application Basic Amount of Drug Relief Application The Ratio of Drug Relief RD capital expenditure Corporate Training Government Training Import The Ratio of Import <Time> Average Venture Capital Basic Ratio of Marketing Investment The Ratio of Marketing Effect of Import Basic Ratio of Import
The Decline Rate of Drug Price Actual Domestic Market Demand <Time> The Chang of Import Ratio Total Amounts of Training Opportunities from Corporate
Total Amounts of Training Opportunities from Corporate without R&D
Purchase
Weight WeightAging Utility of Purchase Utility of Aging New Drug Development Funding RD Staff Costs
Figure 7: Overview of the research model Source: This Study
‐ 16 ‐ Model Testing
So far, many kinds of SD modeling testing methods have been advanced by different scholars. For example, Forrester & Senge (1979) in order to increase the confidence in the SD model to propose a wide of variety of tests that include tests of model structure, model behavior, and a model’s policy implication (Forrester & Senge, 1979). Hsieh (1980) recognized that model testing should be begin from the purpose of our model, so he proposed some sample methods such as model stability, pattern of oscillation, time phase and cycle length (Hsieh, 1980; Lin, 2000). In this section, we will discuss the validity of our research model by three methods, including dimensional-consistency test, extreme-condition test and pattern of oscillation. The first two are advanced by Forrester & Senge and the last one is purposed by Hsieh.
• Dimensional-consistency Test
By using the “Unit Check” function of Vensim DSS to test, the units of equations including stocks, flows, auxiliaries and constants are consistent during the process of modeling and simulation. This result also represents that the model structure of this research is considered robust and no problem in dimensional consistency test.
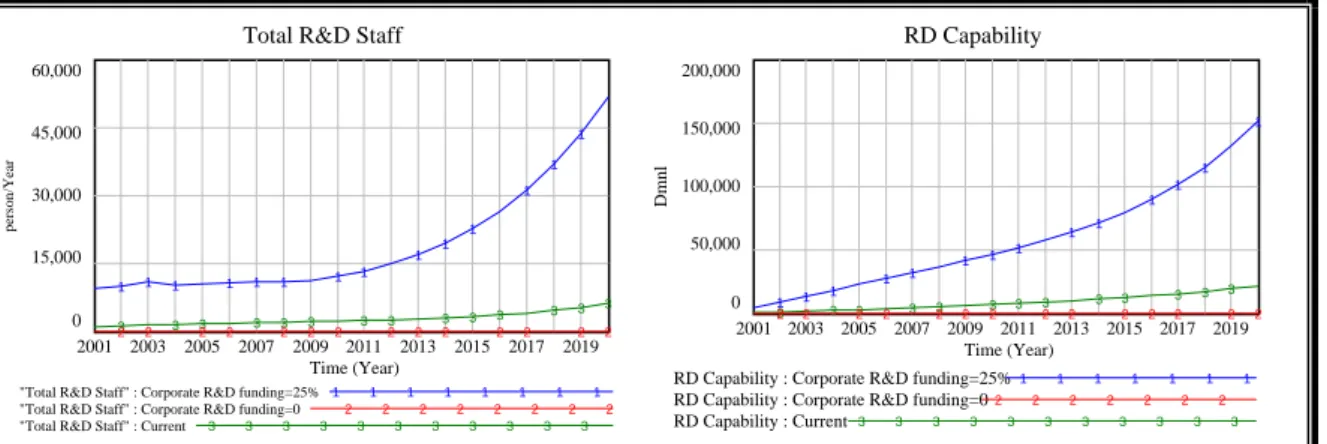
• Extreme-condition Test
The extreme condition test asks whether the model behave appropriately when the inputs take on extreme values such as zero or infinity (Y. L. Lee, 2002). On the other word, by this test, we can check that the model is robust or not in extreme conditions. In this research, we will assume two situations to test: (1) the ratio of corporate R&D funding is equal to 25% which is the max in global pharmaceutical industry based on Berardi (2003); (2) the ratio of corporate R&D funding is equal to zero.
In the proposed model, the learning and growth dimension absolutely depend on the corporate R&D funding. Once the ratio of corporate R&D funding is equal to 25%, there are more funding to hire more R&D staffs and the R&D capability also will quickly increase. However, in the condition about minimum ratio of corporate R&D funding, there are no funding to pay the salary that no R&D staffs can be hire. If there are no R&D staffs in this industry, the R&D area cannot be developed to accumulate R&D capability. Figure 8 correctly reports the results.
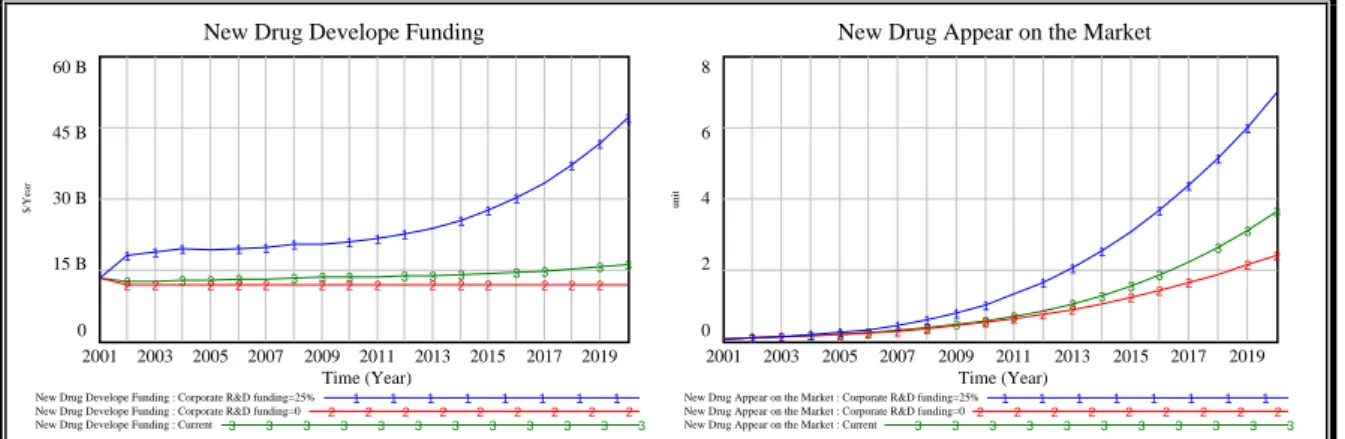
One of the resources about new drug development funding is corporate R&D funding. In max condition about corporate R&D funding, there will be a substantial increase in new drug development funding. And there will be more new drugs appeared on the market (Figure 9). More new drugs will bring more domestic demand and more salves value (Figure 10). When corporate R&D funding is reduced to zero, the new drug development funding will be decreased, and then the amount of new drugs, domestic market demand and salves value are able to respect to decrease. As the above result of test, the extreme-condition test is reasonable and can be built confidence.
Total R&D Staff
60,000 45,000 30,000 15,000 0 3 3 3 3 3 3 3 3 3 3 3 3 3 3 2 2 2 2 2 2 2 2 2 2 2 2 2 2 1 1 1 1 1 1 1 1 1 1 1 1 1 1 2001 2003 2005 2007 2009 2011 2013 2015 2017 2019 Time (Year) pe rson/Ye ar
"Total R&D Staff" : Corporate R&D funding=25% 1 1 1 1 1 1 1 1
"Total R&D Staff" : Corporate R&D funding=0 2 2 2 2 2 2 2 2
"Total R&D Staff" : Current 3 3 3 3 3 3 3 3 3 3 3
RD Capability 200,000 150,000 100,000 50,000 0 3 3 3 3 3 3 3 3 3 3 3 3 3 2 2 2 2 2 2 2 2 2 2 2 2 2 2 1 1 1 1 1 1 1 1 1 1 1 1 1 1 2001 2003 2005 2007 2009 2011 2013 2015 2017 2019 Time (Year) Dm n l
RD Capability : Corporate R&D funding=25%1 1 1 1 1 1 1
RD Capability : Corporate R&D funding=02 2 2 2 2 2 2
RD Capability : Current 3 3 3 3 3 3 3 3 3 3 3
‐ 17 ‐
New Drug Develope Funding
60 B 45 B 30 B 15 B 0 3 3 3 3 3 3 3 3 3 3 3 3 3 3 2 2 2 2 2 2 2 2 2 2 2 2 2 2 1 1 1 1 1 1 1 1 1 1 1 1 1 1 1 2001 2003 2005 2007 2009 2011 2013 2015 2017 2019 Time (Year) $ /Y ear
New Drug Develope Funding : Corporate R&D funding=25% 1 1 1 1 1 1 1 1
New Drug Develope Funding : Corporate R&D funding=0 2 2 2 2 2 2 2 2 2 New Drug Develope Funding : Current 3 3 3 3 3 3 3 3 3 3 3 3
New Drug Appear on the Market
8 6 4 2 0 3 3 3 3 3 3 3 3 3 3 3 3 3 3 3 2 2 2 2 2 2 2 2 2 2 2 2 2 2 2 1 1 1 1 1 1 1 1 1 1 1 1 1 1 1 2001 2003 2005 2007 2009 2011 2013 2015 2017 2019 Time (Year) unit
New Drug Appear on the Market : Corporate R&D funding=25% 1 1 1 1 1 1 1 1
New Drug Appear on the Market : Corporate R&D funding=0 2 2 2 2 2 2 2 2 2 New Drug Appear on the Market : Current 3 3 3 3 3 3 3 3 3 3 3 Figure 9: Extreme-condition Test in Innovation Stage
Actual Domestic Market Demand
800 B 600 B 400 B 200 B 0 3 3 3 3 3 3 3 3 3 3 3 3 3 3 2 2 2 2 2 2 2 2 2 2 2 2 2 2 1 1 1 1 1 1 1 1 1 1 1 1 1 1 2001 2003 2005 2007 2009 2011 2013 2015 2017 2019 Time (Year) $ /Y ear
Actual Domestic Market Demand : Corporate R&D funding=25% 1 1 1 1 1 1 1 1
Actual Domestic Market Demand : Corporate R&D funding=02 2 2 2 2 2 2 2 2 Actual Domestic Market Demand : Current 3 3 3 3 3 3 3 3 3 3 3
Sales Value 400 B 300 B 200 B 100 B 0 3 3 3 3 3 3 3 3 3 3 3 3 3 3 2 2 2 2 2 2 2 2 2 2 2 2 2 2 1 1 1 1 1 1 1 1 1 1 1 1 1 1 2001 2003 2005 2007 2009 2011 2013 2015 2017 2019 Time (Year) $ /Year
Sales Value : Corporate R&D funding=25% 1 1 1 1 1 1 1
Sales Value : Corporate R&D funding=0 2 2 2 2 2 2 2
Sales Value : Current 3 3 3 3 3 3 3 3 3 3 3
Figure 10: Extreme-condition Test in Customer and Financial Sub-system • Pattern of Oscillation
According to Hsieh (1980), system dynamics are often under attack and happened fluctuations and oscillations by external forces. To make sure that the proposed model is adequate, we can examine whether the oscillation pattern of our model fits the real system’s pattern. Therefore, we will compare the simulation results with the actual data in the following.
From Figure 11 and Figure 12, we can find that in terms of sales value and actual domestic market demand, the oscillation pattern of the real system and the model are very close. In the other word, it indicates that this model is close to the real situation.
In Figure 13, there is a gap because of the dimensions are different between the actual data and the simulation data. The dimension of actual data is FTE1 (Full-Time Equivalents) and the dimension of simulation data is people. Although there is a gap between the real system and the model, the oscillation pattern is still the same. As the results, the proposed model has been validated by this comparison.
1
Full-Time Equivalents (FTE): The FTE method counts the total number of R&D participants only after calculating the percentage of time that each person devotes to R&D. International comparisons of manpower engaging in R&D are ordinarily made on a FTE basis.
‐ 18 ‐ Sales Value 80 B 70 B 60 B 50 B 40 B 2 2 2 2 2 2 2 2 1 1 1 1 1 1 1 1 2001 2002 2003 2004 2005 2006 2007 2008 2009 Time (Year) $ /Year
Sales Value : Current1 1 1 1 1 1 1 1 1 1 1 1
Sales Value : ReferenceMode 2 2 2 2 2 2 2 2 2
Figure 11: The Comparison Chart of Sales Value
Actual Domestic Market Demand
200 B 165 B 130 B 95 B 60 B 2 2 2 2 2 2 2 2 1 1 1 1 1 1 1 1 2001 2002 2003 2004 2005 2006 2007 2008 2009 Time (Year) $ /Year
Actual Domestic Market Demand : Current 1 1 1 1 1 1 1 1 1
Actual Domestic Market Demand : ReferenceMode 2 2 2 2 2 2 2 2
Figure 12: The Comparison Chart of Sales Value
Total R&D Staff
4,000 3,000 2,000 1,000 0 2 2 2 2 2 2 2 2 1 1 1 1 1 1 1 1 2001 2002 2003 2004 2005 2006 2007 2008 2009 Time (Year) pe rson/Y ea r
"Total R&D Staff" : Current 1 1 1 1 1 1 1 1 1 1
"Total R&D Staff" : ReferenceMode 2 2 2 2 2 2 2 2
Figure 13: The Comparison Chart of Sales Value
VI. EXPECTED OUTCOMES
In this study, we try to understand and find the reason that why the Taiwan’s government inputs time and money to pharmaceutical industry, but still doesn’t have good performance. The study results will reveal the key decision points by applying System Dynamics. We hope the research results may help Taiwan to improve the performance of developing this industry, and also help Taiwan become the important role of developing this industry among the Asian countries in the future.
REFERENCE
Akkermans, H., & Oorschot, K. (2002). Developing a balanced scorecard with system dynamics. Journal of the Operational Research Society.
Bader, G. (2007). Developing a measurement system for the pharmaceutical compliance process using the Balanced Scorecard. Master, California State University, Dominguez Hills.
Berardi, L. P. (2003). Pharmaceutical industry: market dynamics. Stern Pharmaceutical and Healthcare Association: New York University.
Brewer, P. C., & Speh, T. W. (2000). Using the balanced scorecard to measure supply chain performance. Journal of Business Logistics, 21(1), 75-94.
Business-Monitor-International. (2010). Taiwan Pharmaceuticals & Healthcare Report - Q4 2010. (pp. 1-100). Chang, W., Hawkins, E., & Zussa, F. (2005). Personalized Medicine and The Future of the Pharmaceutical
Industry. Technology Strategy.
Chen, L. X. (2007). An Empirical Study of the Relationship among Technology Orientation, Market Orientation, Product Innovation Performance and Corporate Competitiveness in Taiwan Pharmaceutical Industry. Master, National Cheng Kung University Tainan.
Cheng, C. Y., Sun, T. H., Hou, H. C., Chao, C. M., & Chang, H. C. (2006). The Critical Performance Metrics in Research and Development for the Computer Software Service Industry in Taiwan. The Journal of Chaoyang University of Technology 11, 403-431.
Chin, T.-M. (2009). Overseas R&D Center and Innovation Performance: The View of the Host Country’s Location Advantages. Master, National Tsing Hua University Taiwan.