National Chiao Tung University
Department of Applied Chemistry
PhD Thesis
Raman Micro-spectroscopic and Imaging Studies of
Escherichia coli Biofilm in situ and Intracellular
Dynamics of Fission Yeasts in vivo Using Stable
Isotope Labelling
Student: Hemanth Nag Noothalapati Venkata
Advisor: Dr. Shinsuke Shigeto
Raman Micro-spectroscopic and Imaging Studies of
Escherichia coli Biofilm in situ and Intracellular
Dynamics of Fission Yeasts in vivo Using Stable
Isotope Labelling
Student: Hemanth Nag Noothalapati Venkata
Advisor: Dr. Shinsuke Shigeto
A Thesis
Submitted to Ph. D. Program, Department of Applied Chemistry College of Science
National Chiao Tung University in Partial Fulfillment of the Requirements
for the Degree of Doctor of philosophy in
Applied Chemistry
July 2013
i
Raman Micro-spectroscopic and Imaging Studies of
Escherichia coli Biofilm in situ and Intracellular
Dynamics of Fission Yeasts in vivo Using Stable
Isotope Labelling
Student: Hemanth Nag Noothalapati Venkata
Advisor: Dr. Shinsuke Shigeto
Ph. D. Program, Department of Applied Chemistry
National Chiao Tung University
Abstract
Biological processes have intricate designs by nature. The main purpose of this work is to decode some of these designs. Many areas in biology including studies on microbial communities and cellular biochemistry still largely remain unexplored due primarily to the lack of appropriate tools. In this thesis, we present the applications of Raman micro-spectroscopy and imaging to gain fundamental and otherwise unobtainable biological information on complex structured communities of bacteria known as biofilms and on the metabolic dynamics in single yeast cells.
To demonstrate the power of Raman spectroscopy for complex biological systems, model Escherichia coli biofilms were studied. A variety of biomolecules have been shown to play a unique role as signals and/or regulators in biofilm formation. By using Raman imaging, we investigated model Escherichia coli biofilms and detected high levels of the amino acid
ii
leucine (leucine pool) have been detected, for the first time, within micro-colonies in a nascent
E.coli biofilm. Localization of leucine revealed by multi-frequency Raman images indicates
leucine accumulation during the early stage of the E. coli biofilm formation, which may have resulted from physiological environment-specific metabolic adaptation. Our results demonstrates that our label-free Raman imaging method provides a useful platform for directly identifying still unknown natural products produced in biofilms as well as for visualizing heterogeneous distributions of biofilm constituents in situ.
To elucidate the dynamics of intracellular proteins and lipids at the single cell level, the Raman method was coupled with a very powerful strategy, namely, stable isotope labelling. Here, we present in vivo time lapse Raman imaging, coupled with stable-isotope (13C) labelling, of single living Schizosaccharomyces pombe cells. Lipid droplets have been hypothesized to be intimately associated with intracellular proteins. However, there is little direct evidence for both spatiotemporal and functional relations between lipid droplets and proteins provided by molecular-level studies on intact cells. Using characteristic Raman bands of proteins and lipids, the process by which 13C-glucose in the medium was assimilated into those intracellular components was dynamically visualized. Our results show that the proteins newly synthesized from incorporated 13C-substrate are localized specifically to lipid droplets as the lipid concentration within the cell increases. We demonstrate that the present method offers a unique platform for proteome visualization without the need for tagging individual proteins with fluorescent probes.
Finally, in chapter V we conclude by summarizing what has been achieved during this thesis work and also present a possible new direction of study in the future with our method..
iii
Acknowledgements
First, I would like to express my sincere gratitude to Profs. Hiro-o-Hamaguchi and Shinsuke Shigeto for giving me an opportunity, for their stimulating discussions, and for their constant support throughout this work. Honestly, it would not have been possible to finish my thesis without the help from so many people but to only some of whom it is possible to give a particular mention here.
I must specially thank my supervisor Prof. Shinsuke Shigeto for his faith in me that I can carry out this work, for his continuous and thoughtful guidance, for being patient, understanding and supportive in those times when there was not much progress.
My thanks to Dr.Soshi Yabumoto for his active discussions, arguments and for teaching some basic things during my first two years. I am indebted to Dr. Chuan-Keng Huang and to many students from the Hamaguchi group Drs. Chikao Onogi, Masahiro Ando, Rintaro Shimada, Venkatesh Kaliaperumal, Liang-da Chiu for their stimulating discussions and valuable suggestions.
My thanks to all the past and present members of the Shigeto group for their kind help, which made my stay in Taiwan comfortable. I would also like to thank Ministry of Education, Taiwan for the fellowship during the first three years of my study.
This acknowledgement would be incomplete without expressing my heartfelt thanks to Mr. Sudhakar Narra and Prof. Satyen Saha for their invaluable support both professionally and personally.
Last but not the least, I am deeply thankful to my family and friends for their continuous encouragement and support throughout. I would like to dedicate this thesis to my late grandmother and late aunt who continue to inspire me in every possible way.
iv
Table of Contents
Abstract ... i Acknowledgements ... iii Table of Contents ... iv List of Figures ... viList of Tables ... viii
Chapter I Introduction ... 1
Chapter II Experiment and Data Analysis ... 6
II-1. Confocal Raman micro-spectrometer ... 7
II-2. Estimation of lateral and axial resolutions ... 9
II-3. Singular value decomposition analysis... 10
Chapter III Detection of Leucine Pools in Escherischia coli Biofilm ... 15
III-1. Introduction ... 16
III-2. What are biofilms? ... 17
III-3. Developmental stages in biofilms ... 18
III-4. General methods to study biofilms... 19
III-5. Escherichia coli ... 20
III-6. Raman spectrum of a single planktonic E. coli ... 20
III-7. Space-resolved Raman spectra of E. coli biofilms ... 23
III-8. Raman imaging of a single microcolony ... 28
v
III-10. Why leucine? ... 30
III-11. Conclusion ... 32
Chapter IV Visualization of Dynamic Proteome Localization to Lipid Droplets in Single Fission Yeast Cells Using Stable Isotope Probing ... 33
IV-1. Introduction ... 34
IV-2. How can Raman microspectroscopy help? ... 35
IV-3. Stable isotope probing ... 36
IV-4. Sample ... 37
IV-5. Growth of yeast cells in 13C medium ... 39
IV-6. Stable isotope labeling of fission yeasts ... 40
IV-7. Selection of marker bands for proteins and lipids ... 43
IV-8. Bulk experiments ... 44
IV-9. Single cell Raman imaging... 50
IV-10. Biological implications of this colocalization phenomenon ... 56
IV-11. Conclusion ... 57
Chapter V Summary and Future Perspectives ... 58
vi
List of Figures
Figure II-1. Schematic representation of our laboratory-built confocal Raman micro-spectrometer. ... 8 Figure II-2. Evaluation of (a) lateral and (b) axial resolution of our laboratory built confocal Raman micro-spectrometer. ... 10 Figure II-3. Principle of SVD. ... 11 Figure II-4. Graphical representation of SVD. ... 12 Figure II-5. (a) Optical image of a typical fission yeast cell; (b,c) Raman images constructed for 1602 cm-1 with raw data before SVD (b) and after SVD analysis (c); and (d) representative space-resolved Raman spectra from the same data which were acquired with an exposure time of 1.5 s and 1 mW laser power. ... 14 Figure III-1. Developmental stages of a biofilm ... 18 Figure III-2. Scanning electron micrograph of E.coli grown in culture medium and adhered to a cover slip ... 20 Figure III-3. Typical Raman spectrum of a single E. coli bacterium, with 632.8 nm excitation, optically trapped at the focal point. ... 21 Figure III-4. Optical micrograph of a 30-hour old biofilm... 25 Figure III-5. (a) Optical micrograph of a single microcolony in 30 h old biofilm on which further experiments were done. Space-resolved Raman spectra of the 30-h old E.coli biofilm (b) intracolonial, (c) extracolonial and (d) a planktonic E.coli cell. Stars denote the positions at which (b) and (c) are recorded. ... 26 Figure III-6. Comparison of (a) intracolonial Raman spectrum with those of crystalline (b) L-leucine, (c) L-isoleucine and (d) L-valine ... 27 Figure III-7. (a) Optical micrograph of the scanned region and Raman images of the 30-h-old
E. coli biofilm of the Raman bands at (b) 1097, (c) 782, (d) 1408, (e) 1130, (f) 922, (g) 847, (h)
vii
represent the leucine distribution. ... 29
Figure III-8. Raman sectioning of the 30-hour-old E. coli biofilm Z stacks of the Raman images at (a) 782 cm−1 (the O–P–O symmetric stretch plus contributions of cytosine and thymine vibrational modes), (b) 922, and (c) 1408 cm−1. ... 31
Figure IV-1. Schematic representation of a lipid droplet. ... 34
Figure IV-2. Illustration of isotope-induced red shift in a Raman ... 37
Figure IV-3. Scanning electron micrograph of a fission yeast (S.pombe) culture. ... 38
Figure IV-4. Growth curves of fission yeast in12C- and 13C-glucose containing Edinburgh minimal medium. ... 39
Figure IV-5. (a) Optical image of a typical fission yeast. The transparent region inside the cell indicated by an asterisk is the cytoplasm where protein rich spectra were recorded. The black dot, highlighted by a shown in red square represents LD where lipid rich spectra were measured. Scale bar = 5µm. (b,c) Space-resolved Raman spectra from yeast grown in 12C and 13C-EMM in protein rich (b) and lipid rich regions (c) to identify vibrational isotope shifts. ... 41
Figure IV-6. (a) Space- and time-resolved Raman spectra showing the evolution of isotope incorporation in PR regions in yeasts, (b) Percentage similarity among PR spectra at each time calculated by Pearson correlation coefficients. ... 45
Figure IV-7. (a) Space- and time-resolved Raman spectra showing the evolution of isotope incorporation in LR regions in yeasts, different cells, (b) Percentage similarity among LR spectra at each time calculated by Pearson correlation coefficients. Each spectrum is an average of 25different cells. ... 46
Figure IV-8. 13C incorporation dynamics observed with incubation time in bulk experiments. (a) Amide I bands in PR spectrum at 1654 cm–1 (red) and 1620 cm–1 (blue) (b) Phenylalanine breathing mode in PR spectrum at 1003 cm–1 (red) and 967 cm–1 (blue) (c) 12C=12C str at 1654 cm–1 (red) and 13C-shifted 1602 at 1542 cm–1 (blue) from LR spectrum (d) 1602 cm-1 from LR spectrum ... 49
Figure IV-9. Time-lapse multimode Raman imaging of a single living S.pombe cell grown 13 C-glucose containing medium. ... 51
viii
Figure IV-10. Time-lapse Raman imaging of other single living S. pombe cells grown in 13
C-glucose containing medium. ... 55
List of Tables
Table III-1. Composition of LB-Miller medium ... 20 Table III-2. Tentative assignments of Raman bands observed in planktonic E.coli spectrum . 22 Table IV-1. Composition of Edinburgh Minimal Medium. ... 40 Table IV-2. Peak positions in 12C- and 13C-EMM, molecular component with their tentative
1
Chapter I
Introduction
2
Nature manifests its complexity through life. From time immemorial, people have been trying to understand nature’s way of functioning, especially in relation to living things. But biology in the micro domain was kick started only after the discovery of microorganisms by Antony van Leeuwenhoek in 1676. Since then, it has been one of the major goals of researchers across various disciplines of science to understand the many complex phenomena occurring at the cellular level. Another major revolution in biology happened in 1953 when Watson and Crick discovered the structure of DNA [1], which led to much of the modern understanding of life at the molecular level. The wealth of knowledge accumulated in the last century has clearly revealed how dynamic living beings are, both at cellular and molecular level.
Hence it is very interesting and of primary importance to us, to investigate such complex biological processes happening in single cells as well as in larger biological communities such as biofilms. Many imaging techniques using optical microscope, confocal fluorescence microscope, scanning electron microscope, transmission electron microscope and atomic force microscope have been developed to probe the complexity in the structure of the cells. Though these techniques have the advantage of providing detailed structural images of cells, most of them either destroy or perturb the sample to a great extent. Especially in the case of fluorescence-based imaging methods, which are widely used by many biologists, there is always a need to introduce probe molecules/dyes to the target cell. Thus, it is not possible to explore unknown cellular components for which workable probes have not been developed yet. In other words, exploratory research is not possible. Moreover, there are reports which show that introducing probe molecules to a living cell often leads to unhealthy behaviors and may eventually alter its physiological conditions [2].
These microscopic approaches do not give any detailed information on the chemical composition of the sample, without which the investigation is incomplete. Another important
3
thing to keep in mind is that most of these methods usually can obtain information only in time- and space-averaged manner. In fact, quantitative understanding of the dynamic behavior of molecular composition and distribution in living systems still remains one of the challenging goals in biological sciences.
To advance our knowledge on how cells and other biological systems function in real time, it is desirable to investigate living systems in its own niche and as it is, either with minimal or ideally no perturbation. Raman spectroscopy does fulfill this demand; it offers a way to probe cellular biochemistry in situ and at the molecular level. Most importantly, it inherently bears much higher chemical specificity than any other imaging technique, as vibrational spectra are often referred to as ‘molecular fingerprints’. Needless to mention, Raman spectroscopy is label-free and the non-invasive and non-destructive characteristics of this technique allows for continuously monitoring of the dynamics in living subjects. In the present study, we utilize
Raman micro-spectroscopy and imaging to gain fundamental and otherwise unobtainable biological information from both single cells and complex structures such as biofilms.
The remainder of this thesis consists of four chapters. Description of the experimental approach and data analysis methods used in this work is presented in Chapter II. Our Raman micro-spectrometer and imaging apparatus with an emphasis on its performance (spatial and axial resolution) is discussed first. Our laboratory-built confocal Raman micro-spectrometer has high sensitivity which enables us to measure Raman spectra of biological samples ranging from single living cells (Schizosaccharomyces pombe) to complex systems (Escherichia coli
biofilms). The achieved lateral and axial resolutions of ~0.3 and ~2.5 m, respectively, are sufficiently high to spatially resolve such samples. Multi-frequency Raman images can be obtained simultaneously in a single measurement. Next, a brief description is given on singular value decomposition analysis employed to reduce noise from data sets acquired with very low
4 laser power and acquisition time.
Relatively large, complex biological samples will be the best to demonstrate the power of Raman micro-spectroscopy. Chapter III is describes our studies on Escherichia coli (E.coli) biofilm. Molecular-level investigation of bacterial biofilms in situ is central to fully understand their important characteristics and related phenomena such as chronic human infections and quorum sensing. E. coli was chosen as the target of our study because it is a typical Gram-negative bacterium suited for a first step of systematic Raman studies. Raman spectra from a single planktonic E.coli and a model biofilm of E.coli grown for 30 hours under static condition were measured to gain information on distributions of biofilm constituents and physicochemical microenvironments. Certain microcolonies were identified in the biofilm where amino acid leucine was detected. Raman imaging measurements helped to visualize the distribution of leucine inside the colony in 3D. From this study, we eventually discovered high concentrations of leucine, forming leucine pools, in E.coli biofilms.
After successful studies on larger systems, we went on to study single cells, which are presented in Chapters IV. It is important to study processes that are otherwise not possible to investigate. One such important problem that has been much debated among biologists is the role of lipid droplets in cellular maintenance. We are particularly interested in the open questions as to whether lipid droplets are both spatiotemporally and functionally associated with proteins. To address this question, it is essential to be able to distinguish the biomolecular components that are actively synthesized from those that are already exist. But ordinary Raman spectroscopy cannot do this job. Our strategy to circumvent this problem is to make use of stable carbon isotope (13C) in combination with Raman spectroscopy. Results of the use of
stable isotope labeled Raman micro-spectroscopy and imaging on fission yeast,
5
imaging experiments in fission yeast helped to visualize the intracellular distribution of both proteins and lipids, assimilation of 13C and their dynamic reorganization within the cell. Strong
co-localization of lipids and the actively synthesized proteins was observed, which proved that lipids indeed sequester proteins.
6
Chapter II
7
II-1. Confocal Raman micro-spectrometer
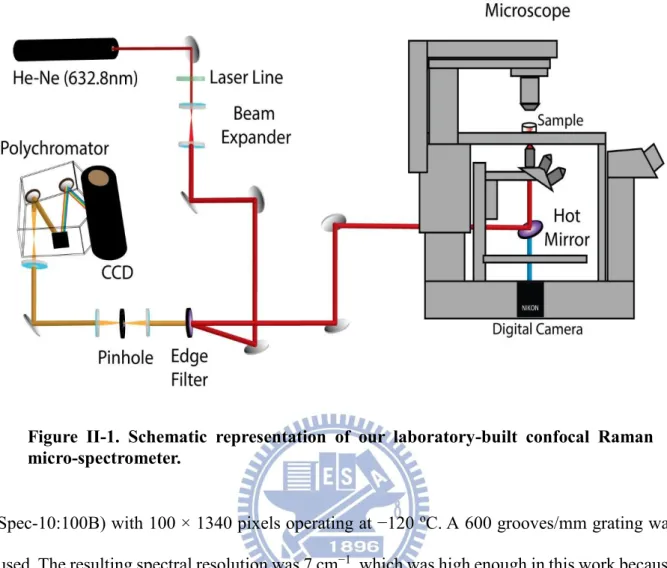
All Raman measurements presented in this thesis, including space- and time-resolved measurements and imaging experiments, were performed using a laboratory-built confocal Raman microspectrometer [3], [4] and its schematic illustration is shown in Figure II-1. The 632.8-nm output of a He-Ne laser (Thorlabs) with a beam diameter of 0.98 mm was used as the Raman excitation source. Our scheme is similar to that of any contemporary Raman spectrometer. First, excitation laser light passed through a laser line filter to clean up any spontaneous emission. Then, in order to reduce the spot size at the focal point, the laser beam was magnified by a factor of ~2.7 using a lens pair to effectively cover the exit pupil of the objective. Collimation of the laser beam was also achieved in this step. The expanded beam was then introduced to an inverted microscope (Nikon) by a pair of an edge filter (Semrock; LP02-633RU-25) and a hot mirror (Thorlabs; FM02). The microscope was custom-made in collaboration with Nikon engineers by modifying a TE2000-U microscope. The beam was focused onto the sample by an oil-immersion objective (CFI Plan Fluor; 100×, NA = 1.3) placed on the microscope stage, and backward scattered light was collected by the same objective. The backward scattered light was guided along the opposite direction to the incoming path. Rayleigh and anti-stokes Raman scattered light was rejected at the edge filter and only Stokes Raman scattered light was transmitted. The Raman scattered light was then focused onto a 100-μm pinhole by a 150-mm lens and collimated by another 150-mm lens.
With this confocal configuration, a spatial resolution of about 0.3 m in lateral direction and 2.7 m in axial direction were achieved (see below). The Raman scattered light was dispersed by an imaging spectrometer (HORIBA Scientific; iHR320) and detected by a back-illuminated, deep-depletion, liquid-nitrogen cooled CCD detector (Princeton Instruments;
8
Spec-10:100B) with 100 × 1340 pixels operating at −120 oC. A 600 grooves/mm grating was
used. The resulting spectral resolution was 7 cm−1, which was high enough in this work because
the Raman spectra of biological samples usually exhibit relatively broad Raman bands. In addition, this grating can cover a wide spectral range over the fingerprint region (>2000 cm−1).
For bright-field observation, the sample was illuminated by a halogen lamp (or a mercury lamp) and optical micrographs were acquired by a digital camera (Nikon; DS-Ri1) mounted on a side port of the microscope.
For imaging experiments, the laboratory-built confocal Raman microspectrometer was also equipped with a high-precision piezoelectric nanopositioning stage (PI; P-563.3CD). A LabVIEW (National Instruments) program was run to automatically control the piezoelectric stage such that Raman imaging experiments were performed by translating the sample both horizontally and vertically. In the present work, the sample was translated with a 0.5-μm step
Figure II-1. Schematic representation of our laboratory-built confocal Raman micro-spectrometer.
9
in both X and Y directions. Because these steps were greater than the estimated lateral resolution (0.32 μm), they determined the effective spatial resolution in our experiments.
II-2. Estimation of lateral and axial resolutions
In order to evaluate the performance of our confocal Raman micro-spectrometer, it is crucial to know the resolution in both lateral (XY) and axial (Z) directions. First, to estimate lateral resolution, the intensity of the first-order phonon band of silicon at 520 cm-1 was
measured while the laser spot was scanned horizontally, with 100 nm step size using the piezostage, through a sharp edge of a silicon wafer (a few µm inside the Si wafer through the edge until a few µm away from the wafer). The intensity of the silicon band will be strong when the laser hits inside the Si wafer, but as the laser spot approaches the edge, the intensity will drop rapidly and become negligible outside. Assuming that the edge of the Si wafer is infinitely sharp [i.e., described by a step function H(x)] and that the laser beam profile is a Gaussian function g(x) with its full width at half-maximum (FWHM) being the lateral resolution, the measured intensity profile can be approximated by a convolution of H(x) and g(x). Here x is the scanned distance in X direction. By fitting the experimentally obtained intensity profile with
Equation II-1 [5], the lateral resolution can be estimated.
𝑓(𝑥, 𝑁, 𝑐, σ) = 𝑁 ∫ 𝐻(𝑎′)𝑔(𝑎′− 𝑎)𝑑𝑎′ =𝑁 2(1 + 𝑒𝑟𝑓 ( 𝑥 − 𝑎 √2𝜎 )) + 𝑐 (II − 1) ∞ −∞
Here, N is a normalization constant, a is the onset of the step function, is the width of the Gaussian function, c is a constant, and erf denotes the error function. The lateral resolution is equal to 2√2 ln 2 σ. Similarly, to estimate axial resolution, the intensity profile of a Raman band of cyclohexane at 801 cm-1 measured at a solvent glass interface was used. Raman
10
Figure II-2 (a) for lateral resolution and in Figure II-2 (b) for axial resolution, respectively.
The fitted results show that the lateral resolution is 0.32 (± 0.04) m and axial resolution is 2.7 (± 0.1) m in the axial direction. The errors here represent fitting precision.
II-3. Singular value decomposition analysis
From our own experience and literature [6], we understand that cell viability decreases with increasing excitation laser power and exposure time. Since we want to see the dynamics in single cells and other biological samples that often take long time (e.g., days or even longer), it is very important not to disturb the regular functioning of the cell. So, in order to provide a better growing environment for the cells, we need to use sufficiently low laser power (1 mW) with short exposure time (typically 1 to 2 s). But the resulting disadvantage is that the Raman signal will be reduced drastically under such low experimental conditions, resulting in poor signal-to-noise (S/N) ratio spectra and low Raman image quality.
To circumvent this practical problem, we make use of a numerical post-treatment
Figure II-2. Evaluation of (a) lateral and (b) axial resolution of our laboratory built confocal Raman micro-spectrometer. Observed Raman intensity in red and the
best fit with the model function (Equation II-1 ) in blue.
(a) (b)
11
method based on singular value decomposition (SVD). This approach has been used successfully by us [3], [4], [7] and several other researchers [8]-[10] as a spectral de-noising technique.
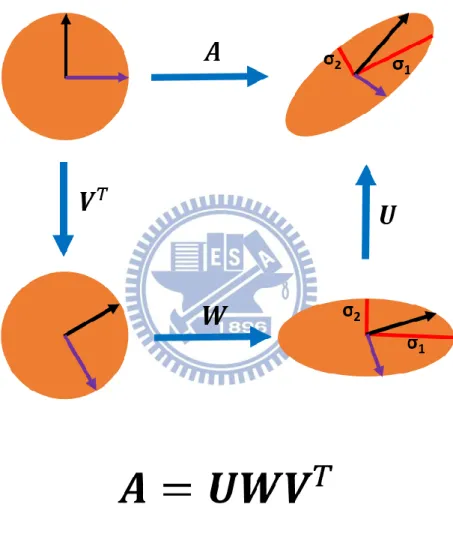
SVD is a mathematical technique that factorizes an arbitrary 𝑚 × 𝑛 matrix 𝑨 into the product of three matrices as 𝑨 = 𝑼𝑾𝑽𝑇.Geometrically, SVD decomposes 𝑨 into three simple
Figure II-3. Principle of SVD. The upper left shows the unit disc together with the
two canonical unit vectors. The upper right shows the action of A on the unit disc: it distorts the circle to an ellipse. The SVD decomposes A into three simple transformations: a rotation VT, a scaling W along the coordinate axes and a second rotation U. The SVD gives σ1 and σ2 which are just the singular values that occur as diagonal elements of the scaling W.
12
transformations: a rotation 𝑽𝑇, a scaling 𝑾 along the rotated coordinate axes and a second
rotation 𝑼 as shown in Figure II-3. The SVD reveals the lengths σ1 and σ2 of the semi-major and semi-minor axes of the ellipse which are just the singular values that occur as diagonal elements of the scaling W. The rotation of the ellipse with respect to the coordinate axes is given by U.
Mathematically, 𝑼 is an 𝑚 × 𝑛 column-orthonormal matrix (also called left singular values), 𝑾 an 𝑛 × 𝑛 diagonal matrix of positive singular values, and 𝑽 an 𝑛 × 𝑛 orthonormal
matrix (right singular matrix). 𝑼 and 𝑽 represent the spectral and positional matrices, respectively as shown in Figure II-4. Only components of 𝑼 and 𝑽 having significantly large singular values were retained to reproduce matrix 𝑨, because other components with much smaller singular values contributed to the original data negligibly and can be regarded as noises. The matrix 𝑨 was then reconstructed by using the components of 𝑼 and 𝑽 associated with large singular values. The number of singular values retained in this reconstruction was typically in
Figure II-4. Graphical representation of SVD. Raw data matrix A can be factorized
into a product of three matrices U (contains spectral information), W (contains singular values) and VT(spatial information of each spectral component)
13
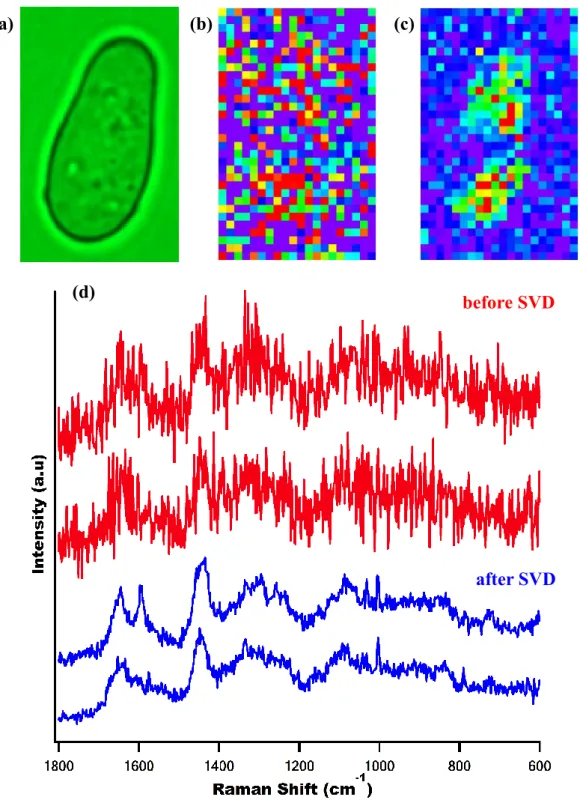
between 10-15. The main criterion for determining how many components are taken into account was whether or not the spectral component of 𝑼 corresponding to a particular singular value shows definite Raman features. The SVD was computed in Igor Pro (WaveMetrics) using LAPACK routines. Figure II-5 illustrates how well SVD denoising works. Space-resolved Raman spectra of a fission yeast cell are compared before and after the SVD. It is clear that the SVD reduces noises dramatically. As compared in Figure II-5 (b) and (c), the Raman image
constructed for the 1602 cm-1 band from the raw data (without SVD) is featureless due to
14
(a) (b) (c)
(d) before SVD
after SVD
Figure II-5. (a) Optical image of a typical fission yeast cell; (b,c) Raman images constructed for 1602 cm-1 with raw data before SVD (b) and after SVD analysis (c); and (d) representative space-resolved Raman spectra from the same data which were acquired with an exposure time of 1.5 s and 1 mW laser power. The
SVD-treated spectra (blue) exhibit much higher S/N than the corresponding raw data (red).
15
Chapter III
Detection of Leucine Pools in
16
III-1. Introduction
Ever since Anton Van Leeuwenhoek reported the discovery of microorganisms in 1676, they have been characterized primarily as planktonic, freely floating cells. Following the discovery, their growth characteristics were studied extensively in nutritionally rich culture media to describe them. Undoubtedly, these studies have been highly informative and have advanced our knowledge on the biology of bacteria. However, in the last four decades, the discovery of many microbiological phenomena that surface-associated microbes exhibit distinct phenotypes from that of their planktonic counterparts aroused significant attention among the scientific community to understand the microbial life in the naturally occurring forms known as biofilms.
There were some observations as early as 1940 that introducing a surface enhances bacterial growth and activity, but the first detailed study of biofilm was reported by Jones et.al. in 1969 [11]. They found that biofilms contain a variety of microorganisms by examining biofilms on trickling filters in a wastewater treatment plant by electron microscopy. Additionally they also confirmed for the first time that the extracellular matrix was mostly composed of polysaccharides. Later in 1973, studies on microbial slimes from industrial water systems by Characklis showed that biofilms are resistant to disinfectants such as chlorine and are tightly bound to the surface [12]. In 1978, from the studies on microorganisms in dental plaque and attached communities in mountain streams, Costerton et.al. proposed that microbes adherent to the living or non-living surfaces gain special characters depending on the environmental conditions [13]. Since then biofilms became a topic of interest among researchers across various disciplines.
17
III-2. What are biofilms?
Bacteria in nature usually live most of their life as members of a ‘socialized’ community called a biofilm rather than as free-living cells. A biofilm is a structured consortium of sessile bacterial cells irreversibly associated on a biotic or an abiotic surface. In a biofilm, cells are encased in a matrix of self-secreted extracellular polymeric substances (EPS) primarily composed of polysaccharides along with proteins and DNA. Although traditional microbiology has focused on planktonic bacteria, it is bacterial cells adopting the biofilm lifestyle that play an essential role in various processes such as bacterial infections [14], [15], wastewater treatment [16], and bioremediation [17]. Indeed, a public announcement by the US National Institutes of Health reads ‘‘Biofilms are medically important, accounting for over 80% of microbial infections in the body”.
Biofilm bacteria are known to show exceedingly high resistance to antimicrobial agents. Furthermore some bacterial species in their biofilm mode of growth can communicate with one another via chemical signalling in the way that the cell density inside microcolonies (cell clusters) in the biofilm regulates cell’s transcriptional processes (quorum sensing). It has been shown that hormone-like signalling molecules termed autoinducers are responsible for gene regulation and resultant biofilm formation. In fact, bacterial biofilms can function as if they were tissues of a higher organism. In all these processes, various biomolecules serve as chemical signals, regulators, and structural components [18]. For example, in many species including Pseudomonas aeruginosa [19], [20] and Staphylococcus aureus [21], extracellular DNA has been shown to be required for initial biofilm formation.
Recently it has been reported that some D-amino acids trigger biofilm disassembly in Bacillus
subtilis and other bacteria [22]. All those characteristics, which make bacterial cells in the biofilm milieu unique and quite different from their planktonic counterparts, are closely
18
associated with the structure of biofilms and molecular distributions therein.
III-3. Developmental stages in biofilms
Biofilm development is a complex process involving several stages, each with unique characteristics. It can be divided into five stages [23], [24] (Figure III-1).
1. Initial attachment: reversible attachment of cells to the surface
2. Irreversible attachment: production of EPS, resulting in more firmly adhered irreversible attachment of cells
3. Maturation I: early development of biofilm architecture in which active recruitment of cells from the bulk fluid takes place, and formation of microcolonies
4. Maturation II: steady increase in size, which leads to formation of mature cell clusters 5. Dispersion: dispersal of cells from mature colonies to form new microcolonies
Figure III-1. Developmental stages of a biofilm
Source: Monroe D. Looking for Chinks in the Armor of Bacterial Biofilms. PLoS Biol 5(11), 2007
19
III-4. General methods to study biofilms
In the early days, most of the research on biofilms relied on techniques such as electron microscopy and standard biological characterization protocols. Later, to understand the biofilm architecture and distributions of biofilm constituents in a non-destructive manner, a variety of optical microscopic methods have been developed and applied. Most commonly used technique for biofilm studies is confocal laser scanning microscopy (CLSM). This method is based on detecting fluorescence from a dye probe introduced to the sample, allowing for three-dimensional (3D) in situ visualization of the biofilm structure with high sensitivity and sub-µm resolution. CLSM studies have revealed that, despite the name of biofilm, the biofilm structure is far more complicated than what one would imagine from a film: a biofilm often consists of microcolonies and channels through which water and other fluids can flow [25]. In CLSM, however, staining cells in a biofilm with an appropriate fluorescence dye is a prerequisite for imaging. Thus, as yet unknown substances can never be explored by this method, because relevant fluorescent probes for the target are not known as well. CLSM (fluorescence imaging) can provide space-resolved information that the conventional biochemical assays often lacks, but it has only limited access to the information on molecular structures and microenvironments in biofilms.
As a first step to fully understand how the biomolecules in biofilms, regardless of whether they are already identified or not, fulfill their advanced functions, we use a label-free Raman imaging method to study the constituents of an Escherichia coli (E.coli) biofilm in situ and to visualize their distributions in the biofilm.
20
III-5. Escherichia coli
E. coli was the bacterium of choice for our demonstration, a typical bacterium suited for
a first step of systematic Raman studies, since it is the most widely studied prokaryotic model
organism. It is a gram-negative, facultative anaerobic, rod shaped bacterium. Most of the strains
are harmless and are part of normal flora of the gut preventing the establishment of pathogenic bacteria within the intestine. Typically they are 2 µm in length and 0.5 µm in diameter as can be seen from Figure III-2.
III-6. Raman spectrum of a single planktonic E. coli
A laboratory strain of E.coli (XL1-blue) was routinely cultured in LB-Miller medium
Figure III-2. Scanning electron micrograph of E.coli grown in culture medium and adhered to a cover slip Source: Rocky Mountain Laboratories, NIAID, NIH
21
at 37 ºC, whose composition is given in Table III-1. As a preliminary step, the Raman spectrum of a single planktonic E. coli was measured by laser trapping (632.8 nm for both trapping and excitation) with a minimal laser power of 3 mW at the sample point. The planktonic Raman
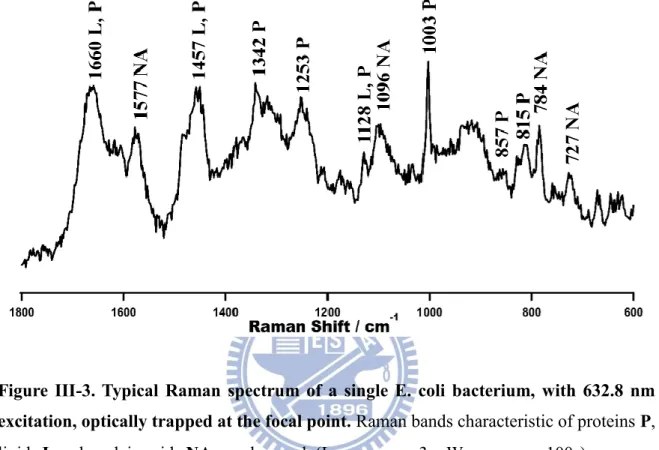
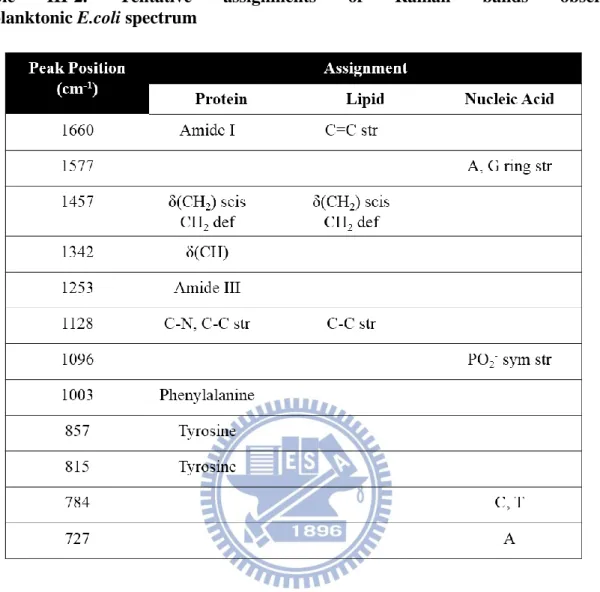
spectrum (Figure III-3) shows several bands characteristic of lipids, proteins and nucleic acids.
Main features are the amide I (mainly C=O stretch of amide bonds) band at 1660 cm−1, the CH
bending of the aliphatic chain at 1342 and 1457 cm−1, and the breathing mode of the
phenylalanine residue at 1004 cm−1. Nucleic acid bands at 784 and 1096 cm−1 attributable to
the (deoxy) ribose-linked phosphodiester backbone vibrations of RNA (DNA) were observed. Cytosine could contribute to the 784 cm−1 band as well. The doublet observed at 815 and 857
cm−1 is known as the tyrosine doublet arising from the Fermi resonance of a ring-breathing
vibration and the overtone of an out-of-plane ring-bending vibration of tyrosyl residues [26]. The bands at 670 and 725 cm−1 are due to nucleobases guanine and adenine, respectively. The
assignments [27]-[30] are summarized in Table III-2.
Figure III-3. Typical Raman spectrum of a single E. coli bacterium, with 632.8 nm excitation, optically trapped at the focal point. Raman bands characteristic of proteins P,
22
Table III-2. Tentative assignments of Raman bands observed in planktonic E.coli spectrum
23
III-7. Space-resolved Raman spectra of E. coli biofilms
E.coli biofilms were grown on a glass-bottomed dish at 37 ºC under static conditions
for 30 hours. The static condition here meant that, in the biofilm growth and subsequent Raman measurements, we did not employ any continuous-flow system in which the biofilm would always be subject to hydrodynamic shear force. Since E. coli biofilms are generally known to be fragile, we did not wash the biofilm sample. Instead, to remove the planktonic population and suppress fluorescence, we gently pipetted excess LB medium out from the edges of the dish. Neither cell staining nor immersing the biofilm in a suspension of metal nanoparticles [31], [32] to enhance Raman signals was required. Thus, our method can be said to look at the target with minimum external perturbation.
The sample was then transferred directly to the microscope stage for Raman measurements without any further pre-treatment. To obtain space-resolved Raman spectra of the 30-hour old E. coli biofilm, we fixed the focal plane of the excitation laser beam at approximately 3 µm above the substrate and collected Raman scattered light from selected locations inside/outside the microcolony on the plane. To avoid possible photo bleaching and heat accumulation, we used laser power of 3 mW at the sample point throughout the present study. For reference, the Raman spectrum of a planktonic E. coli cell was also measured using optical trapping. A 60 s exposure time for the Raman spectra of the biofilm and 100 s for that of the planktonic cell were used.
Almost everywhere in the unwashed E. coli biofilm, a number of microcolonies were found as shown in Figure III-4.Their sizes were diverse, ranging from ~5 µm to several tens
24
of micrometers wide. The morphology varied as well from one microcolony to another. Figure III-5 (a) shows one of the colonies on which further measurements were done, while Figure III-5 (b)–(d) compares the space-resolved Raman spectra, for the spectral range 400–1800 cm−1
, recorded inside and outside the microcolony at ∼ 3 μm above the substrate with that of a
planktonic E. coli cell measured independently using optical trapping. The extracolonial spectrum was almost identical to the planktonic Raman spectrum with few exceptions including the Raman band at 1408 cm−1. This band is due probably to the COO− symmetric stretch of polysaccharides such as alginates which are a major constituent of the extracellular matrix[25], [31].
25
The extracolonial and planktonic spectra represent a typical cellular Raman spectrum dominated by proteins and DNA/RNA bands. These results, along with the optical micrograph
[Figure III-5. (a)], show that the intercolonial space of the biofilm was filled with a dense
population of E. coli cells held together by the extracellular matrix.
Figure III-4. Optical micrograph of a 30-hour old biofilm.
Red arrows indicate microcolonies formed in the biofilm. Scale bar = 10 µm.
26
Figure III-5. (a) Optical micrograph of a single microcolony in 30 h old biofilm on which further experiments were done. Space-resolved Raman spectra of the 30-h old E.coli biofilm (b) intracolonial, (c) extracolonial and (d) a planktonic E.coli cell. Stars denote the positions at which (b) and (c) are recorded.
(a)
*
*
27
The intracolonial spectrum differs substantially from the extracolonial spectrum, indicating distinct chemical composition of the microcolony. By scrutinizing Raman spectra of biomolecules that could potentially occur in the microcolony, we found that the intracolonial Raman spectrum resembles both in peak positions and in spectral pattern remarkably well to that of crystalline L-leucine [Figure III-6 (b)]. We also considered other amino acids such as L-isoleucine and L-valine that are close in chemical structure to L-leucine as possible candidates, but the overall agreement of spectra was not satisfactory at all [Figure III-6 (c),(d)].
Figure III-6. Comparison of (a) intracolonial Raman spectrum with those of crystalline (b) L-leucine, (c) L-isoleucine and (d) L-valine
28
Thus, we conclude that there were high concentrations of leucine (possibly with a minor contribution from phenylalanine) within the E. coli biofilm microcolony, forming a leucine pool.
III-8. Raman imaging of a single microcolony
After understanding the molecular origin of the intracolonial Raman spectrum, it is essential to visualize its distribution in the colony, for which we performed Raman imaging measurements. To scan the laser spot across the biofilm, an XYZ piezoelectric translation stage was installed in our microscope. Since the axial resolution was much poorer than the lateral resolution, we translated the biofilm with a 0.5 µm step in the XY direction and a 1 µm step in the Z direction. In the present case, the scanned region containing the microcolony measures 25 × 25 µm2. At each pixel, the Raman spectrum was recorded with a 1 s exposure time and
de-noising was performed using SVD as mentioned Chapter II. Then multi-frequency Raman images were constructed simultaneously for virtually all the Raman bands involved in the spectra. Since Raman intensities are proportional to molecular concentrations, those images directly visualize molecular distributions in a section of the 30-hour old E. coli biofilm.
Figure III-7 displays eight representative Raman images, which directly visualize the
distributions of the biofilm constituents. Two images at the Raman shift of 1097 and 782 cm−1
representative of DNA and six images at 1408, 1130, 922, 847, 671 and 533 cm−1 representative
of amino acid leucine are displayed together with the optical micrograph of the scanned region.
As expected from the space-resolved Raman data, Raman images of DNA show the yellow (medium to high intensity) pattern outside the microcolony, while those constructed for the bands observed in the intracolonial spectrum manifest distributions localized inside the structure.
29
Although the distribution patterns within the microcolony are highly heterogeneous, they appear to be virtually the same for all the Raman bands Figure III-7 (d)-(i). This strongly supports the idea that the microcolony was composed essentially of a single molecular species, namely, leucine. Otherwise, Raman images would vary largely depending on Raman bands.
Figure III-7. (a) Optical micrograph of the scanned region and Raman images of the 30-h-old E. coli biofilm of the Raman bands at (b) 1097, (c) 782, (d) 1408, (e) 1130, (f) 922, (g) 847, (h) 671, and (i) 533 cm-1. Images (b) and (c) represent the DNA distribution,
while images (d)–(i) represent the leucine distribution.
30
III-9. Three dimensional (3D) Raman imaging
Once we completed a two-dimensional (XY) scan at Z = 3 µm, we translated the E. coli biofilm along the Z axis from Z = 0–6 µm at 1 µm intervals and obtained Z-stacks of Raman images, as displayed in Figure III-8. In this way we realized full 3D, chemical visualization of the E. coli biofilm without resorting to cell staining. Although the Z scan is less informative with respect to biofilm heterogeneity because of a 2 µm axial resolution, we were able to estimate the height of this particular microcolony to be 4–5 µm. Scanning in the Z direction would be more meaningful for thicker (>10 µm) biofilms.
Raman sectioning results are also consistent with the idea of a single species (leucine) being present in the microcolony as even the 3D Raman images constructed for several bands corresponding to leucine [Figure III-8 (b),(c)] show a similar pattern.
III-10. Why leucine?
The most important question to ask in this study is the biological role of leucine accumulation in the biofilm. Some clues to address this question can be found in the literature. Valle et al. found that E. coli biofilms secreted valine under continuous-flow conditions [33]. In contrast to their study, our E. coli biofilm was grown under static conditions, giving rise to both hydrodynamically and nutritionally distinct environments for the biofilm. Given the well-known phenomena of microbial growth inhibition and its antagonism caused by amino acids
[34], [35], it is plausible that our E. coli biofilm may have used the localization of leucine to adapt to the static environment during its early stage development. This interpretation is only speculative and more experiments (both spectroscopic and biochemical) will surely be required to clarify the biological significance of our unique finding.
31
Figure III-8. Raman sectioning of the 30-hour-old E. coli biofilm Z stacks of the Raman images at (a) 782 cm−1 (the O–P–O symmetric stretch plus
contributions of cytosine and thymine vibrational modes), (b) 922, and (c) 1408 cm−1.
32
III-11. Conclusion
In summary, we have discovered leucine pools in a nascent E. coli biofilm by using Raman imaging, where high levels of leucine were accumulated. We have also demonstrated that Raman imaging is a powerful tool for detecting in situ and identifying key biomolecules involved in biofilms even if they are yet unknown (i.e., possibility of exploratory research). We hope this study will open up new avenues for developing a simple but effective chemical means that will enable molecular-level elucidation of bacterial biofilms.
33
Chapter IV
Visualization of Dynamic Proteome
Localization to Lipid Droplets in
Single Fission Yeast Cells Using
Stable Isotope Probing
34
IV-1. Introduction
Lipid droplets (LDs), also called lipid bodies or fat bodies, are globular organelles that are ubiquitously found in most eukaryotic cells from yeast to mammals. LDs are cytoplasmic structures which store neutral lipids in its core. Unlike other intra cellular organelles (aqueous compartments separated by lipid bilayers), LDs have a unique physical structure. LDs’ core is surrounded by a single layer of phospholipids (polar) with some embedded proteins, separating it from the aqueous cytoplasmic space. The core is primarily constituted by triacylglycerols (TAG) and steryl esters (SE), crucial substances for cells (Figure IV-1). These molecules cannot serve as direct building blocks for lipid bilayers as they lack charged groups. Instead, upon requirement, these can be hydrolysed to sterols, diacylglycerol and fatty acid which can mainly be used to derive energy.
LDs were long considered as a static energy storage units and thus remained the least characterized cytoplasmic organelle. In the past half-decade, however, LDs have come under the spotlight of cell biology. There is now growing evidence that reveals diverse roles and an intrinsically dynamic nature of LDs as a key player in various cellular processes, such as lipid
Figure IV-1. Schematic representation of a lipid droplet.
Lipid core (blue) primarily contains TAG and SE which is surrounded by a phospholipid monolayer (purple).
35
homeostasis and cell signalling [36]-[41]. It has also been shown that LDs are relevant to many serious health issues, including obesity, type 2 diabetes, and atherosclerosis. Among various functions of LDs, a recently proposed hypothesis that LDs serve to temporarily sequester proteins is thought provoking and might potentially deepen our understanding of LD [42]-[44]. Proteomic studies have detected LD-associated proteins in many cell types [43], [45], which apparently have little to do with lipid metabolism. Those proteins include histones [42], caveolins [46], and perilipin family proteins [47]. Although proteomic analysis is very powerful for identifying and characterizing individual key proteins, biochemical fractionation and purification procedures adopted in LD proteomics are vulnerable to contamination. Moreover, proteomic analysis cannot provide information on spatial localization (distribution) of proteins as well as their temporal evolution. To test whether LDs are both spatiotemporally and functionally associated with proteins (e.g., sequestration), direct evidence needs to be obtained from single living cells using microscopic and imaging techniques.
IV-2. How can Raman microspectroscopy help?
Molecular imaging based on linear/nonlinear Raman spectroscopy has emerged as a promising tool to trace intracellular processes in vivo and at the molecular level. In contrast with commonly employed fluorescence microscopy, Raman-based methods require no exogenous probe to be introduced to cells. Vibrational resonances, which are an inherent property of molecules, give rise to chemical specificity and, hence, enable label-free molecular imaging. Of particular importance is work using coherent anti-Stokes Raman scattering (CARS) microscopy, which has high sensitivity and three-dimensional sectioning capability. The Xie group at Harvard demonstrated video-rate CARS imaging of living cells and tissues [48]. Hellerer et al. [49] also used CARS microscopy to visualize lipid distributions in Caenorhabditis elegans. Very recently, Xie and coworkers have further improved image contrast
36
by using stimulated Raman scattering (SRS) instead of CARS [50], [51]. SRS is, in principle, free from the nonresonant background that always interferes with vibrationally resonant signals in CARS. These nonlinear Raman microscopic studies achieved to date mostly rely on the strong C-H stretch vibrations around 2850 cm-1 [48]-[53]. However, C-H stretch images alone
do not allow us to directly look into the interplay between LDs and proteins and other organelles. In contrast, Raman microspectroscopy and imaging [28], [54]-[57], although taking longer data acquisition time, provide more extensive and detailed molecular information than CARS microscopy without the need for complicated spectral analysis [58]. Hence we use Raman microspectroscopy and imaging.
IV-3. Stable isotope probing
Since we want to learn spatio-temporal and functional relationships between proteome and lipidome, it is essential to be able to distinguish the biomolecular components that are being actively synthesized from those that already exist. Such a distinction is not possible by ordinary Raman spectroscopy. To achieve this capability, we make use of stable isotopes since isotopic substitution can be of invaluable help in the analysis of vibrational spectra.
Stable-isotope probing (SIP), in which stable isotopes such as 13C and 15N are
incorporated in cells as a non-perturbative tracer for RNA [59], DNA [60], and proteins [61], has been widely used for microbial identification. When combined with Raman imaging [8], [62]-[64], the stable-isotope labeling strategy can confer an ability to differentiate between cellular components produced through distinct anabolic pathways and temporal evolutions. This ability arises from the fact that the characteristic frequency (ν) of an oscillator representing a molecular vibration is inversely proportional to the square root of the reduced mass (µ) of the oscillator (Equation IV-1).
37
𝑣 =2𝜋1 √𝑘µ . . . 𝐄𝐪𝐮𝐚𝐭𝐢𝐨𝐧 𝐈𝐕 − 𝟏
In general the force constants (k) are unaltered by isotopic substitution. Hence, the heavier the incorporated isotope, the lower the frequency i.e., redshift in a Raman spectrum (Figure IV-2)[65].
IV-4. Sample
Raman microspectroscopy is so powerful in that it can be applied to various samples starting from single cells [8], [28], [30], biofilms [3], [27], tissues [48], [66], [67] to small living animals such as mice [68]-[70] and humans [71]. Since our main interest is to study proteome and lipidome together, it is important to study a whole organism. So, in the present study, we chose fission yeast, Schizosaccharomyces pombe (S. pombe), which is one of the most popular eukaryotic model organisms in molecular and cellular biology, owing to its size. Moreover, LD
Normal isotope
heavy isotope
Figure IV-2. Illustration of isotope-induced red shift in a Raman
spectrum. The red trace corresponds to a normal isotope and blue to its heavier counterpart.
38
biology of yeasts has been extensively studied and a wealth of information is already available.
Main reasons behind choosing fission yeast are summarized as follows:
a) It is a unicellular rod-shaped eukaryote
b) Typical size ranges from 3 - 5 µm in diameter and 8 - 15 µm in length
c) They grow and divide by medial fission forming two equally sized daughter cells which is very suitable for cell cycle research and
d) Yeasts are shown to form/accumulate lipid droplets at various conditions
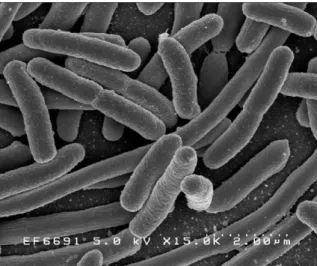
Figure IV-3. Scanning electron micrograph of a fission yeast (S.pombe) culture.
Scale bar=10µm.
39
IV-5. Growth of yeast cells in
13C medium
As a first step, to examine whether there are any adverse effects on cell growth caused by heavy carbon isotope (13C), we cultured fission yeast cells in minimal medium with 13
C-glucose supplied as a primary carbon source and characterized the growth curve. Briefly, S.
pombe cells were cultured in both 12C- and 13C-glucose containing Edinburgh Minimal Medium
(EMM) broth and the increase of optical densities (OD) with time, taken at 600 nm after 10 times dilution of the culture to avoid saturation at longer time, using a UV-Vis spectrophotometer gives a measure of density of both the cultures. Both cultures showed quite a similar growth characteristics (Figure IV-4). The composition of EMM broth is tabulated in
Table IV-1. Comparison of growth curves in Figure IV-4 indicates that cells grown in 13
C-EMM perform as normal metabolic activities as in 12C-EMM. Thus we can safely say that the
use of 13C-glucose instead of 12C-glucose does not affect the growth of yeast cells.
Figure IV-4. Growth curves of fission yeast in12C- and 13C-glucose containing Edinburgh minimal medium.
40
IV-6. Stable isotope labeling of fission yeasts
After confirming that 13C is harmless, space-resolved Raman spectra from yeast cells
grown in 12C- and 13C-glucose medium were recorded. In 12C medium, Raman spectra obtained
from cytoplasmic regions are dominated by vibrational bands associated with cellular proteins, [hereafter called protein rich (PR) spectra], which primarily include the backbone amide modes and amino acid side chain modes. From Figure IV-5 (b), it is clear that yeast cells grown in EMM with regular 12C-glucose have the amide I mode of proteins at 1654 cm–1, amide III at
1253cm–1, C-H bending modes at 1451 and 1338 cm–1, aromatic ring breathing mode of
phenylalanine (Phe) residues at 1003 cm–1 and a tyrosine band at 853 cm–1. Bands between
1040 - 1150 cm–1 and at 916 cm–1 represent the C-C stretching modes. When cells are fed with
stable 13C isotope containing EMM, several bands show red shift due to heavy isotope effect.
Primarily, the amide I and III shift to 1620 and 1237cm–1, respectively. The ring breathing mode
of Phe shifts from 1003 to 967 cm–1 and strong tyrosine band appears at 828 cm–1. The C-C
stretch modes also show small shifts including the relatively isolated 916 cm–1 band, which
shifts to 899 cm–1.
Table IV-1. Composition of Edinburgh Minimal Medium.
41
Figure IV-5. (a) Optical image of a typical fission yeast. The transparent region inside the cell indicated by an asterisk is the cytoplasm where protein rich spectra were recorded. The black dot, highlighted by a shown in red square represents LD where lipid rich spectra were measured. Scale bar = 5µm. (b,c) Space-resolved Raman spectra from yeast grown in 12C and 13C-EMM in protein rich (b) and lipid rich regions (c) to identify vibrational isotope shifts.
(b)
(c)
42
Similarly, Raman spectra [called lipid rich (LR) spectra] obtained from LDs are dominated by the C=C stretch of unsaturated lipid chains, C-H bending modes of the hydrocarbon chains, and skeletal C-C stretch modes as shown in Figure IV-5 (c). Obvious red shifts can be observed for the C=C stretch from 1654 to 1595 cm-1 and the ergosterol marker
band (arising from the C=C diene in-phase stretch of the ring moiety) at 1602 to 1542 cm-1 in 12C and 13C media, respectively. The C=O stretch of the ester linkage shifts from 1744 to 1695
cm-1. A band at 716 cm–1 ascribed to the phospholipid head group shifts to 697 cm–1. The C-H
bending modes, including CH2 scissors and CH3 degenerate deformation of the hydrocarbon
chains, at 1440/1450 and 1338 cm-1 show no appreciable isotope shifts. The in-phase CH 2
twisting mode at 1301 cm–1 is observed at the same frequency in both media and is completely
insensitive to 13C substitution. All vibrational band shifts observed in the PR and LR spectra
are consistent with previous reports [8], [28], [62], [72]. Details of peak position, assignment and 13C isotope effect are tabulated for proteins and lipids in Table IV-2.
43
IV-7. Selection of marker bands for proteins and lipids
Among all bands in PR spectra, the 13C-shifted Phe bands at 967 cm–1 appears in a clean
spectral region and represents a strong, distinguishable Raman signal that can be easily detected even in cellular Raman spectra. Thus this band emerges as a potential marker for the 13C
incorporation/substitution in newly formed proteins. For similar reasons, the band at 1542 cm–1 in LR spectra helps as a marker for the newly synthesized lipids. Additionally, the
lipid band at 1301 cm–1, which does not show any shift, can be used as isotope insensitive lipid
marker to see total intracellular lipids.
Table IV-2. Peak positions in 12C- and 13C-EMM, molecular component
44
The reason behind not considering C-C stretch modes as a possible marker is due primarily to the fact that these bands are observed in both PR and LR spectra and also because they are present in a highly congested region containing several bands, which makes them complicated for further analysis. Typically, tyrosine residues show a doublet at 853 and 825 cm–1, which arises from the Fermi resonance between the ring breathing vibration and the
overtone of an out-of-plane ring-bending vibration. This tyrosine doublet is known to be a strong indicator of the H-bonding strength of the phenolic hydroxyl group [26]. The tyrosine band at 853 cm–1 (apparently shifting to 828 cm–1 in 13C medium) was not considered as a
potential protein marker because it is ambiguous whether the band intensity increase of the 828 cm–1 band is really due to 13C isotope substitution or due to change in the H-bonding
environment.
IV-8. Bulk experiments
Detailed space- and time-resolved Raman experiments were performed in order to understand the dynamics of 13C incorporation/substitution in lipids and proteins and to observe
intermediary spectral features, if any, during the process. Raman spectra characteristic of PR and LR regions that can be free from cell individuality can be best represented by average spectra obtained from measurements on many cells. In light of this, we recorded Raman spectra in both PR and LR regions of 25 randomly picked yeast cells at each time (after washing twice with sterile distilled water) and obtained their averaged spectra as shown in Figures IV-6 (a) and IV-7 (a). Pearson correlation coefficients r, calculated using the formula below, for the
whole spectrum obtained are very high with
45
Figure IV-6. (a) Space- and time-resolved Raman spectra showing the evolution of isotope incorporation in PR regions in yeasts, (b) Percentage similarity among PR spectra at each time calculated by Pearson correlation coefficients.
Each spectrum is an average of 25 different cells.
(a)
46
Figure IV-7. (a) Space- and time-resolved Raman spectra showing the evolution of isotope incorporation in LR regions in yeasts, different cells, (b) Percentage similarity among LR spectra at each time calculated by Pearson correlation coefficients.
Each spectrum is an average of 25different cells.
(a)
47
This result shows that the variation between the measurements is small at each time and indeed individual spectra are very close to the averaged one. Figure IV-8 displays the time evolution of the intensities of several pairs of Raman bands observed in PR and LR spectra. To ascertain the degree of 13C substitution, ring breathing modes of Phe residues (1003 cm–1 in 12C& 967
cm–1 in 13C) and appearance of 1542 cm–1 are used as markers for proteins and lipids,
respectively. In general, the doubling time of fission yeasts in EMM broth is somewhere between 2 - 4 hr. Consistent with this time scale, at 3.5 hr, just after 1 generation, the intensities of 12C-amide I band [1654 cm–1, Figure IV-8 (a)] and 12C-Phe band [1004 cm–1, Figure IV-8
(b)] in PR spectra decrease considerably and at the same time 13C-Phe band at 967 cm–1
becomes identifiable, though very weak, indicating active protein synthesis.
Approximately after a couple of generations, (~ 8 hr), appreciable amounts of 13C
incorporation can be observed by the presence of equally strong 967 cm–1 [see Figure IV-6 (a)].
By this time, the proteins in cells are made predominantly from 13C substrates as can be seen
from the appearance of the 13C-shifted amide I backbone mode of proteins peaking at 1620 cm– 1 [Figure IV-8 (a)]. 12C content in proteins fades away rapidly with time and eventually
becomes negligible in just about 15 hr as indicated by the 1654 cm–1 band in Figure IV-8 (a)
& (b). Simultaneously, incorporation of 13C in cytoplasmic proteins is >75% within that period
of time and a complete incorporation can be seen within a day.
Similarly, in LR spectra, the 13C marker band at 1542 cm–1 (shifting from 1602 cm–1)
band becomes identifiable in about 3.5 hr but becomes more obvious only after ~ 8 hr [Figure
IV-8 (c)]. In order to understand the dynamics of this band, it is also important to know the fate
of its complementary band at 1602 cm–1. Interpreting the dynamics of 1602 cm–1 band just by
looking at the time-resolved spectra is complicated because the C=C stretch band at 1654 cm–1
48
the intensity at 1602 cm-1 decreases initially, reflecting the actual decrease of the band, but starts
increasing from 15 hr because 13C-substituted C=C stretch band comes in [Figure IV-8 (d)].
Hence, it is only appropriate to correlate the appearance of the1542 cm–1 band in an indirect
manner,with the decay of the 1654 cm–1 instead of the 1602 cm–1 band. This is why the
dynamics of the 1654 and 1542 cm–1 bands are coupled together in Figure IV-8 (c). The
intensity of the 1542cm–1 band increases with time, whereas that of 1654 cm–1 decreases. In
lipids, 12C content becomes negligible at 23 hr and incorporation of 13C completes at around 30
hr. By repeating these experiment and looking into the dynamics of the 1654 cm–1 band in
proteins and lipids, we understand that complete depletion of the 12C-associated bands takes
<15 hr for proteins and ~24 hr for lipids. In other words, isotope incorporation in proteins occurs at a faster rate when compared to lipids.