國立臺灣大學公共衛生學院職業醫學與工業衛生研究所 碩士論文
Institute of Occupational Medicine and Industrial Hygiene, Collage of Public Health, National Taiwan University
Master thesis
一、早期塑化劑暴露與孩童智力表現之相關探討
The association between early exposure to phthalates and intellectual performance in young children
二、產前全氟碳化物暴露與孩童注意力缺陷過動症症狀之相關探討 Prenatal exposure to perfluorinated chemicals and attention deficit/hyperactivity
symptoms in children at 7 years of age
徐佳嫺 Jia-Shian Shiu
指導教授:陳保中 博士 Advisor: Pau-Chung Chen, Ph.D.
中華民國 102 年 7 月
July, 2013
致謝
寫到這一頁,回想起好多事。
研究所這兩年,要感謝的人有好多好多,因為在看似平凡的研究生活中,其實受師長、
學長姐許多的提攜與照顧;許多同學的協助和打氣,讓我抒發壓力;而我的避風—家,更是讓 我適時『進廠維修』的『充電廠』。
在此,請讓我一一致謝。
首先,要深深感謝我的指導老師—保中老師。老師總是對不同的學生因材施教;對於每 位不同特質及能力的學生,也用同樣的關心和耐心指導著。在論文上,很感謝老師總是不厭 其煩地給予撰寫上的建議及修正的方向。而生活上,很謝謝老師更是適時地提醒我將事情排 對先後順序的重要性,還有要對自己更有自信。另外,還要謝謝因為老師鼓勵學生出國參加 國際研討會,讓我有了第一次出國的寶貴經驗。而忙碌的保中老師,雖然時常有著一場接一
場的會議,但只要走進 733,老師總會在偷閒的時刻與我們聊天,在老師平常的生活故事分
享和對談的字裡行間當中,可以學習到做人處事應有的態度和圓融的風格。在 RH Lab 這兩
年,雖然有辛苦的收案人生,但從收案、舉行大小活動到參與職業流行病學的文獻回顧等,
這些『團體合作』的過程,其實也是老師從實際行動教我出社會以前的一堂重要的課。
在此,更要深深感謝我的論文口試委員給予指導。謝謝高淑芬老師,在忙碌中給予我論 文的建議和鼓勵。感謝郭育良老師及其實驗室的合作,讓我在研究過程中學習到將兩個追蹤 研究合併時所需要處理和注意的地方。更要感謝謝武勳主任平時給予的關照,並且對於論文 提醒我多思考臨床的角度。當然還有謝佳容老師,從碩一到口試,當遇到大小統計問題時,
謝老師總是耐心地給予我指導。自己還有很多需要進步的地方,真的很感謝老師們撥空給予 耐心指導。
而研究所的生活中,我要深深感謝 RH Lab 的每個人,讓我在這兩年,除了學習到好多
值得學習的地方,也擁有了與大家滿滿的回憶。首先,很感謝靜君學姐總是給我生活上許多
的提醒和照顧,在學姐身上可以學到做人處事的進對應退,面對大大小小的問題,感謝學姊 總是能給予我不同的見解及更好的解決方式。感謝珖彣學姊耐心地教導實驗的建議方法,並 常給予面對困難時的正面鼓勵。還有感謝雪倫學姐出國研討會的同行,一起自信地做紐約背 包客。感謝婆婆學姐,這一路上,當我遇到難以抉擇或不知該如何處理的大小事,總是慎重 又帶點氣定神閒的幽默,分析事情的不同角度給我聽。感謝杏樺、郁荃、彥汝學姐在入學時 期給予許多收案的指點,至今一直記得阿荃學姊的那句鼓勵:『學妹,撐下去!』;感謝阿鼻 和哩哩學姊協助我碩班生活的大小事,即使已進入職場還是給予關心。謝謝孟吟、林達在課 業或收案上互相 Cover。還有謝謝可愛的欣蔚與芳瑩一起分擔實驗室收案的大小事。
另外,也要深深感謝職衛所師長們的教誨,讓我在工業衛生領域多了更精進的知識;謝謝 念慈學姊從入學至今總是給我關心和打氣,安定我初來到陌生環境時容易擔心的情緒;還有 謝謝廖合堂學長總是幽默風趣地關心職衛所的學弟妹們。
當然,也要謝謝職衛所同學禕婷、若齊、欣華、儷瑾、善圍及嘉曜的陪伴,雖然常常忙 著收案不見人影,你們仍然等我一起用餐,然後再好好聊聊、吐吐苦水。還有謝謝智廣一起 走過總區的作測採樣,謝謝郭彬、Karen、姿瑋、阿伯、人滎一同度過研究所兩年。
還有,感謝不在身邊卻常伴心頭的摯友小敬、瑪莉、欣華、小金剛、珮如、姝嫻、鄭胖,
還有同樣選擇念研究所的大學 K 書夥伴晏青、菜、雅芳、花花、宏哥、大姊,雖然遠在各地,
但我們總是互相鼓勵。
最後,我要感謝我的家人從小至今支持我所做的每項決定,做我最強大的後盾,讓我無 後顧之憂。太多要感謝的人,有著太多的筆墨不及,一樣在此深深致謝。自己還有很多要在 學習改進的地方,很謝謝大家一路的關懷和體諒。
我不會忘記,從陌生羞澀的自我介紹,到熱絡熟悉的互相玩笑。我不會忘記,從新奇嚐 鮮,到有點膩的麵街。我不會忘記,從興奮地把大學所學的相關書本擺在碩研室辦公桌上,
到一一收拾桌上的論文文獻。我不會忘記,深深感恩在心。
佳嫺 中華民國 102 年 7 月
Part I.
一、 早期塑化劑暴露與孩童智力表現之相關探討 The association between early exposure to phthalates and
intellectual performance in young children
摘要
背景:在動物實驗研究中發現鄰苯二甲酸鹽暴露可能導致動物神經行為缺陷。
而近期研究也指出環境中的汙染物與兒童的智商有關,然而環境中塑化劑暴露 對於兒童智力的表現研究更需深入探討。
目的:本研究為探討早期塑化劑暴露對於兒童智力之影響。
材料與方法:本研究團隊從Taiwan Birth Panel Study (TBPS) 中 170 位兒童作為 研 究 對 象 。 收 集 其 尿 液 樣 本 , 以 極 致 液 相 層 析 串 聯 式 質 譜 儀(ultra-high performance liquid chromatography tandem mass spectrometry, UPLC-MS/MS)測 量四種塑化劑代謝物之濃度,其代謝物分別有 mono-ethyl phthalate (MEP), mono-n-butyl phthalate (MBP), mono-benzyl phthalate (MBzP) 及 mono-2-ethylhexyl phthalate (MEHP) 。 另 外 , 以 魏 氏 兒 童 智 力 量 表 第 四 版 (Wechsler intelligence scale for children fourth edition, WISC-IV) 量測智力分 數,其指標包含全量表智商 (full scale IQ, FSIQ)、語文理解指數 (verbal comprehension index, VCI)、知覺推理指數 (perceptual reasoning index, PRI)、工 作記憶指數 (working memory index, WMI) 及處理速度指數 (processing speed index, PSI)。統計方法上,使用多變相線性回歸,並校正性別、週數、臍帶血中 鉛(lead)與古丁尼(cotinine)濃度、母親年齡、母親智商、母親教育程度、0-3 歲 兒童家庭物理環境評估量表(Infant/Toddler HOME of Home Observation for Measurement of the Environment Inventory, IT-HOME)分數,以及家庭年收入等
干擾因子。而在多變相邏輯式回歸分析中,我們將所有智力指數低於第1 四分
位數作為較低組,大於等於第1 四分位數作為較高組,分析塑化劑與兒童的智
力指數之相關。
結果:在多變相線性回歸分析中,本研究發現尿液中MBP 和 FSIQ、PRI 及 PSI 有統計顯著負相關。另外,隨著每log10 MBP(ggcreatinine)的濃度增加,
導致全量表FSIQ 智商分數較低的勝算比(odds ratio, OR)為 4.36,其百分之九十
五信賴區間(95% confidence interval, 95% CI)為 1.22 15.59。導致知覺推理指 PRI 數較低的勝算比為 3.69 (OR = 3.69; 95% CI = 1.1012.39)。導致工作記憶 WMI 指數較低的勝算比為 3.69 (OR = 3.69; 95% CI = 1.1012.40)。導致處理 速度PSI 指數較低的勝算比為 4.88 (OR = 4.88; 95% CI = 1.4716.25)。
結論:本研究發現早期暴露塑化劑對於兒童智力表現可能有負面影響,因此對 於環境中塑化劑之暴露來源應更加謹慎;而未來尚需要更多研究來驗證其因果 關係。
關鍵字:智力表現、塑化劑、鄰苯二甲酸單丁酯、兒童
Abstract
Background: Phthalate exposure is associated with neurobehavioral deficits in animals. Recent evidences indicated that early exposure to environmental pollutants may be detrimental to intelligence quotient (IQ) in children. However, examine the impact of phthalate exposure on children’s intelligence needs more explore.
Objectives: The purpose of this study is to evaluate the intellectual effect of early phthalate exposure in young children.
Methods: A total of 170 children from the Taiwan Birth Panel Study (TBPS) were followed up in northern Taiwan. We collected urine samples and measured phthalate metabolites including mono-ethyl phthalate (MEP), mono-n-butyl phthalate (MBP), mono-benzyl phthalate (MBzP), and mono-2-ethylhexyl phthalate (MEHP) by ultra-high performance liquid chromatography tandem mass spectrometry. We used the Wechsler intelligence scale 4th edition (WISC-IV), whose indicates including full scale IQ (FSIQ), verbal comprehension index (VCI), perceptual reasoning index (PRI), working memory index (WMI) and processing speed index (PSI), to assess these children’s intelligence. To examine the association between phthalate
concentrations and children’s intelligence, we used multiple linear regression models to control confounders including children gender, gestational age, cotinine and lead level in cord blood, maternal age, maternal intelligence, maternal education level, Infant/Toddler HOME of Home Observation for Measurement of the Environment Inventory, (IT-HOME) score and yearly income. In logistic regression models, we categorized the all IQ indicates which score less than lower quartile (Q1) as lower
WISC-IV score.
Results: We found negative significant associations between MBP concentration
and full scale IQ (FSIQ), perceptual reasoning index (PRI), and processing speed index (PSI) in multiple linear regression models. There were significantly higher risks of have lower quartile FSIQ (OR =4.36, 95% CI=1.2215.59), PRI (OR = 3.69; 95% CI = 1.1012.39), WMI (OR = 3.69; 95% CI = 1.1012.40), and PSI (OR
= 4.88; 95% CI = 1.4716.25) per log10 MBP concentration (g/gcreatinine), respectively.
Conclusions: Early childhood exposure to phthalates may have an adverse effect on
children’s intellectual performance. Further study is needed to elucidate the mechanism between phthalates and children’s intelligence.
Key words: intelligence, mono-n-butyl phthalate (MBP), phthalates, young children
Contents
摘要 ... ii
Abstract ... iv
Contents ... vi
Contents of figures ... vii
Contents of tables ... viii
Introduction ... 1
Materials and Methods ... 2
Study Population and Design ... 2
Phthalate metabolite in urine ... 2
Measurement of Intelligence ... 3
Statistical Analysis ... 4
Results ... 5
Discussion ... 7
Conclusions ... 10
Appendix 1. Populations stratified according to the mother intellectual ... 15
Appendix 2. Simple and multiple linear regression result of children phthalate concentration and maternal intelligence ... 16
Appendix 3. Simple and multiple logistic regression result of children Phthalate concentration and maternal intelligence levels ... 17
Appendix 4. The chemical structures of common used phthalates, and their metabolites . 18 Reference ... 20
Contents of figures
Figure 1. Adjusted mean IQ scores according to quartile of creatinine-corrected MBP concentrations in urine. ... 14 Figure 2. Metabolic pathways for phthalates ... 19
Contents of tables
Table 1. Demographic characteristics of the population ... 11 Table 2. Multiple linear regression models of WISC-IV by phthalate level b in urine ... 12 Table 3. Multiple logistic regression model of children phthalate concentration and
intelligence levels ... 13
Introduction
Phthalates are a group of the environmental chemicals with a wide spectrum of industrial products and household uses, such as personal care product, food packaging, medical device, building materials and children’s toys. Phthalates can be ingested through food or inhaled through contaminated air or dust. Dermal contact with care products that contain phthalates and medical devices contaminated with phthalates are another possible source of exposure [1]. After entering the body, phthalates undergo rapid metabolism to monoesters and can also be oxidized further to oxidative metabolites (Engel et al. 2010). The issue about children health and exposure to phthalates had been raised concerns. Recently studies had shown an inverse association on phthalate exposure and poor birth outcomes [2], infant neurobehavior [3, 4], child mental, psychomotor and behavioral development [5, 6] In an aspect of neurobehavioral, phthalate exposure is associated with neurobehavioral deficits in animal studies. A rat study had reported that phthalates cause hyperactivity and impulsivity [7]. Xu et al. reported in utero exposure to DEHP might alter the lipid metabolome in the fetal brain in rats[8]. Recently, a recent cross-sectional survey also reported associations between phthalate metabolites and ADHD symptoms in school-aged children [9]
However, one cross-sectional study examined the impact of phthalate exposure on children’s intelligence [10] They reported an inverse relationship between phthalate metabolites and IQ scores after controlling for maternal IQ and other covariates, and the prospective epidemiological studies are needed. Therefore, the objective in our study is to explore the consequences of early phthalate exposure on children IQ development during a period of time.
Materials and Methods
Study Population and Design
This study was a part of the Taiwan Birth Panel Study (TBPS), a total of 486 mother-infant paired was enrolled in northern Taiwan from April 2004 to January 2005 [11]. Subjects were recruited from one regional hospital, one local hospital, and two clinics, because considering about potential environmental exposures. Subsequently, the follow-up was carried out at children’s 5-7 years. The children’s urine was collected at 5 years of age; and further, the children’s and mother’s intellectual measurement was surveyed at 6-7 years of age. This study has been approved by the ethical committee of National Taiwan University Hospital [11], and the subjects signed the inform consent after visitors introduce the purpose of each surveys.
Phthalate metabolite in urine
Children were asked to collect the spot urine at investigation and then store the sample in the freezer. Each urinary sample was collected in a brown-glass which had been cleaned by methanol, hexane, and acetone respectively in our laboratory, and the urine samples were stored at -80 ℃ for further laboratory analysis. We measured phthalate metabolites including mono-n-butyl phthalate (MBP), mono-ethyl phthalate (MEP), mono-benzyl phthalate (MBzP) and mono-2-ethylhexyl phthalate (MEHP). Phthalate metabolites had been grouped into two categories, high-molecular-weight phthalate (HMWP) and low-molecular-weight phthalate (LMWP), separately defined by the molecular weight of the monoesters (>250 Da) and ( < 250 Da) [4, 12]. These groupings were chosen because they each represent similar structures and biologic activity and are derived from similar
sources. Therefore, the metabolites measured in our study included two kinds of each category. The monoester phthalates were measured by using high-performance liquid chromatography tandem mass spectrometry. To determine the concentration of phthalate, the frozen samples were removed from the freezer and thawed at room temperature via vortex mixing. The extracts were poured into the glass culture tube (75x125mm). Then spiked the 250 µL ammonium acetate (1M, pH = 6.5) and a mixture of isotope phthalate monoester standards (20 ng/ml) and 5 µL β-glucuronidase enzyme (200 U/ml). Then the sample diluted with 1 mL phosphate buffer (0.14 M NaH2PO4 IN 0.85% H3PO4, pH = 2).
After the mixture was using by solid-phase extraction (SPE), the elution was evaporated by SPD 1010 Speed Vac concentration at 45℃. Finally, added 200 µL of Mili-Q water, and then filtrated with 0.22-µm PVDF syringe filter. The chromatographic separation of extracts was performed by using ultra-high performance liquid chromatography/tandem mass spectrometry. Analytes were separated on a Waters ACQUITY BEH C18 column (1.7 um, 2.1 mm x100 mm) maintained at 27℃ inside a column oven and operated at a 0.5 mL/min flow rate with acetonitrile as mobile phase A and 0.1% formic acid in Mili-Q water (pH = 2.6) as mobile phase B.
Measurement of Intelligence
We used the Wechsler Intelligence Scale for Children Fourth edition to assess these children’s intelligence at 6-7 years of age. The WISC-IV is a battery of tests designed to assess intellectual abilities in children and adolescents. The 10 core subtests in WISC-IV yield four index scores: Verbal Comprehension (VCI); Perceptual Reasoning (PRI);
Working Memory (WMI); Processing Speed (PSI) and a full-scale IQ score. These 10 subtests are combined to yield a FSIQ [13]. We use a group of seasoned professional examiners to increased WISC-IV stability, and determine the generalizability of the
measurement steady [13]. Previous study suggested that maternal IQ might have influenced the children’s environmental exposure to phthalate [10], so we also measured the maternal intelligence by using Raven‘s progressive matrices (RPM). The examiners completed a college course in intelligence testing and passed a WISC-IV administration proficiency examination before beginning this study. Examiners administered and scored the WISC-IV according to standard procedures.
Statistical Analysis
All analyses were performed using SAS statistical software (SAS Institute Inc., Cary, NC) Version 9.2 for windows. We used the t test and the chi-square test to analysis the demographic variables. To examine the association between the urine phthalate concentration (MEP, MBP, MBzP, and MEHP) and the WISC scores (FSIQ, VCI, PRI, WMI, and PSI), we uses a linear regression model. In logistic regression model, we compared the risks of each lower WISC-IV score (below quartile 1) per log10 MBP concentration (µg/g-creatinine), respectively. Two-tailed p values < 0.05 were considered to be statistically significant. To improve the linearity of the model relationship, we used log10transfermed for the analysis of phthalate metabolites. Creatinine-corrected concentrations of urinary phthalate metabolites (µggcreatinine) were used to normalize for urine dilution [14].
To choice the covariates and risk factors into the multivariate models, we searched the literatures associated with phthalate exposure or child’s IQ. The main covariates used in this study were the following: children gender (malefemale), cotinine in cord blood [15], lead in cord blood [16], maternal age, maternal intelligence, maternal education (high school and belowuniversity and above), annual family income (less than NT$
1,000,000NT$ 1,000,000 and above), and HOME score (Table 1). The covariates were
based on self-reported information given during the following up interview.
Results
Subjects characteristics
The gender distribution of our study subjects was as follows: male, n = 88 (51.8 %); female, n = 82 (48.2 %). The mean (± SD) age of participants was 6.1 ± 0.3 years (rang, 6-7). The mean of all the IQ score among the participants in our study were both above one hundred (Table 1).The mean (± SD) of FSIQ for the total participant was 109.29 ± 12.32, the mean VCI was 107.88 ± 13.23, the mean PRI was 109.98 ± 14.72, and the mean WMI was 100.14 ± 12.29. The proportion of maternal education was as follows: university or above, n = 108 (63.53); high school and below, n = 62 (36.47). Maternal intelligence average score in our study were higher than general range. This may reflect a potential sampling bias, because parental social status might influence the willingness to involve their children in research. Therefore, we adjust the socioeconomic factors, such as yearly income, home score, maternal education, and maternal intelligence to control this bias.
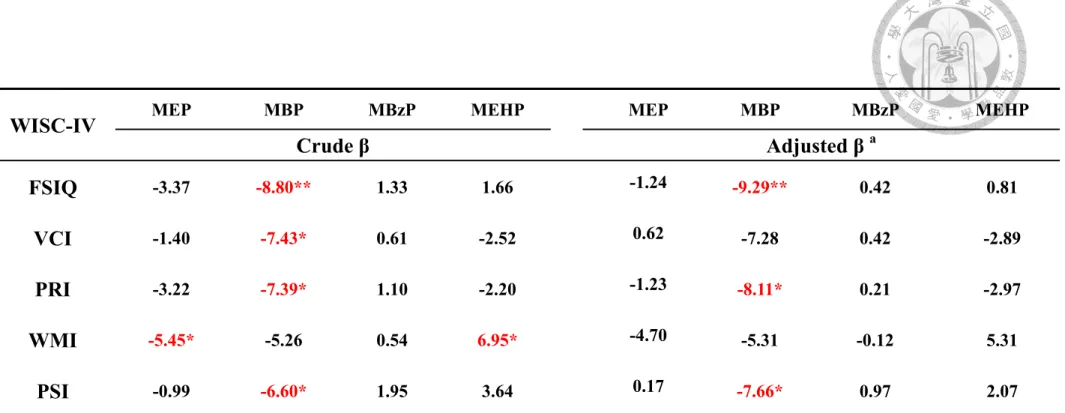
Phthalate biomarkers concentration and intelligence Table 2 showed the crude and adjusted results of children phthalate biomarkers
concentration and Wechsler Intelligence Scale for Children-Fourth edition (WISC-IV).
After controlling the potential confounders, we found the negative association between log10 MBP concentration (g/gcreatinine) and FSIQ, VCI, PRI, and PSI in multiple linear regression models, respectively. Table 3 showed that there were significantly higher risks of have lower quartile FSIQ [odds ratio (OR) = 4.36; 95% confidence interval (CI) =
1.22-15.59], PRI (OR = 3.69; 95% CI = 1.1012.39), WMI (OR = 3.69; 95% CI = 1.10—
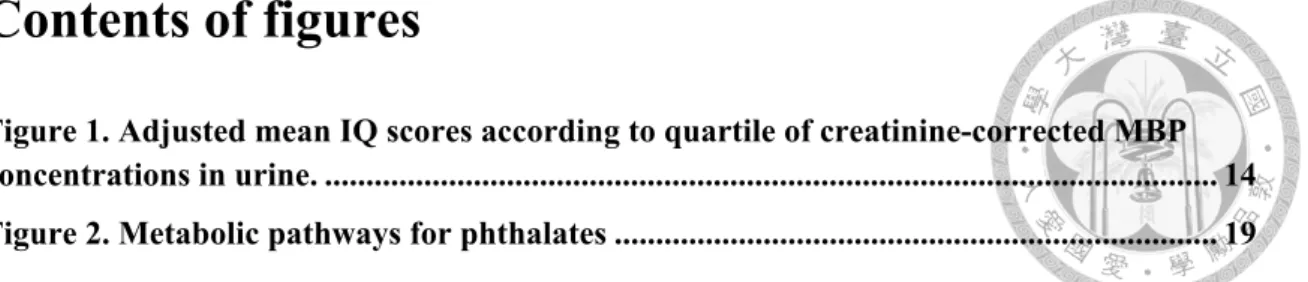
12.40), and PSI (OR = 4.88; 95% CI = 1.4716.25) per log10 MBP concentration (ggcreatinine), respectively. Further, we conducted a categorical analysis to estimate association of VCI and PRI with quartiles of creatinine-corrected MBP, because MBP was found significant before. There were significant group differences in VCI (p = 0.009) and PRI (p = 0.038 ) scores among MBP quartiles (Figure 1.)
Discussion
In this study, we found an inverse association between phthalate and IQ. Even a small shift in the mean IQ score distribution toward to the left could cause a public health burden among the susceptible groups. Further, there also existed dose-response gradient in MBP with VCI and PRI respectively. Thus these results provided strong evidence that children’s IQ was associated with environmental exposure of phthalate.
The phthalate concentrations measured by the different research teams are not consistent. In this study, the mean of MEP, MBP, MBzP, and MEHP concentrations in children urine were 47.7, 74.3, 7.9, and 23.3 µggcreatinine. The MBP and MEHP levels in this study were relatively high compared with concentrations reported in other studies. In recent study in the Germany performed a geometric mean of MBP and MEHP levels for children’s urine at 6.8 years of age were 46.9 and 3.8 μg/gcreatinine, respectively [17]. In USA, NHANES reported the geometric mean of MBP and MEHP were 18.9 and 2.99 μg/gcreatinine in urine from the age of 6-80 [18]. They also showed geometric mean of MBP and MEHP were 48 and 5.4 μg/gcreatinine in female, and 38 and 5.5 in male during 6-11 years old from NHANES 1999-2002 [19]. In contrast, the MBzP level in this study was relatively low compared with concentrations reported in other studies. In Germany, they reported MBzP was 12.2 μg/gcreatinine [17], and the level in a USA study were 13.0 μg/gcreatinine [18]. These different levels in phthalate were partly explained by the social style, life style, and ethnic difference in the data collection of time point.
The major strengths in this study are the collection of reliable data from the medical records, and adjustment for important potential confounders which affecting phthalate exposure and IQ. First, we measured the cotinine in cord blood, because the previous study reported the prenatal EST exposure was significantly associated with neurobehavioral for 5
weeks infant. Measurement to cotinine in blood is considered to be one of the most sensitive biomarkers of cotinine for smoking exposure in this study [20]. Second, we also measured the lead level in cord blood because the previous study reported that lead levels may have lagged effects on neurodevelopment at 5 to 8 years old [21]. Therefore we adjusted the cotinine and lead in cord blood well to avoid report bias or exposure misclassification. The mean ± S.D. of cotinine and lead in cord blood separately were 0.12
± 0.16 ngmL and 1.26 ± 0.68 mgdL. Furthermore, we also stratified analysis to maternal IQ to understand the effect individually (Appendix 1). However, we didn’t find the phthalates concentration had been effect by maternal IQ. The simple and multiple linear regression between children phthalate level and maternal IQ shows no significant association after adjustment for children gender, children age, gestational age, concentration of lead in cord blood, maternal age, and yearly income (Appendix 2).
The mechanism that might cause negative effects of phthalates on neural development is uncertain. PPARs have been observed in developing neural tubes. Its signal transduction pathway has recently been implicated in the progression of neurodegenerative and psychiatric diseases and its relation to cognitive function. Several animal studies have revealed that the dopamine system in the central nervous system is affected by phthalates.
Low-dose phthalates can cause the loss of midbrain dopaminergic neurons, and impair tyrosine hydroxylase immunoreactivity. The mechanism underlying a possible association between phthalates and neurodevelopment has not been established, but may be associated with prenatal disruption of the maternal thyroid hormone system [3].
There are also some limitations in our study. Diester and monoester phthalates have short biologic half-lives of approximately 6-12 hours and we just measure exposure to phthalate once time in 5 years of age. However, Hauser et al. and Hoppinet al. reported the frequent application of personal care products may result in semisteady-state levels, making
it possible to estimate typical phthalate body burden from a single urine sample [22, 23].
Moreover, Frederiksen et al. in Denmark examined the reliability of urinary phthalate levels in exposure classification by comparing the inter- and intra-subject variation [24].
They collected two spot-, three first-morning- and three 24-hour urine samples during a three month period from each 33 young healthy men. Samples were analyzed for the content of 12 urinary metabolites of seven different phthalates. Variability was assessed as intraclass correlation coefficients (ICC). They found that moderate ICCs were observed for the urinary excretion of metabolites of DEP, DBP, and BBzP. The irrespective of types of sampling indicating that a single urine sample may provide a reasonable good estimate of a person’s overall exposure to these three phthalates.
Conclusions
This study showed that environmental phthalate may play important role in children IQ.
These findings highlight the need for reducing the level of phthalate exposure in high-risk population, particularly children with susceptibility. However the causal relationship between phthalates and children’s intelligence is needed to elucidate.
Table 1. Demographic characteristics of the population
Characteristics All participants
(N = 170) Children characteristics
Gender (%)
Male 88 (51.76)
Female 82 (48.24)
age (year, mean ± S.D.) 6.06 ± 0.25
Cotinine in cord blood (ngmL, mean ± S.D.) 0.12 ± 0.16 Lead in cord blood (mgdL, mean ± S.D.) 1.26 ± 0.68 Gestational age (week, mean ± S.D.) 38.76 ± 1.63 Maternal characteristics
Age when measure children IQ (mean ± S.D.) 39.58 ± 4.09
SPM+ Score (mean ± S.D.) 39.1 ± 4.62
Maternal education (%)
High school and below 62 (36.47)
University and above 108 (63.53)
Family characteristics Annual family income (%)
less than 1,000,000 NT$ 85 (50)
above 1,000,000 NT$ 85 (50)
HOME a score at 2 years of child’s age (mean ± S.D.) 40.89 ± 2.6 Wechsler Intelligence Scale b (mean ± S.D.)
FSIQ 109.29 ± 12.32
VCI 107.88 ± 13.23
PRI 109.98 ± 14.72
WMI 109.59 ± 14.56
PSI 100.14 ± 12.29
Phthalate c in child's urine (µg/g-creatinine, mean ± S.D.)
MEP 47.72 ± 95.4
MBP 74.31 ± 67.35
MBzP 7.88 ± 22.68
MEHP 23.25 ± 43.06
a HOME, Home Observation for Measurement of the Environment Inventory
b FSIQ, full scale IQ; VCI, verbal comprehension index; PRI, perceptual reasoning index;
WMI, working memory index; PSI, processing speed index
c MEP, mono-ethyl phthalate; MBP, mono-n-butyl phthalate; MBzP, mono-benzyl phthalate; MEHP, mono-2-ethylhexyl phthalate
Table 2. Multiple linear regression models of WISC-IV by phthalate level b in urine
WISC-IV MEP MBP MBzP MEHP MEP MBP MBzP MEHP
Crude β Adjusted β a
FSIQ -3.37 -8.80** 1.33 1.66 -1.24 -9.29** 0.42 0.81
VCI -1.40 -7.43* 0.61 -2.52 0.62 -7.28 0.42 -2.89
PRI -3.22 -7.39* 1.10 -2.20 -1.23 -8.11* 0.21 -2.97
WMI -5.45* -5.26 0.54 6.95* -4.70 -5.31 -0.12 5.31
PSI -0.99 -6.60* 1.95 3.64 0.17 -7.66* 0.97 2.07
a Adjustment for children gender, gestational age, cotinine in cord blood, lead in cord blood, maternal age, maternal intelligence, maternal education, HOME score and yearly income
b We examined the association between log10 transformed phthalate concentrations ( (µg/g-creatinine)
c Abbreviation : FSIQ, full scale IQ; VCI, verbal comprehension index; PRI, perceptual reasoning index; WMI, working memory index;
PSI, processing speed index
* P < 0.05, ** P < 0.01, # P < 0.001
Table 3. Multiple logistic regression model of children phthalate concentration and intelligence levels
Phthalate biomarkers
WISC-IV MEP MBP MBzP MEHP MEP MBP MBzP MEHP
Crude OR (95% CI ) Adjusted OR (95% CI ) FSIQ ≤ Q1 2.18
(1.04-4.57) 3.68
(1.17-11.52) 0.39
(0.16-0.91) 0.61
(0.21-1.73) 1.80
(0.76-4.06) 4.36 **
(1.22-15.59) 0.39*
(0.13-0.95) 0.96 (0.22-2.34) VCI ≤ Q1 1.01
(0.46-2.20)
3.07 (0.86-9.62)
0.45 (0.21-1.24)
0.96 (0.25-2.32)
0.78 (0.33-1.83)
3.03 (0.83-10.91)
0.43 (0.19-1.24)
1.17 (0.26-2.81) PRI ≤ Q1 1.69
(0.54-2.43) 3.15
(0.87-8.98) 0.68
(0.15-0.92) 0.84
(0.21-1.85) 1.64
(0.45-2.23) 3.69 *
(1.00-12.05) 0.71
(0.16-1.00) 1.25 (0.26-2.81) WMI ≤ Q1 2.29 *
(1.10-5.28)
3.76 (1.21-11.09)
0.59 (0.25-1.40)
0.73 (0.24-2.19)
2.20 (0.94-5.26)
3.69 (1.10-12.40)
0.69 (0.28-1.7)
0.91 (0.27-3.03) PSI ≤ Q1 1.36
(0.74-3.65)
3.83 (1.48-11.64)
0.73 (0.45-2.48)
0.75 (0.25-2.02)
1.27 (0.62-3.52)
4.88 **
(1.47-16.25)
0.81 (0.37-1.79)
0.99 (0.28-2.89)
a Adjustment for children gender, gestational age, cotinine in cord blood, lead in cord blood, maternal age, maternal intelligence, maternal education HOME score and yearly income
b We examined the association between log10 transformed phthalate concentrations
c Abbreviation: Full Scale IQ, FSIQ; Verbal Comprehension Index, VCI; Perceptual Reasoning Index, PRI; Working Memory Index, WMI; Processi Speed
Index, PSI
d We compared the risks of each lower quartile WISC-IV score per log10 MBP concentration (µg/g-creatinine), respectively
MBP Quartile
1 2 3 4
FSIQ
90 95 100 105 110 115 120
MBP Quartile
1 2 3 4
VCI
90 95 100 105 110 115 120
MBP Quartile
1 2 3 4
PRI
90 95 100 105 110 115 120
MBP Quartile
1 2 3 4
WMI
90 95 100 105 110 115 120
MBP Quartile
1 2 3 4
PSI
90 95 100 105 110 115 120
Figure 1. Adjusted mean IQ scores according to quartile of creatinine-corrected MBP concentrations in urine.
Adjusted for children gender, cotinine in cord blood, lead in cord blood, maternal age, maternal intelligence, maternal education, HOME score and yearly income. The values for MBP first, second, third, and fourth quartiles were <1.56, 1.56 to 1.76, 1.76 to 1.91, 1.91 to 2.7
µg/g-creatinine.
P=0.004 P=0.009 P=0.0038
P=0.36
P=0.02
Appendix 1. Populations stratified according to the mother intellectual
Characteristics All participant
(N = 170)
Maternal IQ
≤ P25 (N = 43)
Maternal IQ
> P25 (N =127) Children characteristics
Gender [N (%) ]
Male 88 (51.8) 26 (60.47) 62 (48.8)
Female 82 (48.2) 17 (39.53) 65 ( 51.2)
Age [Mean ± SD] 6.1 ± 0.3 6.0 ± 0.2 6.0 ± 0.2
Gestational age [Mean ± SD] 38.8 ± 1.6 38.6 ± 2.0 38.8 ± 1.5
Concentration of lead in cord blood
(μg/dl) [Mean ± SD] 12.6 ± 6.8 15.0 ± 6.5 11.8 ± 6.7
Maternal characteristics
Maternal age (year) [Mean ± SD] 39.6 ± 4.1 40.7 ± 4.3 39.2 ± 4.0
Maternal Intelligence [Mean ± SD] 39.1 ± 4.6 33.5 ± 2.5 41.0 ± 3.5
Maternal education [N(%)]
≤ High school 62 (36.5) 20 ( 46.51) 42 ( 33.1)
≥ University 108 (63.5 ) 23 ( 53.49) 85 ( 66.9)
Family characteristics N (%)
Yearly income (NT$)
< 1000,000 84 (49.4) 26 ( 59.5) 59(46.5)
≥ 1000000 86 (50.6) 17 ( 40.5) 68(53.5)
Phthalate Mean ± SD
MEP 47.7 ± 95.4 46.97± 74.9 48.0 ± 101.7
MBP 74.3 ± 67.4 80.94 ± 85.8 72.1 ± 60.1
MBzP 7.9 ± 22.7 6.62 ± 8.9 8.3 ± 25.8
MEHP 23.3 ± 43.1 18.36 ± 13.7 24.9 ± 49.1
Wechsler Intelligence Scale Mean ± SD
FSIQ 109.3 ± 12.3 105.5 ± 14.4 110.6 ± 11.3
VCI 107.9 ± 13.2 104.5 ± 13.8 109.0 ± 12.9
PRI 110.0 ± 14.7 108.0 ± 15.1 110.6 ± 14.6
WMI 109.6 ± 14.6 107.9 ± 16.7 110.2 ± 13.8
PSI 100.1 ± 12.3 96.2 ± 12.8 101.5 ± 11.8
Appendix 2. Simple and multiple linear regression result of children phthalate concentration and maternal intelligence
Phthalate
Maternal Intelligence Crude β ( 95% CI ),
p-value Adjusted β ( 95% CI ), p-value
MEP -0.002 (-0.018, 0.013) 0.76 -0.003 ( -0.019, 0.014), 0.75
MBP 0.004 (-0.006, 0.014) 0.46 0.003 ( -0.008, 0.014) 0.58
MBzP 0.006 (-0.008, 0.021) 0.40 0.008 ( -0.008, 0.024) 0.34
MEHP 0.005 (-0.006, 0.016) 0.40 0.006 ( -0.006, 0.018) 0.34
a Adjustment for children gender, children age, gestational age, Concentration of lead in cord blood, maternal age, and yearly income
b We examined the association between log10 transformed phthalate concentrations ( (µg/g-creatinine)
Appendix 3. Simple and multiple logistic regression result of children Phthalate concentration and maternal intelligence levels
Phthalate b Maternal
Intelligence > P25
Maternal Intelligence ≤ P25
Crude OR ( 95% CI ) Adjusted OR ( 95% CI ) log10MEP Reference 1.13 (0.50 - 2.52) 1.39 (0.57 - 3.42) log10MBP Reference 1.26 (0.37 - 4.38) 1.82 (0.49 - 6.78) log10MBzP Reference 0.82 (0.34 - 1.97) 0.85 (0.35 - 2.11)
log10MEHP Reference 0.42 (0.13 - 1.41) 0.33 (0.09 - 1.21)
a Adjustment for children gender, children age, gestational age, Concentration of lead in cord blood, maternal age, and yearly income
b We examined the association between log10 transformed phthalate concentrations ( (µg/g-creatinine)
Appendix 4. The chemical structures of common used phthalates, and their metabolites
Phthalates
(Abbreviation) Molecular structure Metabolites
(Abbreviation) Molecular structure
Di(2-ethylhexyl) phthalate
(DEHP)
Mono-2-ethylhexy l phthalate
(MEHP)
Diethyl phthalate (DEP)
Mono-ethyl phthalate
(MEP)
Di-n-butyl phthalate (DBP)
Mono-n-butyl phthalate
(MBP)
Butylbenzyl phthalate (BBzP)
Mono-benzyl phthalate
(MBzP)
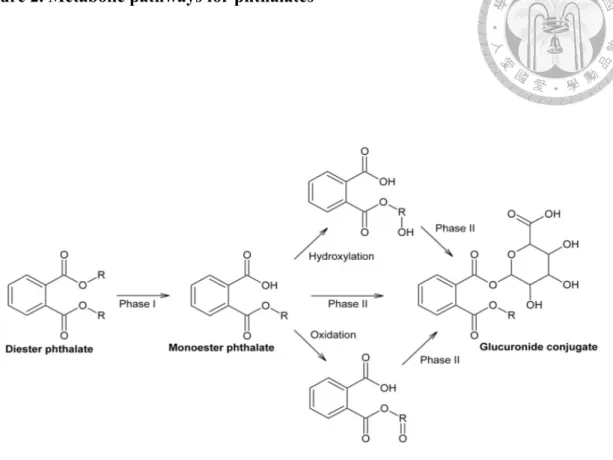
Figure 2. Metabolic pathways for phthalates
After entering the body, phthalates normally follow a metabolic pathway in at least two steps; a phase I hydrolysis and phase II conjugation (Fig. 1). In the first step, the diester phthalate is hydrolyzed into the primary metabolite monoester phthalate, in a process catalysed by lipases and esterases in the intestine and parenchyma. Normally this first step in the metabolism would be a detoxification. Conjugates are easily excreted in urine [25].
Reference
1. Hernández-Díaz, S., et al., Medications as a potential source of exposure to phthalates in the US population. Environ Health Perspect, 2009. 117(2):
p. 185.
2. Philippat, C., et al., Exposure to phthalates and phenols during pregnancy and offspring size at birth. Environ Health Perspect, 2012. 120(3): p. 464.
3. Yolton, K., et al., Prenatal exposure to bisphenol A and phthalates and infant neurobehavior. Neurotoxicol Teratol, 2011. 33(5): p. 558-566.
4. Engel, S.M., et al., Prenatal phthalate exposure and performance on the Neonatal Behavioral Assessment Scale in a multiethnic birth cohort.
Neurotoxicology, 2009. 30(4): p. 522-528.
5. Engel, S.M., et al., Prenatal phthalate exposure is associated with childhood behavior and executive functioning. Environ Health Perspect, 2010. 118(4):
p. 565.
6. Whyatt, R.M., et al., Maternal prenatal urinary phthalate metabolite
concentrations and child mental, psychomotor, and behavioral development at 3 years of age. Environ Health Perspect, 2012. 120(2): p. 290.
7. Borch, J., et al., Mechanisms underlying the anti-androgenic effects of diethylhexyl phthalate in fetal rat testis. Toxicology, 2006. 223(1): p. 144-155.
8. Xu, Y., et al., Di-(2-ethylhexyl)-phthalate affects lipid profiling in fetal rat brain upon maternal exposure. Arch Toxicol, 2007. 81(1): p. 57-62.
9. Kim, B.-N., et al., Phthalates exposure and attention-deficit/hyperactivity disorder in school-age children. Biological Psychiatry, 2009. 66(10): p.
958-963.
10. Cho, S.-C., et al., Relationship between environmental phthalate exposure and the intelligence of school-age children. Environ Health Perspect, 2010.
118(7): p. 1027.
11. Hsieh, C.-J., et al., The Taiwan Birth Panel Study: a prospective cohort study for environmentally-related child health. BMC Res Notes, 2011. 4(1): p. 291.
12. Wolff, M.S., et al., Prenatal phenol and phthalate exposures and birth outcomes. Environ Health Perspect, 2008. 116(8): p. 1092.
13. Ryan, J.J., L.A. Glass, and J.M. Bartels, Stability of the WISC-IV in a sample of elementary and middle school children. Appl Neuropsychol, 2010.
17(1): p. 68-72.
14. Kim, Y., et al., Prenatal exposure to phthalates and infant development at 6 months: prospective Mothers and Children’s Environmental Health (MOCEH) study. Environ Health Perspect, 2011. 119(10): p. 1495.
15. Hsieh, C.-J., et al., CYP1A1 Ile462Val and GSTT1 modify the effect of cord blood cotinine on neurodevelopment at 2 years of age. Neurotoxicology, 2008.
29(5): p. 839-845.
16. Miranda, M.L., et al., The relationship between early childhood blood lead levels and performance on end-of-grade tests. Environ Health Perspect, 2007.
115(8): p. 1242-7.
17. Kasper-Sonnenberg, M., et al., Levels of phthalate metabolites in urine among mother–child-pairs–Results from the Duisburg birth cohort study, Germany. Int J Hyg Environ Health, 2012. 215(3): p. 373-382.
18. Ferguson, K.K., R. Loch-Caruso, and J.D. Meeker, Urinary phthalate metabolites in relation to biomarkers of inflammation and oxidative stress:
NHANES 1999–2006. Environ Res, 2011. 111(5): p. 718-726.
19. Hatch, E.E., et al., Association of urinary phthalate metabolite concentrations with body mass index and waist circumference: a cross-sectional study of NHANES data, 1999–2002. Environ Health, 2008. 7(27): p. 1-15.
20. Benowitz, N.L., Cotinine as a biomarker of environmental tobacco smoke exposure. Epidemiologic Reviews, 1996. 18(2): p. 188-204.
21. Huang, P.-C., et al., Childhood blood lead levels and intellectual development after ban of leaded gasoline in Taiwan: a 9-year prospective study. Environ Int, 2012. 40(1): p. 88-96.
22. Hauser, R., et al., Temporal variability of urinary phthalate metabolite levels in men of reproductive age. Environ Health Perspect, 2004. 112(17): p. 1734.
23. Hoppin, J.A., et al., Reproducibility of urinary phthalate metabolites in first morning urine samples. Environ Health Perspect, 2002. 110(5): p. 515.
24. Frederiksen, H., et al., Temporal Variability in Urinary Phthalate Metabolite Excretion Based on Spot, Morning, and 24-h Urine Samples: Considerations for Epidemiological Studies. Environ Sci Technol, 2012.
25. Frederiksen, H., N.E. Skakkebaek, and A.M. Andersson, Metabolism of phthalates in humans. Mol Nutr Food Res, 2007. 51(7): p. 899-911.
Part II.
二、 產前全氟碳化物暴露與孩童注意力缺陷過動症症 狀之相關探討
Prenatal exposure to perfluorinated chemicals and attention deficit/hyperactivity symptoms in children at
7 years of age
摘要
背景:全氟化合物(perfluorinated chemicals; PFCs)是一種環境中持久污染物,可以 穿過胎盤屏障進入胎兒循環。動物研究指出,成年小鼠暴露全氟碳化物可能導致 神經行為缺陷。然而目前探討全氟辛酸(perfluorooctanoic acid, PFOA)、全氟辛烷磺 酸(perfluorooctyl sulfonate, PFOS)暴露與兒童注意力缺陷過動症症狀(attention deficit hyperactivity disorder; ADHD)的流行病學研究結果有限且無明確定論。
目的:本研究主要目的為探討臍帶血中全氟辛烷磺酸(PFOA)、全氟辛烷磺酸 (PFOS)、全氟壬酸(perfluorononanoic acid; PFNA)和全氟酸(perfluoroundecanoic acid;
PFUA)與兒童注意力缺陷過動症症狀之相關性。
方法:本研究對象為Taiwan Birth Panel Study (TBPS)及 Taiwan birth cohort study (TBCS)共計 282 對母親與孩童。研究對象來自位於台北、雲林、嘉義、台南、高 雄、台東的醫療中心、地區醫院以及診療所的生產婦女,於產後進行結構式問卷 訪談,並於生產時收集胎兒臍帶血樣本。臍帶血血漿中全氟碳化合物之濃度以極 致效能液相層析/串聯式譜儀(ultra-high performance liquid chromatography tandem mass spectrometry, UPLC-MS/MS)測量。以注意力缺陷過動症中文版 Swanson, Nolan, and Pelham, Version IV (SNAP-IV)量表、長處與困難問卷(Strengths and Difficulties Questionnaire; SDQ)以及兒童行為檢核表(Child Behavior Checklist;
CBCL)評估注意力缺陷過動症之特徵情形。統計方法上,使用多變項回歸分析,
校正性別、哺餵母乳、母親年齡、母親教育程度後、母親懷孕期間二手煙及飲酒
暴露、胎次、家庭年收入、週數、出生體重、臍帶血中鉛濃度等潛在干擾因子,
探討全氟碳化合物濃度與兒童注意力缺陷過動症之相關。並使用分層分析,以50、
75、90 百分位作為切點,將 PFCs 濃度分為由低到高四個程度,探討其劑量效應。
結果:PFOA,PFOS,PFNA 和 PFUA 濃度的中位數與四分位距(IQR)分別為 0.75
(1.9),3.7(3.5),1.29(4.3),2.86(11.0)ng/mL。本研究發現,全氟壬酸 PFNA 和 SNAP-IV 量表中的注意力不集中(inattention)以及對立違抗性障礙(oppositional defiant disorder)呈顯著負相關。
結論: PFNA 與注意力不集中及對立違抗性障礙之間發現負相關結果。未來需要
更多的研究來闡明因果關係。
關鍵詞:注意力缺陷過動症、全氟化合物、兒童
Abstract
Background: Perfluorinated compounds (PFCs), persistent pollution in
environment, can cross the placental barrier and enter fetal circulation.
Animal studies report exposure to the PFCs can give irreversible change in mouse brain and affect fetal growth and development. The association between perfluorooctanoic acid (PFOA) and perfluorooctyl sulfonate (PFOS) exposure and ADHD symptoms is controversial in epidemiological studies.
Objectives: We evaluated the association between prenatal exposures to
PFOA, PFOS, perfluorononanoic acid (PFNA) and perfluoroundecanoic acid (PFUA) and ADHD symptoms.
Methods: A total of 282 mother–newborn pairs from various medical
facilities, which included three medical centers, one local hospital, and
eight clinics, recruited from May 2004 to July 2005, and completed the all
follow-up interviews. Cord blood samples were collected at birth and
analyzed for PFOA, PFOS, perfluorononanoic acid (PFNA), and
perfluoroundecanoic acid (PFUA) by ultra-high performance liquid
chromatography/tandem mass spectrometry. When the children were 7
years of age, we assessed children behavioral health by using the Chinese
version of the Swanson, Nolan, and Pelham, version IV scale (SNAP-IV),
the Strengths and Difficulties Questionnaire (SDQ), and the Child Behavior
Checklist (CBCL). We divided PFCs in four categories, with cut points at the 50th (the reference category), 75th, and 90th percentiles in linear regression model to examine the relationship between nature log transformed PFCs concentrations and rating scales.
Results: After adjusting for potential confounding factors, we found that
increased PFNA concentrations were inversely associated with inattention and oppositional defiant disorder in SNAP.
Conclusions: PFNA are protected with inattention and oppositional defiant
disorder in SNAP, but not found in CBCL and SDQ. More studies are needed to elucidate the causal relationship.
Key words: attention deficit/hyperactivity disorder (ADHD),
perfluorinated compounds (PFCs), young children
Contents
摘要 ... x Abstract ... xii Contents ... xii Contents of figures ... xv Contents of tables ... xvi Introduction ... 23 Materials and Methods ... 25
Study design and participants ... 25 Exposure assessment ... 25 The Swanson, Nolan, and Pelham IV scale (SNAP-IV) ... 27 Child Behavior Checklist (CBCL) ... 27
Strengths and Difficulties Questionnaire (SDQ) ... 27 Covariates ... 29 Statistical Analysis ... 30 Discussion ... 33 Appendix 1. The scoring of SNAP-IV items... 43 Appendix 2. The scoring of items for CBCL... 44 Appendix 3. The Classification for 25 SDQ items and each 5 domains ... 45 Appendix 4. Compare PFCs level in this study with similar target study ... 46 Appendix 5. Compare with similar target study concerning PFCs and ADHD. ... 47 Reference ... 48
Contents of figures
Figure 1. Sample preparation procedures for serum or plasma samples. ... 42
Contents of tables
Table 1. Demographic characteristics of the study population ... 37 Table 2. PFCs level in cord blood in this study ... 38 Table 3. Health outcome in this study ... 39 Table 4. Demographic characteristics of all study population and median (range) of PFC levels (ng/mL). ... 40 Table 5. Mean and standard error of SNAP-IV, CBCL, and SDQ across different
categories of PFC levels (ng/mL) in linear regression models a. ... 41
Introduction
Perfluorinated compounds (PFCs), persistent pollutions in environment, can cross the placental barrier and enter fetal circulation. They were first produced in the 1950 s, and have been used in a variety of consumer and industrial products. They are a group of synthetic chemicals used as surfactants, surface treatment chemicals, and processing aids for many products, including repellent coatings on carpet, textiles, leather, and paper. Exposure occurs through transfer from food packaging and preparation materials, bioaccumulation in the food chain, and household dust.
In preview study, animal studies report exposure to the PFCs can give irreversible change in mouse brain and affect fetal growth and development. Johansson et. al found neonatal exposure to PFOS and PFOA affected the cholinergic system, manifested as a hypoactive response to nicotine, compared to a hyperactive response to nicotine in controls. PFOS and PFOA developmental neurotoxic effects are similar to those we reported earlier for PCBs and PBDEs. PFOS and PFOA be included in the group of POPs known to be developmental neurotoxicants.[1].
However, the results of animal study are equivocal to human epidemiologic studies. In epidemiological study, one study examined developmental milestones in relation to PFC exposure. In this sub-study from the Danish National Birth Cohort (n = 1,400), early pregnancy plasma PFOA and PFOS levels were essentially unrelated to motor or mental development through 18 months of age, although there were weak associations between increased PFOS levels and sitting without assistance or using wordlike sounds to indicate wants [2].
Three studies have evaluated the association between perfluorooctanoic acid (PFOA)
and perfluorooctylsulfonate (PFOS) exposures and ADHD disease or symptom in children. One study which examining the association between PFCs exposure and attention deficit/hyperactivity disorder (ADHD) in children from the 1999—2000 and 2003—2004 NHANES has indicated increased odds of disease with higher serum PFC levels [3]. However, these finding is inconsistent with the other two studies, the current data provides only limited evidence that higher prenatal exposures cause ADHD symptoms in children.
Based on the above, the results of human epidemiologic studies are equivocal to animal study. Moreover, the association between perfluorooctanoic acid (PFOA) and perfluorooctyl sulfonate (PFOS) exposure and ADHD disease or symptom in children is controversial in preview epidemiological studies. Therefore, the objective in this study is to evaluate the association between prenatal exposures to PFCs and ADHD symptoms.
Materials and Methods
Study design and participants
This study was combined with the Taiwan Birth Panel Study (TBPS) and Taiwan birth cohort study (TBCS). The study participants were recruited from three medical centers, one local hospital, and eight clinics. These facilities were located in various cities and counties which included Taipei, Yune-Lin, Chia-Yi, Tainan, Kaohsiung, and Taitung.
A total of 282 mother-child pair was enrolled from April 2004 to January 2005 [4].
Subsequently, we continued to follow-up these subjects to children’s school age at 6 to7 years old, then we measured their ADHD symptom in this time point. For measure ADHD symptoms in children, we prepared three rating scales, the Child Behavior Checklist [5], the Strengths and Difficulties Questionnaire [6] and the Chinese version of the Swanson, Nolan, and Pelham rating scale version IV [7]. First, we cleaned and edited the data. To avoid the influence of smoking, we excluding those participants whose mother actively smoked during pregnancy. Moreover, according standard procedures, CBCLs with more than 8 missing item ratings were also excluded (N=3).
This study has been approved by the ethical committee of National Taiwan University Hospital, and the subjects signed the inform consent after visitors introduce the purpose of each surveys [4].
Exposure assessment
Cord blood samples were collected at birth and analyzed for PFOA, PFOS, perfluorononanoic acid (PFNA), and perfluoroundecanoic acid (PFUA) by ultra-high performance liquid chromatography/tandem mass spectrometry [8]. Samples were processed with protein precipitation using formic acid and methanol, mixed with stable
isotope labeled standard, followed by sonication and centrifugation, and were analyzed using a Waters ACQUITY UPLC coupled with a Waters Quattro Premier XE triple-quadrupole mass spectrometer. All samples were primarily prepared using protein precipitation. Firstly, the frozen samples were thawed at room temperature and then were vortexed for 30 s to ensure homogeneity. 100 µL of plasma sample in polypropylene centrifuge tube was vortexed with 100 µL of 1% formic acid (pH 2.8) for 30 s. Then 80 µL of methanol and 20 µL of 0.375 ng/mL internal standard solution (13C8-PFOA) were added to each sample before the second vortex. The mixture was sonicated for 20 min and then centrifuged at 14,000 rpm (14,462×g) for 20 min using a bench top centrifuge. The supernatant was collected ( 150µL) and then was filtered through 0.22-µm PVDF syringe filter into a 2.0 mL auto-sampler vial. Ten calibration standard solutions were prepared in 100 µL of bovine plasma and went through sample preparation under the same procedure, which the concentrations of all analytes were equivalent to 0.15–300 ng/mL in bovine plasma with a fixed amount of internal standard (75 ng/mL). The instrument was operated in selected reaction monitoring (SRM) with negative electrospray ionization. Using BEH C18 column (2.1 mm×50 mm, 1.7 µm) with 10-mM N-methylmorpholine/methanol gradient elution provided a fast chromatographic separation (5.5 min) and sharp peaks [8].
The Swanson, Nolan, and Pelham IV scale (SNAP-IV)
The SNAP-IV, a revision of the Swanson, Nolan and Pelham (SNAP) questionnaire , has been used in several clinical trials to assess the efficacy of treatment for ADHD and cross-sectional studies to screen for ADHD [9, 10]. Chinese version of SNAP-IV was translated by Suan Shur-fen Gau with the Dr. Swanson’s agreement. The scale of SNAP-IV, contain 26-items, is includes the DSM-IV criteria for Attention Deficit Hyperactivity Disorder (ADHD) and Oppositional Defiant Disorder (ODD).
The domain of ADHD included inattention and hyperactivity/impulsivity (see Appendix 1). Each item is rated on a four-point rating scale (0 if not at all, 1 if just a little, 2 if quite a bit and 3 if very much) [11-13].
Child Behavior Checklist (CBCL)
The Child Behavior Checklist (CBCL) is a parental report which is concerned their children aged 4-18. CBCL measures eight narrow-band behavioral syndromes and two broad-band behavioral which were defined according to Achenbach [5]. Eight narrow-band behavioral syndromes include anxious/depressed, withdrawn, somatic complaints, social problems, thought problems, attention problems, rule-breaking behavior and aggressive behavior. The broad-band syndromes include internalizing problems (sum of withdrawn, somatic complaints, and anxious/depressed), externalizing problems (sum of rule-breaking behavior and aggressive behavior). Internalizing refers to psychological problems within the child itself and is made up of the subscales:
withdrawn, somatic complaints, and anxious/depressed; Externalizing encompasses those problematic behavior that are related to the child in relation with others (social environment) and is made up of rule-breaking and aggressive behavior.
The total problems were summed of eight narrow-band syndromes scores together (see Appendix 2). The items are scored on a 3-point scale (0 if not true, 1 if somewhat true or sometimes true, and 2 if very true or often true). Any item with missing data below 15% was replaced with the mode of the other individuals’ response in that item. [14].
Strengths and Difficulties Questionnaire (SDQ)
The Strengths and Difficulties Questionnaire (SDQ), a 25-item behavioral screening questionnaire completed by parents, reflected their children’s behavior in the past 6 months. The SDQ comprising five domains (emotional, conduct, hyperactivity, peer and social disorders) is also a validated tool to screen for hyperactivity and attention problems among children [6, 15]. The responses for each item were coded as 0 for “not true”, 1 for “partly true” and 2 for “very true”. The score for each of the five scales is generated by summing the scores for the five items that make up that scale, thereby generating a scale score ranging from 0 to 10. The scores for hyperactivity, emotional symptoms, conduct problems, and peer problems were further summed to generate a total difficulties score ranging from 0 to 40. The prosocial score is not incorporated in the reverse direction into the total difficulties score since the absence of prosocial behavior is conceptually different from the presence of psychological difficulties. (see Appendix 3).
Covariates
We investigated a number of covariates in the association between PFCs and ADHD.
The covariates included socio-demographic information, life style, characteristics of the child's birth and environmental exposures. Socio-demographic information (i.e., age, gender, annual family income and maternal education) and life style (i.e., breast-feeding and alcohol during pregnancy) was elicited by interview and the structured
questionnaire. The annual family income was dichotomized into above versus below 100,000 new Taiwan dollars (NTD) per year. The maternal education was stratified on the basis of the level of school (senior high school and below/college and above). The maternal alcohol intake as determined by questionnaire was dichotomized into "yes"
versus "no" consumption of alcohol during pregnancy. Because advanced maternal age was associated with a higher risk of adverse pregnancy outcomes, we also considered mother’s age at childbirth which were classified into two groups by age 35 years.
The characteristics of the child's birth (i.e., birth weight, gestational age, birth parity and deliver type) were from reliable medical records. Birth weight was classified into two groups “less than 2,500 gm versus greater or equal than 2,500 gm) according the WHO definition of low birth weight. Gestational age was defined into two groups by 37 weeks because the WHO definition of preterm birth. The environmental exposures to
environmental tobacco smoke (ETS) including prenatal exposure to ETS during pregnancy and postnatal ETS at children five years old were described on the questionnaire. Moreover we determined the lead level in cold blood.
Statistical Analysis
First, we cleaned and edited the data. To avoid the influence of smoking, we excluding those participants whose mother actively smoked during pregnancy.
Moreover, according standard procedures, CBCLs with more than 8 missing item ratings were also excluded (N=3). Secondly, we examined the distribution of the independent and dependent variable to check for possible errors by scatter plot. We found an extreme distribution in low level side relative to the rest of the data, because the detect limit of PFCs concentration in the two cohort study were different. Therefore, we divided PFCs in four categories, with cut points at the 50th (the reference category), 75th, and 90th percentiles in linear regression model and also weight study group. The confounding adjustment set included children sex, breast feeding, mother age, maternal education, birth parity, maternal ETS during pregnancy, maternal alcohol during
pregnancy, annual family income, gestational age, birth weight, lead level in cord blood (g/dL), study group. The selection of potential confounders based on prior knowledge and literature[16]. On the other hand, due to exposure was relatively low in most people and variance was considerably greater at the higher exposure end, we displayed the median with range of PFC concentrations. All statistical analyses were performed using SAS software system (9.2 vision, Statistical Analysis Systems, Inc., Cary, NC).
Results
There were totally 282 mother-child pairs in our study. First, in overall, the gender distribution of study population was as follows: male, n=145 (51.4%); female, n=
137(48.6 %), this distribution was also similar in separate study. The mean (± SD) age of all participants was 7.0±0.8 years (Table 1). The mean (± SD) of children’s birth weight was higher than 2500gm. The percent number in mother who has habit of
breast-feeding in TBPS is larger than TBCS. In table 1, we also found the characteristics about socio-demographic information (i.e., maternal education, maternal age at baby born and annual family income) in TBPS are higher than TBCS.
Table 2 shows that the median (IQR, interquartile range) levels for four kinds of PFCs.
In totally, the median (IQR) of PFOA, PFOS, PFNA, and PFUA were 0.75 (1.86), 3.7 (3.45), 1.29 (4.32), and 2.86 (10.99) ng/mL, respectively. In separate, we can also found that all of PFCs levels in TBPS were higher than TBCS.
Table 3 showed the PFCs levels which were stratified by every covariates. By way of stratified analysis, we can found the PFCs concentration with children’s gestational age less than 37 weeks were higher than gestational age greater than 37 weeks. Similarly, we found the PFCs concentration with children’s birth weight greater than 2,500 gm were higher than birth weight less than 2,500 gm. On the other hand, the levels with annual family income greater than 1 million were higher than annual family income less than 1 million.
Table 4 shows the distribution of the SNAP-IV, CBCL and SDQ scores for this study population. First, the mean (± SD) scores of SNAP were respectively 6.9 (5.7), 5.3 (5.6) and 5.6 (5.0) for inattention, hyperactivity/Impulsivity and oppositional defiant disorder.
Secondly, the mean(± SD) of scores of broad-band syndromes in CBCL were