259
Using Frontier Efficiency Analysis to Measure Impacts of Financial Holding Company System on Operational
Performance of Subsidiary Banks
CHU-FEN LI ∗
Department of Finance and Graduate Institute of Business and Management, National Formosa University, Taiwan.
ABSTRACT
In response to international competition after Taiwan joined the WTO, the successive establishment of financial holding companies gives impetus to the trend towards shareholding concentration, large-scale organizational structure and diversification of services for financial institutions, all of which are expected to have major impacts on the future of Taiwan's banking industry.
This study attempts to explore the influence of a financial holding company (FHC) system on the operational performance of subsidiary banks by using a sample of domestic banks taken during the period 1999-2007. Techniques of nonparametric frontier efficiency analysis are employed to measure the banks’ performance. The major findings of the study are as follows. First, in general, there were no significant differences in operational performance between the FHC and non-FHC subsidiary banks.
However, the former outperformed the latter in technical efficiency after the FHC Act came into effect and, from then on, new FHCs were set up one after another. Second, the FHC subsidiary banks showed no apparent improvement in operational performance after the formation of FHCs. Third, the FHC subsidiary banks were significantly different from the non-FHC banks in terms of productivity change and technological change as well as scale efficiency before joining the FHCs. However, the differences became insignificant after they joined the FHCs. Fourth, the changes in technology, technical efficiency and scale efficiency of the FHC subsidiary banks presented a statistically significant difference between the pre- and post- establishment periods of their FHCs.
Key words: banking, financial holding company (FHC), efficiency, performance, productivity.
1. INTRODUCTION
The banking sector of Taiwan has been facing many challenges over the past 15 years. Since 1990, the government has made continuous efforts to accelerate liberalization and globalization of the banking market in Taiwan. Among the various financial measures adopted, the deregulation of the establishment of commercial banks was one of the most important measures that radically altered the banking landscape of Taiwan. In April 1990, the Commercial Bank Establishment Promotion Decree was enacted to relax the long-standing restriction on the establishment of new banks. The number of domestic banks grew substantially, from 25 in 1990 to 53 in 2000, which makes the banking market far more competitive and forces the banks to squeeze margins in their traditional businesses. Additionally, to enable domestic financial institutions to compete with
∗ Corresponding author. E-mail: cfli@nfu.edu.tw
260
international financial conglomerates after Taiwan’s entry into the WTO in January 2002, the government promulgated the Financial Institutions Merger Act in December 2000, and subsequently the Financial Holding Company (FHC) Act in July 2001, aiming to promote the consolidation of the banking system.
Under the FHC Act, financial institutions are encouraged to integrate and diversify services, as well as to enlarge economies of scale. They are allowed to form FHCs, and to invest in subsidiaries engaging in different kinds of financial services such as banking, insurance, securities, bills financing, and venture capital.
So far, there have been 14 FHCs in Taiwan. Among them, four were set up by the end of 2001, after the FHC Act took effect in November of the same year. In the following year, the number rose to 13, an increase of nine companies as compared with the number the year before. Moreover, one more FHC was added at the beginning of 2003. Each FHC has two or more wholly owned subsidiary firms involved in banking, insurance, securities, and other related industries. Most of them have a subsidiary bank as their core enterprise. The successive establishment of FHCs gives impetus to the trend towards shareholding concentration, large-scale organizational structure and diversification of services for financial institutions.
The expected advantage of a FHC is the ability to create higher levels of synergy by cost saving, revenue increase and efficiency enhancement through cross-selling of a variety of financial products. However, could diversified FHCs really achieve the desired performance improvement and outperform other non-FHC competitors? Would FHCs suffer a decrease in operational performance due to their diversification of financial services instead? It is undoubtedly a topic worthy of further investigation. This study focuses on the impact of a diversified FHC system on the operational performance of subsidiary banks by comparing the operational performance between FHC subsidiary banks and non-FHC subsidiary banks. To the best of my knowledge, there is very little literature available on this topic. Although several previous studies on financial firms have examined a similar issue as to whether increased diversification affects performance (Saunders
& Walters, 1994; DeYoung & Roland, 2001; Stiroh, 2004a; Stiroh, 2004b; Stiroh
& Rumble, 2006), there has been mixed empirical evidence supporting the anticipated diversification benefits. To explore the effects of the FHC system, this study provides a framework for performance evaluation by applying nonparametric frontier efficiency analysis techniques to a sample of domestic banks over the last eight years. The major objectives of the study are: (1) to investigate the performance and the pattern of changes in performance for individual banks, both FHC subsidiary banks and non-FHC banks; (2) to analyze the main sources of inefficiency as well as productivity changes; (3) to compare the differences in performance between FHC and non-FHC subsidiary banks; and (4) to examine and interpret the effects of the FHC system on the operational performance of subsidiary banks.
The remainder of this paper is organized as follows. Section 2 introduces the approaches of frontier efficiency analysis that are used in this study. Section 3 describes the empirical data, along with an explanation of variables. Section 4 reports and discusses the empirical results. Finally, some conclusions are made in Section
261
2. METHODOLOGY
In this study frontier efficiency analysis techniques are employed to investigate the impact of FHCs on the operational performance of subsidiary banks.
This section introduces two popular frontier efficiency analysis approaches: (1) data envelopment analysis (DEA) and (2) malmquist productivity index (MPI).
2.1 Data Envelopment Analysis (DEA)
The DEA is basically a mathematical programming technique initially developed by Charnes, Cooper and Rhodes (1978). Unlike parametric frontier approaches, DEA does not require any assumptions concerning the functional form, i.e., the form of the underlying production relationship. The DEA frontier is formed as the piecewise linear combinations that connect a set of the best-practice banking units, which are obtained from the observed sample, yielding a set of convex production possibilities. Thus, a maximal efficiency measure for each unit relative to all other units in the observed data set can be calculated only with the requirement that each unit lies on or below the external frontier.
The most important characteristics of the DEA methodology can be presented by the CCR model (Charnes et al., 1978). For the discussion that follows, let us suppose that there are k banks to be evaluated. Each BANK i (i =1, 2,…, n) consumes varying amounts of p inputs to produce q outputs and each has at least one positive input and one positive output. The primal input-oriented CCR model is formulated as follows.
, 1 1
q p
o s so r ro
s r
max ER y x
μ ω μ ω
= =
⎛ ⎞ ⎛ ⎞
= ⎜ ⎟ ⎜ ⎟
⎝
∑
⎠ ⎝∑
⎠1 1
. q s si p r ri 1 1, 2, ,
s r
st μ y ω x for i n
= =
⎛ ⎞ ⎛ ⎞ ≤ =
⎜ ⎟ ⎜ ⎟
⎝
∑
⎠ ⎝∑
⎠ Lωr≥ ε, r = 1, 2, …, p;
μs ≥ ε, s = 1, 2, …, q,
where the subscript (o) denotes the banking unit being evaluated from the observed data; ERo represents the efficiency rating of the unit being evaluated; xri
and ysi indicate the observed amount of input r and output s for BANKi, respectively; ωr and μs stand for the weight for input r and output s, respectively;
and ε is a non-Archimedean infinitesimal constant.
The CCR model in Problem (1) uses reference technology of constant returns to scale (CRS). The BCC model proposed by Banker, Charnes and Cooper (1984) relaxes the restriction of CRS technology to accommodate technology of variable returns to scale (VRS) for calculating pure technical efficiency measures. Scale for i = 1, 2, …, n; (1)
262
efficiency can thereby be obtained by computing the ratio of technical efficiency to pure technical efficiency. A BCC model is formulated as follows.
, 1 1
q p
o s so o r ro
s r
max ER y u x
μ ω μ ω
= =
⎛ ⎞ ⎛ ⎞
=⎜ − ⎟ ⎜ ⎟
⎝
∑
⎠ ⎝∑
⎠1 1
. 1 1,2, ,
q p
s si o r ri
s r
st μ y u ωx for i n
= =
⎛ − ⎞ ⎛ ⎞ ≤ =
⎜ ⎟ ⎜ ⎟
⎝
∑
⎠ ⎝∑
⎠ L ; (2)ωr≥ ε, r = 1, 2, …, p;
μs ≥ ε, s = 1, 2, …, q;
μο free.
On the whole, the formulation of the BCC model is analogous to the CCR model and the variables in the BCC model have interpretations similar to the ones used in the CCR model. Nevertheless, we should note that the variable uo appears in the above problem. The existence of this convexity constraint shrinks the feasible region for the BCC model from the conical hull considered in the CCR model to the convex hull of the banking units. This convexity requirement provides the basis for measuring economies of scale in DEA.
2.2 Malmquist productivity index (MPI)
This section explains how to measure changes in total productivity, as well as changes in production technology, in each banking unit’s distance to the production frontier, and in scale size for each unit evaluated. The analysis employs the notion of an output distance function proposed by Shephard (1970), which measures how much a unit’s outputs can be proportionately increased given the observed levels of its inputs. The structure of production technology is assumed to exhibit CRS. We describe the structure of production technology with the output distance function as follows.
{ }
( , ) | ( , )
t t t t t t
i i i i
f x y =min φ x y φ ∈P . (3) which measures the output technical efficiency of banking unit i at time t relative to the technology at time t (Shephard, 1970). Since technical efficiency is measured relative to the contemporaneous technology, we havef x yt( , )it it ≤ 1, with
( , )
t t t
i i
f x y = 1, signifying that unit i is on the production frontier and is hence technically efficient, and f x yt( , )it it < 1, indicating that the unit is below the frontier and is technically inefficient.
Before describing our methodology, the MPI analysis, we need to define distance functions with respect to two different time periods. The efficiency of unit i at time t relative to the technology at time t + 1 is represented by
for i = 1, 2, …, n;
263
ft+1( ,x yit it)=min
{
φ| ( ,x yit it φ)∈Pt+1}
. (4) Similarly, the efficiency of unit i at time t + 1 relative to the technology at time t is defined by the distance functionf xt( it+1, yit+1)=min
{
φ| (xit+1, yit+1 φ)∈Pt}
. (5) Caves, Christensen and Diewert (1982) defined the MPI as1 1 1 1
( , , , ) ( , ) ( , )
t t t t t t t t t t t
i i i i i i i i
M x
+y
+x y = f x
+y
+f x y
, or1( 1, 1, , ) 1( 1, 1) 1( , )
t t t t t t t t t t t
i i i i i i i i
M + x+ y+ x y = f + x+ y+ f + x y . (6) The indices in Equation (6) provide measures of changes in productivity. To avoid choosing an arbitrary benchmark, two continuous MPIs are combined into a single index by computing the geometric mean and then decomposing multiplicatively this index into two subindices measuring changes in technical efficiency and technology as follows (Färe, Grosskopf, Lindgren, & Roos, 1989;
Färe et al., 1992).
, 1 1( 1, 1) ( , )
t t t t t t t t
i i i i
Eff + f + x+ y+ f x y
Δ = , (7) and
{ }
1 2, 1 ( 1, 1) 1( 1, 1) ( , ) 1( , )
t t t t t t t t t t t t t t
i i i i i i i i
Tech + ⎡f x+ y+ f + x+ y+ ⎤ ⎡f x y f + x y ⎤
Δ = ⎣ ⎦ ⎣× ⎦ . (8)
The ratio in (7) is an index of changes in technical efficiency between periods t and t+1, measuring whether unit i moves closer to or farther away from best-practice units during the time period. The value of ⊿Eff is greater than, equal to or less than unity depending on whether the relative efficiency of unit i is improving, unchanging or declining, respectively during the period. The term
⊿Tech in (8) is an index of changes in technology, which gives the geometric mean of two ratios. A value of ⊿Tech greater than, equal to or less than unity indicates progress, no change or regression in technology, respectively between periods t and t+1.
From Equations (6) to (8), the relationship between the MPI and its two subindices is
, 1 , 1 , 1
t t t t t t
M + = ΔEff + × ΔTech + . (9)
Clearly, changes in productivity include changes in both efficiency and
264
technology with Mt,t+1 greater than, equal to or less than unity representing a gain, stagnation or a loss of productivity, respectively between periods t and t+1.
In principle, one may calculate the MPI in (6) relative to any technology pattern. The CRS technology is adopted to compute the MPI and its two subindices in the preceding analysis. Now we further disaggregate ⊿Eff into a component of pure technical efficiency ⊿PEff calculated relative to the VRS technology, and a component of scale efficiency change ⊿SEff capturing change in the deviation between the VRS and CRS technologies, according to the suggestion of Färe and Grosskopf (1994). That is:
, 1 , 1 , 1
t t t t t t
Eff + PEff + SEff +
Δ = Δ × Δ (10) where
, 1 1( 1, 1) ( , )vrs
t t t t t vrs t t t
i i i i
PEff + f + x+ y+ f x y
Δ = (11)
, 1 1( 1, 1) 1( 1, 1) ( , ) ( , )
t t t t t crs t t t vrs t t t crs t t t vrs
i i i i i i i i
SEff + ⎡f + x+ y+ f + x+ y+ ⎤ ⎡f x y f x y ⎤
Δ = ⎣ ⎦ ⎣ ⎦ (12)
and the subscripts “v” and “c” denote VRS and CRS technologies, respectively.
⊿PEff >1 indicates an increase in pure technical efficiency; while ⊿PEff <1 indicates a decrease, and ⊿PEff =1 indicates no change in pure technical efficiency. Similarly, ⊿SEff >1 implies that the most efficient scale is increasing over time, so the scale efficiency is improving; while ⊿SEff <1 implies the opposite, and ⊿SEff = 1 indicates no change in scale efficiency.
3. DATA DESCRIPTION
The target population for this study comprises all domestic banks in operation from 1999-2006. The time period is selected because during the middle of this study period, the new financial holding companies (FHCs) began to be set up, one after another. The population size for the study has increased from 40 banks in 2006 to a high of 53 banks during 2000-2001. The total number of domestic banks fluctuate to some extent mainly because of mergers and acquisitions as well as bankruptcy and insolvency. After deleting the banks that have missing information for one or more years, there are 30 banks left that make up our sample. Of those, 43% are subsidiary banks of FHCs, while the rest, 57%, are non-FHC subsidiary banks, who have not yet joined FHCs.
According to the relevant theories and literature, eight variables are used in this study. Labor, capital, deposits and interest expenses are four inputs. Labor is measured by the number of full-time equivalent employees. Capital is measured by book value of fixed assets and premises. Deposits include time deposits, savings deposits, demand deposits and other deposits. Interest expenses indicate the
265
interest expenses paid for deposits. In addition, loans, interest income, investments and non-interest income are four outputs. Loans include secured loans and fiduciary loans. Investments consist of short-term and long-term investments.
Interest income means the interest incomes earned from making loans.
Non-interest income is income from operations excluding interest income. All values of the variables are given on December 31 for every year. Summary statistics for inputs and outputs for the overall period 1999-2006 are reported in Table 1.
Table 1. Average output and input measures
1999 2000 2001 2002 2003 2004 2005 2006
Labor 2,361 2,429 2,464 2,586 2,897 3,110 3,412 3,494 Capital 7,719 8,027 8,378 8,636 9,188 9,148 9,680 10,095 Deposits 289,168 311,248 332,551 339,238 371,559 402,888 443,796 510,159 Interest expense 15,916 16,544 14,596 8,771 5,765 5,662 8,058 10,566
Loans 268,011 286,895 292,227 291,203 312,246 339,394 370,309 419,975 Investments 49,368 44,767 50,233 50,243 89,457 104,474 108,802 112,854 Interest income 21,731 23,202 21,543 17,072 13,940 14,515 18,207 18,614 Non-interest
income 5,475 4,963 5,305 4,497 5,620 6,792 6,964 7,040 Note: All variables except labor are measured in millions of NT dollars. Labor is measured in units.
4. RESULTS
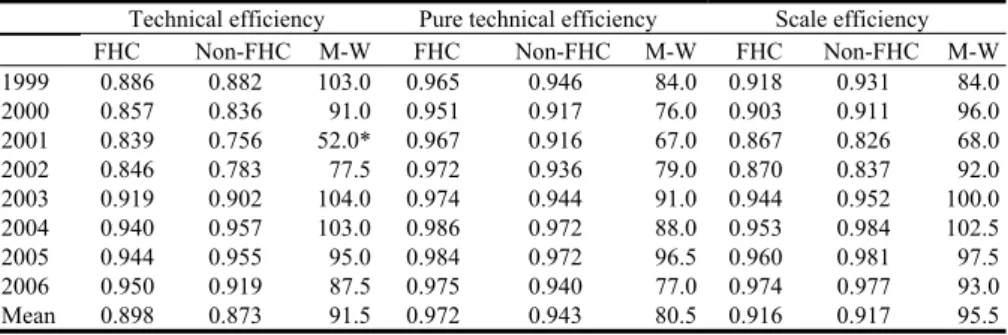
We first use the DEA approach in Programs (1) and (2) in Section 2 to measure performance of banks within a cross-sectional context. Table 2 calculates the average technical, pure technical and scale efficiencies for the FHC and non-FHC subsidiary banks over the study period of 1999-2006 and compares those between the FHC and non-FHC subsidiary banks using the Mann-Whitney U test.
Table 2.Differences in performance between FHC and non-FHC subsidiary banks Technical efficiency Pure technical efficiency Scale efficiency FHC Non-FHC M-W FHC Non-FHC M-W FHC Non-FHC M-W 1999 0.886 0.882 103.0 0.965 0.946 84.0 0.918 0.931 84.0 2000 0.857 0.836 91.0 0.951 0.917 76.0 0.903 0.911 96.0 2001 0.839 0.756 52.0* 0.967 0.916 67.0 0.867 0.826 68.0 2002 0.846 0.783 77.5 0.972 0.936 79.0 0.870 0.837 92.0 2003 0.919 0.902 104.0 0.974 0.944 91.0 0.944 0.952 100.0 2004 0.940 0.957 103.0 0.986 0.972 88.0 0.953 0.984 102.5 2005 0.944 0.955 95.0 0.984 0.972 96.5 0.960 0.981 97.5 2006 0.950 0.919 87.5 0.975 0.940 77.0 0.974 0.977 93.0 Mean 0.898 0.873 91.5 0.972 0.943 80.5 0.916 0.917 95.5 Note: *indicates statistical significance at the 5% level.
266
From the table, we can find that the values of all efficiency indices are between 0.756 and 0.986, indicating that, on average, operating inefficiencies did exist within both FHC and non-FHC subsidiary banks. Such inefficiencies were primarily caused by a combination of pure technical efficiency and scale efficiency, attributed to wasteful overuse of resources and inappropriate scale of operations, respectively. Furthermore, the results suggest that the FHC subsidiary banks have been enhancing their performance year by year; however, there were no differences in performance between the FHC and non-FHC subsidiary banks at the 5% test level with only one exception, although the FHC subsidiary banks have been enhancing their performance year by year. The exception was that the technical efficiency of FHC subsidiary banks was significantly superior to that of non-FHC banks in 2001, when the FHC Act came into effect with new FHCs being set up one after another.
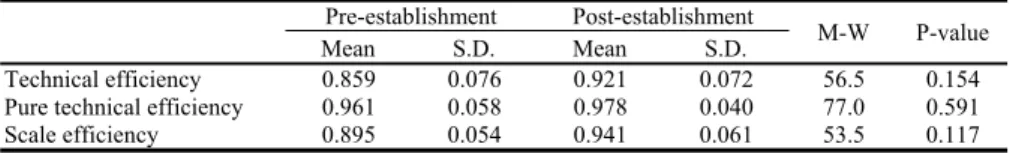
Table 3 reveals the arithmetic means and standard deviations of technical, pure technical and scale efficiencies for subsidiary banks during the pre- and post-establishment periods of their FHCs. The Mann-Whitney U test was performed to compare the differences between both periods for each efficiency index. The average values in the table reveal a rising trend in each of the efficiency indices. However, for subsidiary banks, there were no statistically significant differences in performance between the pre- and post-establishment periods of FHCs at the 5% test level. That is, the subsidiary banks showed no apparent improvement in their operational performance after the formation of their FHCs.
Therefore, by combining the above evidences, it seems that the FHC system did not distinctly help improve the operational performance of subsidiary banks during the study period.
Table 3. Differences in bank performance between the pre- and post-establishment periods of FHCs
Pre-establishment Post-establishment
M-W P-value Mean S.D. Mean S.D.
Technical efficiency 0.859 0.076 0.921 0.072 56.5 0.154 Pure technical efficiency 0.961 0.058 0.978 0.040 77.0 0.591 Scale efficiency 0.895 0.054 0.941 0.061 53.5 0.117 Note: No results are statistically significant at the 5% level.
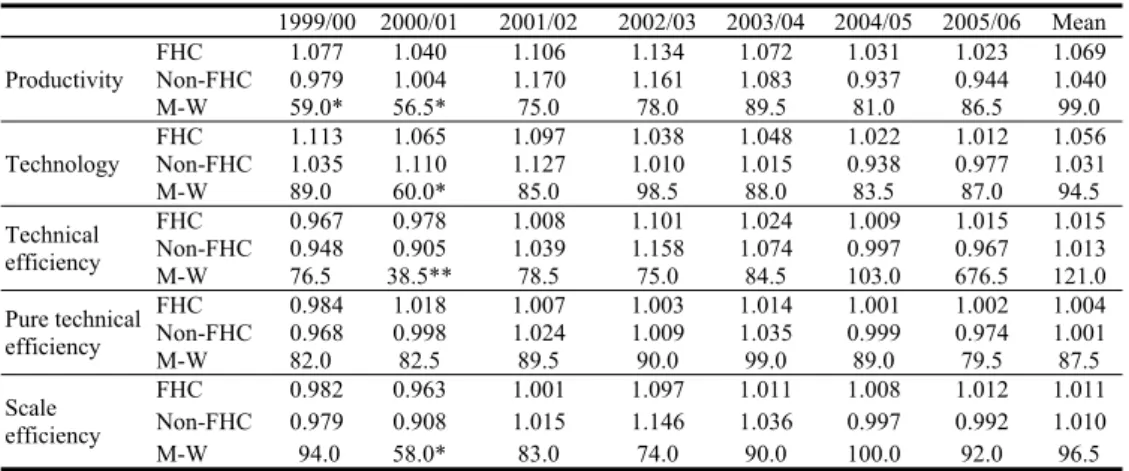
Table 4 investigates the magnitudes and sources of changes in performance for FHC and non-FHC subsidiary banks over the study period and compares the differences between both categories of banks by the Mann-Whitney U test. The values of productivity indices shown in the table are geometric means of two MPIs shown in Equation (6). It will help get a possible explanation for the origins of changes in productivity when the productivity index is decomposed into four subindices, i.e., changes in technology, technical efficiency, pure technical efficiency and scale efficiency. The value of the index greater than, equal to or less than unity indicates progress, no change or regression in that, respectively between
267 the two adjacent periods.
Table 4 Differences in changes in performance between FHC and non-FHC subsidiary banks
1999/00 2000/01 2001/02 2002/03 2003/04 2004/05 2005/06 Mean
Productivity
FHC 1.077 1.040 1.106 1.134 1.072 1.031 1.023 1.069 Non-FHC 0.979 1.004 1.170 1.161 1.083 0.937 0.944 1.040 M-W 59.0* 56.5* 75.0 78.0 89.5 81.0 86.5 99.0 Technology
FHC 1.113 1.065 1.097 1.038 1.048 1.022 1.012 1.056 Non-FHC 1.035 1.110 1.127 1.010 1.015 0.938 0.977 1.031 M-W 89.0 60.0* 85.0 98.5 88.0 83.5 87.0 94.5 Technical
efficiency
FHC 0.967 0.978 1.008 1.101 1.024 1.009 1.015 1.015 Non-FHC 0.948 0.905 1.039 1.158 1.074 0.997 0.967 1.013 M-W 76.5 38.5** 78.5 75.0 84.5 103.0 676.5 121.0 Pure technical
efficiency
FHC 0.984 1.018 1.007 1.003 1.014 1.001 1.002 1.004 Non-FHC 0.968 0.998 1.024 1.009 1.035 0.999 0.974 1.001 M-W 82.0 82.5 89.5 90.0 99.0 89.0 79.5 87.5 Scale
efficiency
FHC 0.982 0.963 1.001 1.097 1.011 1.008 1.012 1.011 Non-FHC 0.979 0.908 1.015 1.146 1.036 0.997 0.992 1.010 M-W 94.0 58.0* 83.0 74.0 90.0 100.0 92.0 96.5 Note: *, ** indicate statistical significance at the 5% and 1% level, respectively.
From Table 4, it can be seen that both FHC and non-FHC subsidiary banks have enjoyed advances in productivity and technology in the vast majority of cases during the entire study period. A few exceptions came from the non-FHC subsidiary banks during 1999-2000 and 2004-2005. Overall, non-FHC subsidiary banks made more steady progress in productivity and technology, on average by 4.0% and 3.1% per year, respectively. In contrast, FHC banks were able to make noticeable improvements, with they average annual growth rates being 7.7% and 6.4%, respectively. However, the differences in the change in both productivity and technology between the two categories of banks attained statistical significance only for the periods 1999-2001 and 2000-2001, respectively. That is, FHC subsidiary banks were significantly different from non-FHC banks in terms of changes in both productivity and technology before joining FHCs. However, the differences became insignificant after joining FHCs.
On average, both FHC and non-FHC subsidiary banks exhibited an increase in each of the remaining subindices such as technical, pure technical and scale efficiencies, but with a slower average yearly rate. The patterns of changes in technical and scale efficiencies were somewhat similar for both categories of banks. They first suffered a decline in technical and scale efficiencies during 1999-2001 but showed an improvement thereafter. Nevertheless, distinct from FHC subsidiary banks, non-FHC banks failed to generate progress during 2004-2006. Additionally, FHC subsidiary banks changed their technical and scale efficiencies faster than non-FHC banks during the periods 1999-2001 and 2004-2006, while the latter made more rapid changes during the other periods.
However, only during 2000-2001, the differences in changes in technical
268
efficiency between the two categories of banks were able to reach statistical significance of 5%. The subindex measuring changes in pure technical efficiency followed a pattern somewhat similar to the foregoing two subindices. The statistical evidence from this study, however, was not strong enough to support that there was a significant difference between FHC and non-FHC subsidiary banks during the same period.
The combined results from Table 4 seem to reveal the following. Throughout the study period, both FHC and non-FHC subsidiary banks have, on average, experienced rapid growth in productivity. Such a productivity gain could be attributed to a combination of advances in technology and improvements in various efficiencies. In particular, more speedy progress in technology was found to occur within both categories of banks and that provided great impetus for their productivity growth.
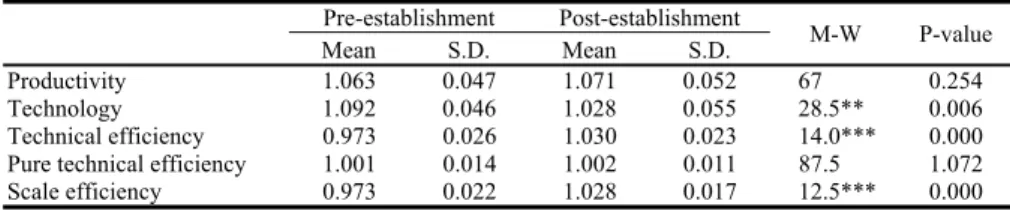
Table 5. Differences in changes in bank performance between the pre- and post-establishment periods of FHCs
Pre-establishment Post-establishment
M-W P-value
Mean S.D. Mean S.D.
Productivity 1.063 0.047 1.071 0.052 67 0.254 Technology 1.092 0.046 1.028 0.055 28.5** 0.006 Technical efficiency 0.973 0.026 1.030 0.023 14.0*** 0.000 Pure technical efficiency 1.001 0.014 1.002 0.011 87.5 1.072 Scale efficiency 0.973 0.022 1.028 0.017 12.5*** 0.000 Note: **, *** indicate statistical significance at the 1% and 0.1% level, respectively.
Table 5 summarizes the arithmetic means and standard deviations of performance change indices including changes in productivity, technology, technical efficiency, pure technical efficiency and scale efficiency for FHC subsidiary banks during their pre- and post-establishment periods of FHC, and compares the differences between both periods for each index using the Mann-Whitney U test. As can be seen, each index related to performance change improved faster for the subsidiary banks after the establishment of their FHCs, with the exception of change in technology. The subsidiary banks experienced technological progress during both pre- and post-establishment periods of FHCs, though the speed slackened slightly during the post-establishment period. The differences in changes in technology attained statistical significance at the 5% test level. In addition, at the 0.1% test level, changes in both technical and scale efficiencies of subsidiary banks also presented a statistically significant difference between the pre- and post-establishment periods of their FHCs.
5. CONCLUSIONS
This study explores the impact of the FHC system on the operational
269
performance of subsidiary banks using a sample of domestic banks during the period 1999-2006. Techniques of nonparametric frontier efficiency analysis are employed to measure the banks’ performance. The major findings of the study are as follows:
First, in general, there were no significant differences in performance between FHC and non-FHC subsidiary banks. However, FHC subsidiary banks outperformed non-FHC banks in technical efficiency after the FHC Act just came into effect and, from then on, new FHCs were set up one after another.
Second, FHC subsidiary banks showed no apparent improvement in operational performance after the formation of FHCs. Thus, the FHC system did not distinctly help improve the performance of subsidiary banks during the study period.
Third, FHC subsidiary banks were significantly different from non-FHC ones in changes in productivity and technology as well as scale efficiency. However, the differences became insignificant after joining the FHCs.
Fourth, changes in technology, technical efficiency and scale efficiency of FHC subsidiary banks presented a statistically significant difference between the pre- and post-establishment periods of their FHCs.
REFERENCES
Banker, R. D., Charnes, A., & Cooper, W. W. (1984). Some models for estimating technical and scale inefficiencies in data envelopment analysis. Management Science, 30(9), September, 1078-1092.
Caves, D.W., Christensen, L.R. and Diewert, W.E. (1982). The Economic theory of index numbers and the measurement of input, output and productivity, Econometrica, 50(6), 1393-1414.
Charnes, A., Cooper, W. W., & Rhodes, E. (1978). Measuring the efficiency of decision making units. European Journal of Operational Research, 2(6), 429-444.
DeYoung, R., & Roland K. P. (2001). Product mix and earnings volatility at commercial banks: Evidence from a degree of total leverage model. Journal of Financial Intermediation, 10(1) January, 54-84.
Färe, R. and Grosskopf, S. (1994). Estimation of returns to scale using data envelopment analysis: A comment. European Journal of Operational Research, 79(2), 379-382.
Färe, R., Grosskopf, S., Lindgren, B., & Roos, P. (1989). Productivity developments in Swedish hospitals: A Malmquist output index approach.
Discussion Paper No. 89-3, Southern Illinois University.
Färe, R., Grosskopf, S., Lindgren, B., & Roos, P. (1992). Productivity changes in Swedish pharmacies 1980–1989: A nonparametric Malmquist approach.
Journal of Productivity Analysis, 3(3), June, 85-101.
Saunders A., & Walters, I. (1994). Universal banking in the United States: What could we gain? What could we lose? New York, NY, USA. Oxford University Press.
270
Shephard, R. W. (1970). The theory of cost and production functions. Princeton, New Jersey, USA. Princeton University Press.
Stiroh, K. J. (2004a). Diversification in banking: Is noninterest income the answer?
Journal of Money, Credit, and Banking, 36(5), 853-882.
Stiroh K. J. (2004b). Do community banks benefit from diversification. Journal of Financial Services Research, 25(2-3), 135-160.
Stiroh, K. J., & Rumble, A. (2006). The dark side of diversification: The case of US financial holding companies. Journal of Banking and Finance, 30(8), August, 2131-2161.
Chu-Fen Li received her M.B.A. degree from National Chengchi University, Taiwan and her Ph.D.
degree in information management, finance and banking from Europa-Universität Viadrina Frankfurt, Germany.
She is now an associate professor in the Department of Finance and Graduate Institute of Business and Management, National Formosa University, Taiwan. Her major research interests include performance evaluation, Internet banking, online customer behavior, online auctions as well as financial institutions and markets. Her works have been published in several international refereed journals, such as European Journal of Operational Research, International Journal of Information and Management Sciences, Journal of System and Software, Expert Systems with Applications, Journal of Computer Information Systems, Asia Journal of Management and Humanity Sciences, and so forth.