國立臺灣大學公共衛生學院流行病學與預防醫學研究所 碩士論文
Institute of Epidemiology and Preventive Medicine College of Public Health
National Taiwan University Master Thesis
健康生活分數對於心血管疾病的保護作用:
台灣具代表性的世代研究
The protective effects between Healthy Lifestyle scores and the Risk of Cardiovascular diseases: a representative
Cohort study in Taiwan 蔡明潔
Ming-Chieh Tsai
指導教授:簡國龍 教授
Advisor: Kuo-Liong Chien, M.D.,Ph.D.
中華民國 109 年 8 月
June 2020
誌謝
謝謝碩士班指導教授簡國龍老師,在兩年的學業生涯中,引領我深入公共 衛生研究的領域,讓我面對未來視野更寬廣。從主題的選定,研究設計與執 行,論文的撰寫,投稿過程中與國外學者的答辯與討論,老師皆給予寶貴的建 議,並且嚴謹的指導我們科學的研究該如何完成,讓我獲得可貴的研究經驗。
感激鼓勵我前來所上就讀的葉宏一教授,李淳權醫師,劉松臻醫師,因為 師長的推薦和鼓勵讓我能進入研究所並完成碩士班修業; 感謝一路上和我亦師 亦友的葉姿麟同學,許馨尹同學,因為和你們的無間合作,無數次的討論,彼 此激勵,互相打氣,才能完成這次的研究,並且受益良多。感謝 徐麗茵學姊,
在你忙碌的博士班生涯中,還親自的協助我們高等統計的使用,在繁複的資料 庫分析中帶和我一起解決研究中的困難;感謝 莊景榮學長,你對於統計的熱 情,和寬闊願意分享的胸襟,讓我們能一窺數學之美;感謝 李惠真女士,你在 我們更樣事物上的無私支援,減輕了我們許多繁瑣的工作。
謝謝論文指導委員 葉宏一教授、白其卉教授,以及流預所李文宗教授與林 先和教授,百忙之中撥空給予指導,讓我有更多樣的眼光認識流行病學的研 究。
最後我要感謝我的家人,特別是我的父母,是你們給我的鼓勵,無私的支 援,多次的安慰,我才能有機會完成我的學業;我的先生,你用行動幫我承擔 了許多的家庭工作,讓我感受到你對我的愛與承諾;還有我兩個可愛的女兒,
讓我在緊湊的生活中,得到無數的歡笑。
摘要 背景:
合併健康生活習慣,包括理想體重,健康飲食,適當運動,不抽菸,適量的飲 酒,對於心血管疾病的保護效果過去有被證實,但是除了單純的五個健康生活 習慣相加結合成健康生活分數外,沒有研究討論過在討論心血管疾病風險時是 否需要加權不同的健康生活習慣,而且也不曾有研究將之與 World Cancer Research Fund (WCRF)/American Institute for Cancer Research (AICR) 為 了預防癌症所提出的健康生活分數,或是美國心臟醫學會所提出的 Life’s Simple 7 健康生活分數做心血管疾病發生風險預測比較。
方法:
我們使用一個平均年齡 43 歲,50.2%女性的全國代表性世代追蹤資料庫【三高 主題資料庫】排除掉在 2002 年受訪前健保資料有記錄到心血管疾病的 6042 位 受訪者,我們定義簡單台灣健康分數為一個包含理想體重、地中海飲食、適量 運動、不抽菸、規則飲酒的五個向度的加總分數。我們並且使用這五個因子對 於心血管疾病多變量模型中的係數值(coefficient)做為權重,另外加總成一個 權重的台灣心血管健康分數。我們並且使用 WCRF/AICR 2018 年對於健康生活分 數的定義和美國心血管協會對於 Life’s Simple 7 的定義,使用三高主題資料 庫去驗證這健康生活分數對於心血管疾病的保護效果,並且比較四個健康生活
分數對於心血管疾病的預測能力。
結果:
在一個平均 13.4 年的追蹤期間,全部共有 520 個心血管疾病發生,多變量的存 活分析顯示,在簡單和加權台灣健康分數最高的組別,相較分數最低的組別,
心血管疾病發生率顯著的下降 56~57%,並且年紀是有意義的干擾因子。但在校 正了許多臨床因子之後,WCRF/AICR 的健康生活分數和 Life’s Simple 7 卻 沒有辦法觀察到顯著的保護效果。在年紀小於 60 歲的族群,因著健康生活分數 的保護讓心血管疾病下降的幅度顯著的大於等於 60 歲的族群。除此之外,在 AUC 和 NRI, IDI 對模型的預測力統計量當中,簡單和權重的台灣健康生活分 數相較於 WCRF/AICR 健康生活分數和 Life’s Simple 7 有較好且顯著的增加 預測效果。
討論與結論:
我們證明了健康生活分數較高的人相較較低的人,心血管疾病發生率有顯著的 下降,並且下降的幅度在年輕人更為明顯。進一步的研究探討綜合所有健康生 活習慣對於心血管疾病的保護機轉是有必要的。
關鍵字:
健康生活分數,心血管疾病
Abstract Background
The protective effect of different healthy lifestyle scores for the risk of cardiovascular disease (CVD) was reported but the comparisons of performance were lack. We compared the performance measures of cardiovascular diseases from different healthy lifestyle scores among adult Taiwan.
Methods
We conducted a nationwide prospective cohort study of 6042 participants (median age 43 years, 50.2% women) in Taiwan’s Hypertensive, Hyperglycemia,
Hyperlipidemia Survey, 2002 who were free of CVD at baseline. Simple Taiwan healthy lifestyle score was defined as a normal body mass index, Mediterranean diet
>= points, adequately physical activity 1~150 mins/week, not smoking and regular healthy drinking. A weighted healthy Taiwan healthy lifestyle score also was created, where each dichotomous lifestyle factor was first weighted according to its
independent magnitude of effect. World Cancer Research Fund (WCRF) and the American Institute for Cancer Research (AICR) cancer prevention recommended lifestyle and Life's Simple 7 following the definition proposed by the American Heart Association were all created.
Results:
During a median 13.4 years follow-up period, totally 520 cases developed CVD events. In multivariate-adjusted Cox proportional hazard models, adherence to highest category compared with lowest one of simple Taiwan lifestyle score for hazard ratio 0.43 (95% confidence interval [CI] 0.2, 0.94) and weighted Taiwan lifestyle score for 0.44 (95%CI 0.28, 0.68) were independently and significantly (figure 1). In addition, age played a significant effect modifier for the protective effect of healthy lifestyle scores for CVD risk and more reduction of CVD incidence was observed among adults <60 years old and adults ≧60 years old. Specifically, when the simple and weighted Taiwan healthy lifestyle score were added to the classical model, the
Harrell’s C-statistic increasing from 0.85 to 0.86 (95% confidence interval [CI], 0.84, 087; Pdiff=0.02) in both lifestyle scores. The performance measures by integrated discriminative improvement showed significant increasing after adding simple Taiwan healthy lifestyle score (integrated discriminative improvement: 0.51, 95% CI 0.16, 0.86, P=0.002) and weighted
Taiwan lifestyle score (integrated discriminative improvement: 0.38, 95% CI 0.01,0.74, P=0.021) information.
Conclusion:
We demonstrated that healthy lifestyle scores had protective effect of CVD, and the reduction of CVD risk was more for young adults than for old adult. Further
investigations to study the mechanism of lifestyle role on CVD prevention are warranted.
Keywords:
Healthy lifestyle score,cardiovascular diseases
Table of Contents
誌謝
... 2摘要
... 3Abstract ... 5
Table of Contents ... 8
List of Figures ... 11
List of Tables ... 13
Chapter One:Introduction ... 16
1.1 Ideal weight ... 16
1.2 Mediterranean diet ... 19
1.3 Physical activity ... 21
1.4 Tobacco control-- Non-smoking ... 22
1.5 Adequate Alcohol Consumption ... 23
1.6 Combined healthy lifestyle factors ... 24
1.7 Weighted combined healthy lifestyle score ... 26
1.10 Taiwanese Survey on Hypertension, Hyperglycemia, and Hyperlipidemia (TwSHHH) ... 29
1.11 Hypothesis and Research Gap ... 30
Chapter Two:Materials and Method ... 33
2.1 Study design and participants ... 33
2.2 Assessment of health lifestyle factors ... 34
2.3 Simple Taiwan healthy lifestyle scores ... 36
2.4 Weighted Taiwan healthy lifestyle score ... 37
2.5 The World Cancer Research Fund International/ American Institute for Cancer Research (WCRF/AICR) lifestyle score ... 37
2.6 Life’s Simple 7 score ... 39
2.7 Measurements of blood pressure, weight and height measurement ... 41
2.8 Measurement of biochemistry markers ... 41
2.9 Important covariates ... 42
2.10 Outcome ascertainment and prospective follow-up ... 44
2.11 Statistical Analyses ... 44
Chapter Three:Result ... 49
3.1 Demographic and lifestyle characteristics among participants at baseline .... 49
3.2 Lifetime risk of cardiovascular disease ... 50
3.3 Healthy lifestyle scores and lifetime risk of CVD ... 51
3.4 Healthy lifestyle scores and CVD risk in adult < 60 years old and ≧ 60 years old ... 53
3.5 Comparing different healthy lifestyle scores ... 53
3.6 Sensitivity analysis ... 54
Chapter Four:Discussion ... 56
4.1 Main finding ... 56
4.2 Comparing with previous studies ... 56
4.3 Biological mechanism ... 63
4.4 Clinical implication ... 64
4.5 Strengths and limitations ... 65
Chapter Five:Conclusion ... 67
Reference ... 68
Figure ... 91
Table ... 113
Appendix ... 184
List of Figures
Figure 1: Kaplan-Meir survival curves for the risk of cardiovascular specified in the study participants among participants stratified by the numbers of healthy lifestyle factors ... 91 Figure 2: Hazard ratios for cardiovascular disease specified by categories
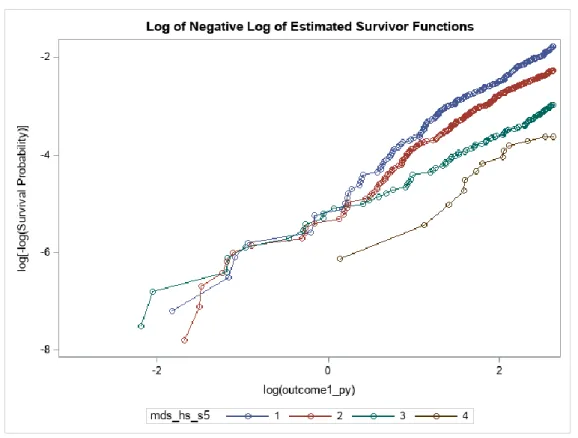
according to the numbers of healthy lifestyle factors among participants stratified by simple Taiwan healthy lifestyle score, weighted Taiwan healthy lifestyle score, WCRF/AICR recommended healthy lifestyle score and Life’s Simple 7 ... 94 Figure 3: The log(-log(survival time)) versus log of CVD event-free survival time
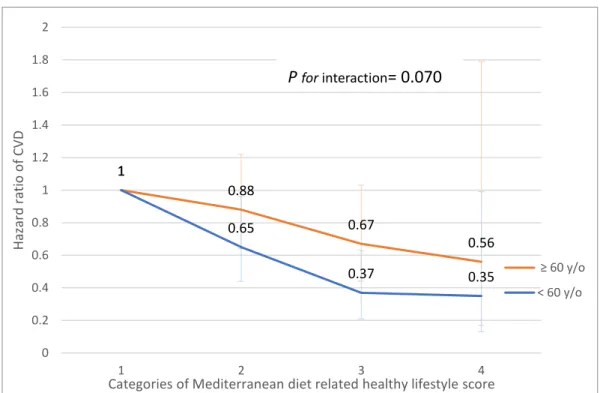
including time independent covariates ... 96 Figure 4: Hazard ratios for cardiovascular disease with categories according to the
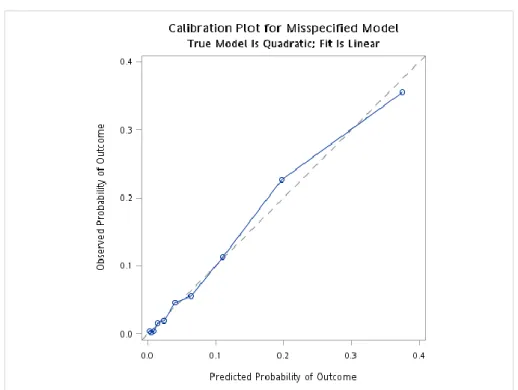
numbers of healthy lifestyle factors among participants stratified by age < 60 y/o and ≥ 60 y/o ... 102 Figure 5: Calibration plot of predicted mean 12.5.following-up years
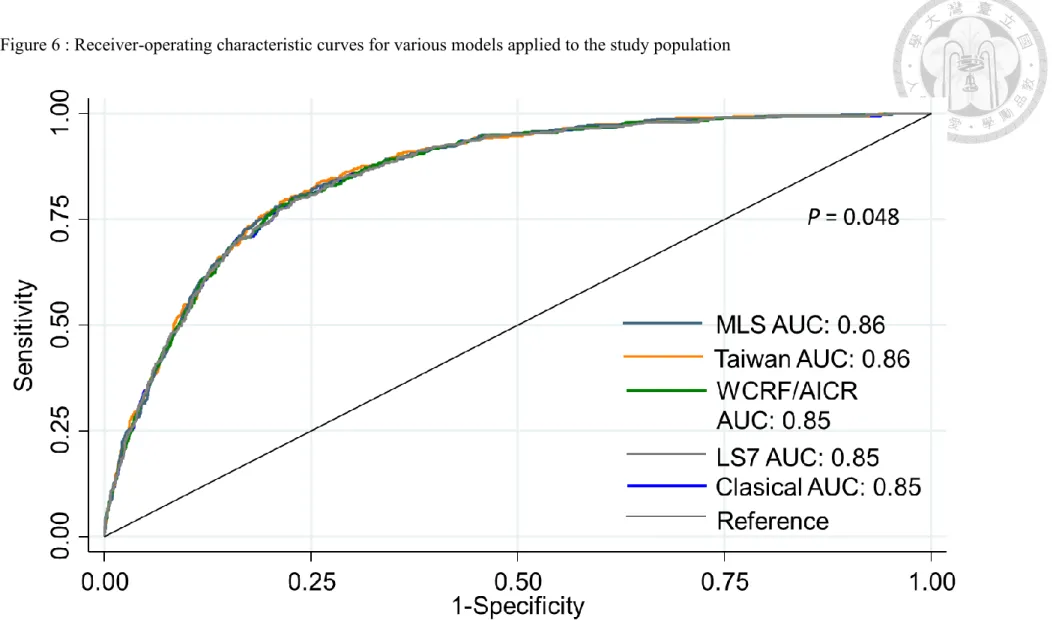
cardiovascular disease (CVD) risk within deciles against the observed 12.5 following-up years CVD risk in the TWsHHH data (N=6048). Data are plotted among participants stratified by lifestyle scores ... 105 Figure 6 : Receiver-operating characteristic curves for various models applied to
the study population ... 108 Figure 7: The relationship between the healthy lifestyle score and CVD ... 109 Figure 8: Infographic about the Taiwan healthy lifestyle scores and the reduction
of CVD incidence ... 111
List of Tables
Table 1 Characteristic of participants in 20 cohort studies ... 113
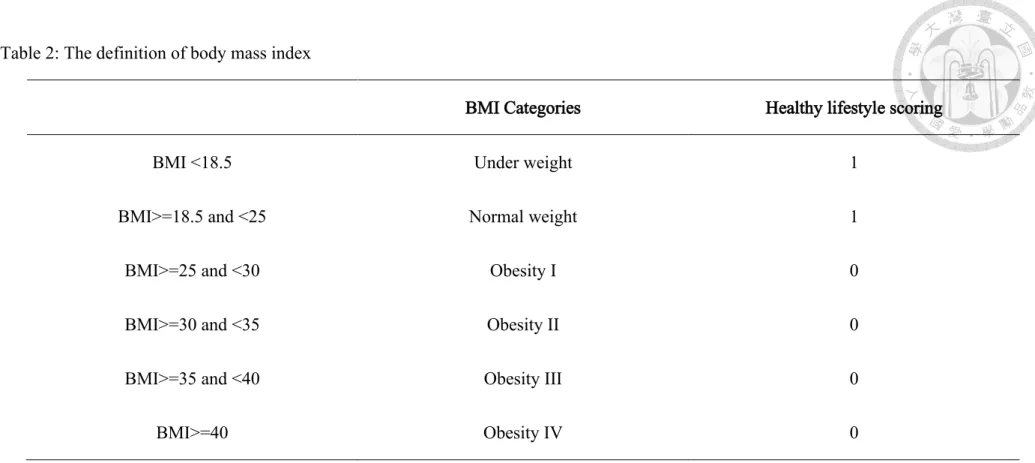
Table 2: The definition of body mass index ... 122
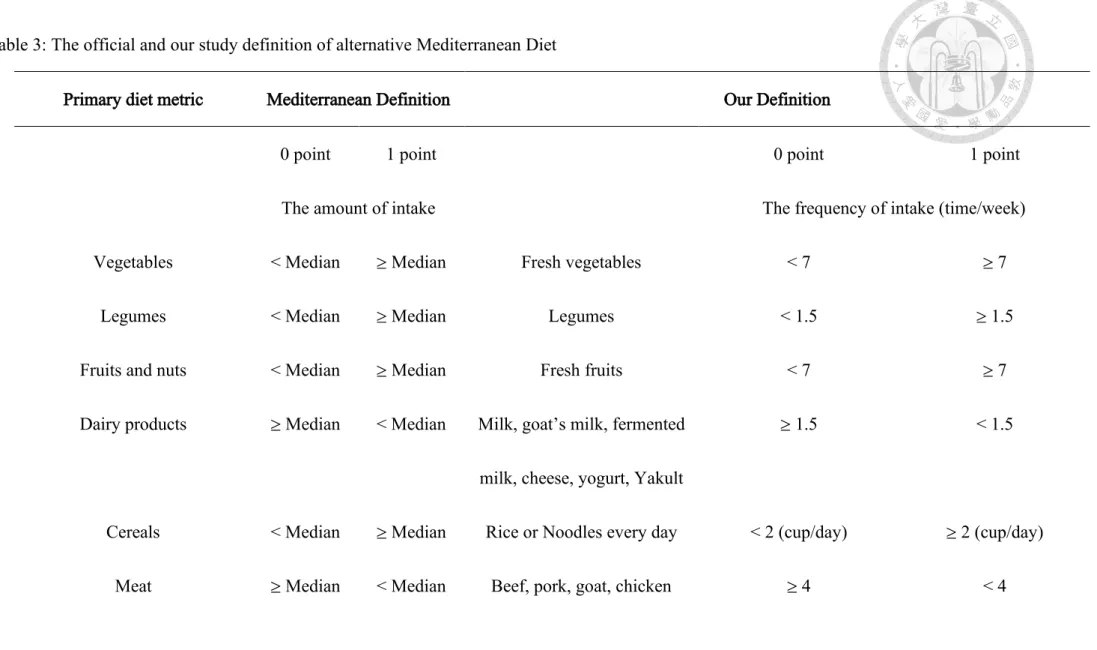
Table 3: The official and our study definition of alternative Mediterranean Diet ... 123
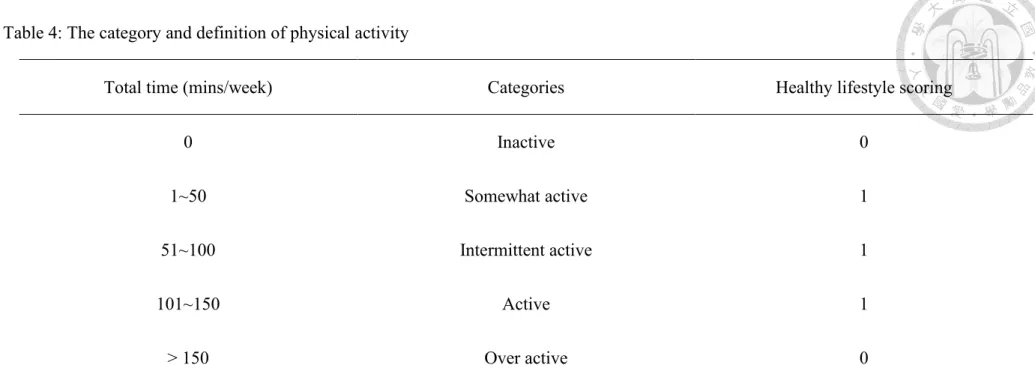
Table 4: The category and definition of physical activity ... 126
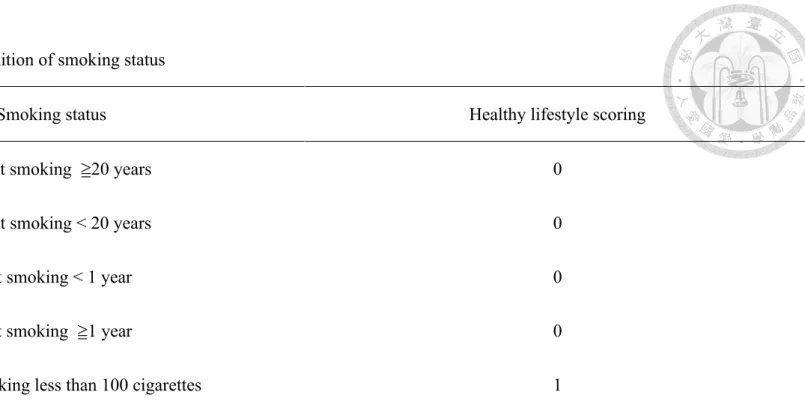
Table 5: The category and definition of smoking status ... 127
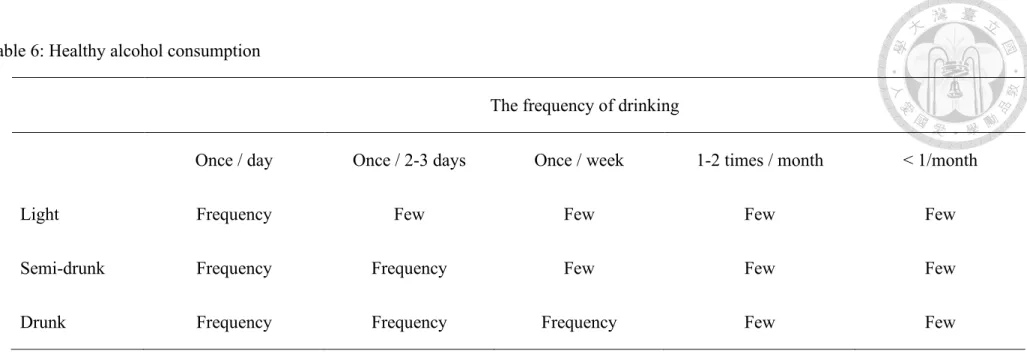
Table 6: Healthy alcohol consumption ... 128
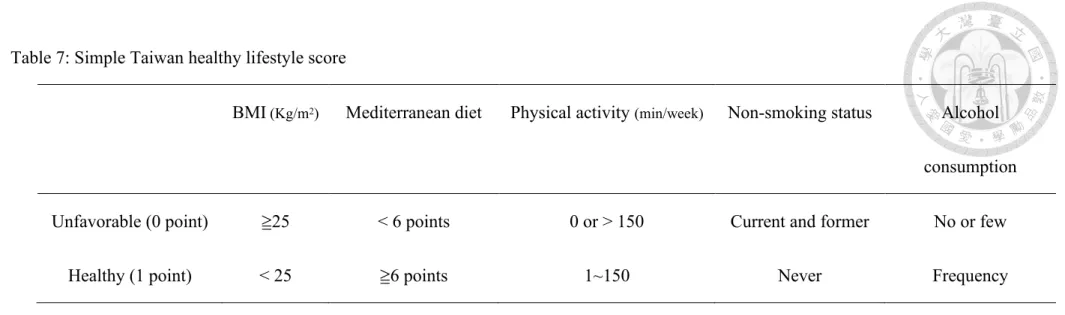
Table 7: Simple Taiwan healthy lifestyle score ... 129
Table 8: Weighted Taiwan healthy lifestyle score ... 130
Table 9: The official 2018 WCRF/AICR recommended healthy lifestyle score and our study definition ... 131
Table 10: Life’s Simple 7 criteria: reference from 2010 AHA definition of ideal Cardiovascular Health and our study definition... 137
Table 11: Life’s Simple 7 healthy diet criteria: reference from 2010 AHA definition of ideal Cardiovascular Health and our study definition ... 140
Table 12: The definition of important covariates ... 142 Table 13: International Classification of Diseases—Clinical Modification
(ICD-CM) and procedure codes used to define the metabolic syndrome
and clinical outcome in the study cohort ... 144 Table 14: Basic characteristics of the study participants at baseline,
specified by adherence numbers of healthy lifestyle scores ... 148 Table 15: The incidence cases, follow-up person-years, and the rates of
cardiovascular disease events and the hazard ratios and 95%
confidence intervals ... 166 Table 16: The incidence cases, follow-up person-years, and the rates of
cardiovascular disease events and the hazard ratios and 95%
confidence intervals ... 172 Table 17: Hazard ratios for cardiovascular disease among participants
stratified by different covariates, specified by simple Taiwan healthy lifestyle score, weighted Taiwan healthy lifestyle score, WCRF/AICR recommended healthy lifestyle and Life’s Simple 7 according to the numbers of healthy lifestyle factors ... 177 Table 18: Improvement in discrimination performance and calibration for
risk prediction of cardiovascular events in the multivariate-adjusted model after including simple Taiwan healthy lifestyle score, Taiwan healthy lifestyle score, WCRF/AICR recommendation lifestyle and Life's Simple 7 ... 179
Table 19: Sensitivity test of the incidence cases, follow-up person-years, and the rates of cardiovascular disease events and the hazard ratios and 95% confidence intervals ... 181
Chapter One:Introduction
Cardiovascular diseases are the leading cause of non- communicable disease with an estimated 31% deaths in worldwide with 17.9 million annually in 2016,1-2 with 85%
attributed to coronary heart disease related heart attack (7.4 million) and stroke (6.7 million). Cardiovascular diseases also caused 330 million years of life lost and another 35.6 million years lived with disability, 2-3 especially in the middle and low- developed country. National United declaimed a 25% relative reduction in the overall mortality from non-community disease.1 The cardiovascular disease attributed more than 30% and landed a greatest challenges in global public health.
In response, the World Health Organization (WHO) has committed to reducing 25%
premature mortality from non-communicable diseases4-5 by 2025, and one-third premature death by 2030. Due to the possible prevention of multifactorial etiology of cardiovascular disease, primordial approach focusing on ideal weight, promotion of healthy foods (fruits, vegetables, legumes and nuts), curbing unhealthy foods (saturated fats, trans fats, refined carbohydrates), physical activity regular, tobacco control and adequate alcohol consumption6 have been promotion.
1.1 Ideal weight
High BMI and associated risk factors account for an estimated 9.7 million annually CVD deaths in the world, after adjusted by multi-causality and for mediation or the effects of high BMI by blood pressure, total cholesterol, and glucose.7
There is now an abundance of prospective cohort studying BMI as a CVD risk factor in most regions. Recent researches pooled cohorts and trials not only by age and sex but also by ethnicity and region, especially in western and Asia populations. Although east Asia is the largest number of deaths attributable to the high BMI associated factors, especially those attributable to high blood pressure, the relative risk for the effects of BMI and CVD are similar between Asian and western population.7-8
Considering the variety of BMI attributable CVD death stratify according to age in different income level countries, in high-income countries 24% of deaths attributable below 70 years of age and 76% in people aged 70 years and older. Respectively, 43%
and 57% in low- and middle-income countries.
Obesity, as measured by body mass index (BMI), was a growing public health issue and increasing disease burden since 1990. Obesity had contributed estimated 4.0 million deaths globally and two third of deaths related to high BMI were due to
cardiovascular disease.9 Various groups of researchers have worked with the causal relationship between obesity and cardiovascular diseases. For example, Toledo had reported a monotonic linear association between body mass index (BMI) and the cardiovascular risk factors (hypertension, diabetes mellitus and/or metabolic
syndrome) already increased at a threshold of BMI as 22 kg/m2 in young adults. The multivariate-adjusted odds ratio for the cardiovascular risk factors for BMI 22-25.9 kg/m2, 25-29.0 kg/m2, >30 kg/m2, compared with BMI <22 kg/m2, were 1.3, 2.7 and 4.0, respectively among 10639 participants follow up 2-6 years. Eckel has
demonstrated an meta-analysis of obesity participants with metabolic health, defined as absence of metabolic syndrome, compared to healthy normal-weight, unhealthy normal weight and unhealthy obesity participants with relative risk as 1.45, 0.48 and 0.43, respectively.10 Riaz has investigated 5 studies with 881,692 participants in an meta-analysis and revealed obesity with a significant higher risk of coronary artery disease (OR, 1.2, 95% CI, 1.02-1.41) but no association between obesity and stroke (OR, 1.02; 95% CI, 0.95-1.09).11 Although most of studies has been consistently shown the association between obesity and coronary artery disease, overall cardiovascular disease outcome including coronary artery disease and stroke
remains controversial. Furthermore, the evidence of preventive cardiovascular disease by obesity as regard to other healthy lifestyle factors were insufficiency.
1.2 Mediterranean diet
The optimal diet to decreasing incidence of CVD, including high intakes of
vegetables and fruits, nuts and seeds, whole grains, fiber and fish and low intakes of processed meat, trans fat, sugar-sweetened beverages and other low processed carbohydrates, and salt. Although all agree the important role of optimal lifestyle to protective CVD risks from healthy diet, which diet pattern had more benefit to decrease CVD risks are still controversial. The diet-CVD associations tend to be affected by multiplicity of comparisons, correlated among various components and behavior and social-economic factors, influenced by systematic and random
measurement errors and remain selective reporting. Nonetheless, the various diet patterns complicated not only their etiology overlaps but also the potential for substitution. All of above limitations impede the robust elucidation of the presence and magnitudes of causal associations.12 When considering region and area, the food people intake had personal traits and eating habits with traditional dietary patterns. In east Asia, high salt intake and low trans fat were noted from evidence compared with western countries.13-17
Mediterranean diet are the major food groups instead of nutrition and other diet compounds of whole grains/cereals, refined grains/cereals, vegetables, fruits, nuts,
legumes, eggs, dairy products, fish, red meat, processed meat and sugar sweetened beverages. Recent nutrition and chronic disease research have suggested food-based groups may indeed facilitate processes beneficial to the reduction of coronary heart disease, stroke and heart failure.18 These specific benefits include increased the primary prevention of cardiovascular diseases with greater amount of whole grains, vegetables, fruits, nuts, legumes, dairy and fish but lower consumption of red and processed meat, eggs and sugar sweetened beverages.
Mediterranean diet pattern is a healthy dietary pattern, originally noticeable from three rural Greek villages since 25 years ago.19-20 The Mediterranean diet pattern has 9 components, including vegetables, legumes, fruits and nuts, fish, dairy products, cereals, meat and meat products, ethanol and monounsaturated vs saturated fat ratio regarding the reduction of mortality. Compared to a typical Western diet, the Mediterranean diet comprises low in saturated fat, high in monounsaturated fat (mainly from olive oil), high in complex carbohydrates (from grains and legumes), and high in fiber (mostly from vegetables and fruits). Total fat may be as high (around 40% of total energy intake) as equal to Western diet, but the difference of
Mediterranean is the 2 times even higher monounsaturated: saturated fat ratio.
Various groups of researchers have worked with the provocation of dietary
components, the biological interaction between different diet components and the associated prevention of metabolic disease, cardiovascular disease and the reduction of mortality,21 To date, Mediterranean is challenged by major difficulties in
implementing and validation of this protective dietary pattern in other geographical and culture areas.
1.3 Physical activity
Recently decades, epidemiological theorists and researchers were investigating the concept of the association of physical activity and cardiovascular disease. Literatures have noted the evidence between the association. A study of combined BMI and physical activity and the risk of hypertension, diabetes and metabolic syndrome showed physical activity with lower odds of combined end-points (adjusted odds ratio: 0.8) for >15 METs-h/week.22
Physical inactivity and insufficient activity attributes global 2.5 million CVD death and results in large CVD burden especially in high-income countries. (A comparative risk assessment of burden of disease and injury attributable to 67 risk factors and risk factor clusters in 21 regions, 1990-2010: A systematic analysis for the global burden of disease study 2010. Lancet. 2012;380:2224-2260) Since 1950s, observational
studies had indicated decreasing sedentary lifestyle and increasing physical activity were associated with the prevention of CVD incidence but the association was influenced by the same sources of error and bias such considering in diet and BMI.
The non-linear dose-response relationship were reported that the benefits of additional activity seem larger at low baseline activity level than among the population had already high activity level original.23-24
1.4 Tobacco control-- Non-smoking
Most of the previous studies on smoking described a causal association on the
cardiovascular disease. Smoker compared to non-smoker with a significant estimated pooled odds ratio (OR) of 1.61 (95% CI, 1.34-1.93) in the meta-analysis.25
Considering coronary artery disease, the men with smoking 1 cigarette per day and 20 cigarette per day compared with those without smoking had increasing relative risk 1.48 and 2.04, respectively by an meta-analysis of 55 publications including 141 cohort studies. In regards to women, the relative risks were 1.57 and 2.84,
respectively.26 The smoking status, containing current or former, compared with non- smoking both were observed significant higher risk of stroke, as 1.92 (95% CI: 1.49- 2.48) and 1.30(95% CI: 0.93-1.81), respectively.25 More literature explored the proatherogenic effect of smoking and resulted in the rising risk of cardiovascular
diseases. 27 Smoking cessation is an important and effectively preventive cardiovascular outcome.
1.5 Adequate Alcohol Consumption
Although alcohol has been consistently shown to be associated with cancers of the oral cavity, esophagus and larynx, hypertension, liver cirrhosis, chronic pancreatitis and injuries and violence, an association between alcohol and cardiovascular disease outcomes remains controversial.28 A J-shaped relation was described in multiple articles. Corrao had demonstrated a protective threshold values as consumption of alcohol less than 72g/day with minimal relative risk of 0.8 at 20g/day, and a significant growing risk since 89g/day.28 Ronksley had reported light to moderate drinking with reducing risk of coronary heart mortality as 1-2 drinks a day and of stroke mortality as ≤1 drink a day. Compared with non-drinking, Light to moderate drinking had lower relative risk for cardiovascular disease mortality, incident coronary heart disease, coronary heart disease mortality, incident stroke and stroke mortality were 0.75 (95% CI, 0.70-0.80), 0.71 (0.66-0.77), 0.75(0.68-0.81), 0.98 (0.91-1.06) AND 1.06(0.91-1.23), respectively.29 Mostofsky also explored moderate alcohol consumption had protective effect for myocardial infarction, hemorrhagic stroke (relative risk: 0.7) and ischemic stroke (relative risk 0.81) but heavy alcohol
drinking increasing the odds of cardiovascular disease.30 However, the type of alcohol is variety and drinking culture is so different worldwide with complex social- psychological issue. The clear definition of non-harmful alcohol lifestyle remains controversial.
Although the cardioprotective effect from the light or moderate drinking is still controversial, many observational studies investigated that compared with non-
drinkers, light to moderate drinking is associated lower risk of CVD and diabetes.31 A causal association between mild to moderate alcohol and ischemic heart disease and stroke were also supported by Mendelian randomization, which conduct genetic variants involved in alcohol metabolism as proxies for lifelong differences in alcohol consumption. (90) However, an increased risk of ischemic heart disease, stroke and atrial fibrillation were noted from heavy drinking accompanied with binge drinking episodes. (91-93)
1.6 Combined healthy lifestyle factors
Recent prevention medical research has explored that combined multiple healthy lifestyle behaviors compared with single one may indeed facilitate processes beneficial to the prevention of cardiovascular disease32 (table 1). For example,
Stampfer,33 Cardi,34 Carlsson,35 Paynter,36 and Diaz-Gutierrez37 had demonstrated the population with optimal healthy lifestyles with decreasing incidence of overall
cardiovascular disease (range from 0.22 to 0.45) compared with non-optimal ones.
Stampfer,33 Akesson,38-39 Ford,40 Ahmed,41 Hoevenaar-Blom,42 Chomistek,43 Hulsegge,44 Lv,45 were all reported those adherence to combined healthy lifestyle behaviors with lower odds (ranging from 0.08 to 0.54) of developing coronary artery disease compared with those with non-adherence. Ford,40 Myint,46 Zhang,47 Larsson,48 Lv45 has suggested that participants with ideal healthy lifestyle factors had reducing the risk of ischemic stroke (ranging from 0.30 to o.50). Besides the benefits of reducing cardiovascular risk in individual, combined healthy lifestyles factor had significantly population attributable fraction (ranging from 0.23-0.68) of the
cardiovascular disease.33, 38, 43, 45, 47, 49-51 Most of the studied population were from developed countries, in which the characteristics of public health challenging are non- communicated disease, like in Europe,35, 37-40, 46-48, 51-52 and in United status33-34, 36, 41,
43, 49-50, 53 and one of them in China.45 While the investigations in the most prevalent areas of cardiovascular diseases such as the undeveloped or developing countries are lack. In additions, more and more studies focused on not only the reduction of the risk but also what components of the population would modify the benefits of combined lifestyle factors to cardiovascular disease, such as gender,35, 51-52 age,54 and the
prevalence of diabetes. However, the evidence of most beneficial population who should be enhanced the healthy lifestyle factors was not sufficient and needs further study.
1.7 Weighted combined healthy lifestyle score
Most studies combine the lifestyle score with each of healthy lifestyle factor weighted equally. The combination of lifestyle with the same weight with an assumption of each factor with the same effect in lifestyle score but easily leading to
misclassification bias. Agha had reported the association between weighted healthy lifestyle score and heart failure with the similar effect as non-weighted healthy lifestyle score.49
1.8 Healthy lifestyle score from World Cancer Research Fund (WCRF)/American Institute for Cancer Research (AICR)
Seminal work on defining the prevention of cancer was carried out by hundreds of studies, still the reference point for virtually all discussion of the healthy lifestyle factors, such as diet pattern, the ideal weight, the exposure to alcohol or tobacco, in relation to cancer. Since 20 years ago, the large international, multi-center prospective cohort study, European Prospective Investigation in to Cancer and Nutrition
(EPIC),55-57 was initiated to confirmed the common sense of the foods with lower cancer risk, such as fruits and vegetables, the higher cancer risk, like fat, and meat, and the food with uncertain role of cancer risk, for example, dairy products and fish.
In 2007, World Cancer Research Fund/ American Institute for Cancer Research reported the Second Expert Report on lifestyle recommendations58 for potentially reducing cancer risk in adults based on the comprehensive meta-analysis of over 500 investigations. The recommendation defined a well-being healthy lifestyle to prevent the incidence of cancer including maintaining the body mass index in the normal range, having sufficiently physical activity, prevention of alcohol exposure and living in healthy diet pattern. The healthy diet pattern contained adequacy and moderation.
We summary the components of adequacy and moderation, that for adequacy comprised (1) fruits and vegetables, excluded potatoes, beans, corn, and peas, (2) unprocessed grains/cereals (3) legumes; and fir the moderation comprised (1) red meat, including beef, ham, bacon, sausages, liver, sweet breads, (2) sugar‐sweetened beverages, including fruit drinks, fruit juices, carbonated drinks and sugar in coffee or tea (3) sodium. Little literature has been published on the area of the diet
recommendation from World Cancer Research Fund/ American Institute for Cancer Research and the association of the cardiovascular disease risk.
1.9 Healthy lifestyle score of Life's Simple 7
As developed by the Goals and Metrics Committee of the Strategic Planning Task Force of the AHA (American Heart Association) in 2009, the 2020 Impact Goals for the organization was the reduction of 20% deaths from CVD and stroke.59 American Heart Association's had defined a construct of ideal cardiovascular health with four favorable health behaviors, including abstinence from smoking within the last year, ideal body mass index (BMI), physical activity at goal, and consumption of a dietary pattern that promotes cardiovascular health, and three health factors, such as serum total cholesterol < 200 mg/dL, blood pressure <= 120/80 mmHg, and no diabetes. and risk factors to improve cardiovascular primordial prevention. The seven including ideal weight, healthy diet, adequate physical activity, quit alcohol and the healthy cardio-prevention metrics
The association defined a new healthy concept, cardiovascular healthy which named
“Life's Simple 7”, facilitate the preventions of cardiovascular disease and stroke, included increasing the factor adherence to healthy lifestyle, contained nonsmoking, non-obesity (body mass index less than 25 kg/m2), achievement of the ideal physical activity) and healthy diet, and increase the healthy factors, such as untreated total cholesterol less than 200mg/dL, untreated blood pressure less than 120/80 mmHg and
untreated fasting plasma glucose less than 100mg/dL. According to the Life's Simple 7 categories, adults in optimal level, intermediate level and poor level have unequal risk of cardiovascular events. Nearly one hundred groups of researchers have worked with the implication and validation of the Life's Simple 7 to different population, age, gender and race.60-67 Most of the previous studies on the Life's Simple 7 described on the countries in other than Asia. The studies supported the effectiveness to improve the cardiovascular healthy in community and in early lifetime. We didn’t find any publications that reported a prospective cohort investigating the Life’s Simple 7 in Asia population.
1.10 Taiwanese Survey on Hypertension, Hyperglycemia, and Hyperlipidemia (TwSHHH)
Taiwanese Survey on Hypertension, Hyperglycemia, and Hyperlipidemia (TwSHHH) were launched in 2002 with 7578 participants, as a sub-set for hypertension,
hyperglycemia and hyperlipidemia, from Taiwanese National Health Interview Survey (NHIS) to examine the risk factor for chronic metabolic disease in Taiwanese.
As a random sampling and the link of national health insurance research database, the participants of TwSHHH could represented a national-wide population and high quality national prospective cohort with primary data information.
TwSHHH have supported many publications, providing insight into hypertension,68 hyperglycemia, hyperlipidemia, metabolic syndrome,69 cardiovascular disease70 and mortality71 as well as illuminating the role of diet, lifestyle, and genetics in chronic disease prevention. The TwSHHH studies provided evidence specific to Taiwan area that allows individuals, health care providers, and policy makers to reach informed decisions.
1.11 Hypothesis and Research Gap
The protective effects between combined healthy lifestyle factor as lifestyle score and the risk of CVD had evidence in previous studies, especially in American and
European race. However, it is unclear in Asia population whether adherence to healthy lifestyle score could further lead to the reduction in the lifetime risk of CVD and the magnitude of population attribution fraction of healthy lifestyle score on the incidence of CVD. Further, the non-weighted healthy lifestyle score assumed all lifestyle factors with the same magnitude of effect and potentially leaded to the misclassification bias. A demonstration of beneficial influence of weighted healthy lifestyle score from the reducing CVD risk has important clinical implication. Healthy lifestyle score from the recommendation of WCRF/AICR has been shown to
favorably influence of cancer risk but little evidence about CVD risk. Therefore, to exam the impact of a healthy lifestyle score from WCRF/ACIR on CVD risk is of particular interest. In addition, beside combined healthy lifestyle factors and healthy lifestyle score from WCRF/ACIR, healthy lifestyle score from American Heart Association namely Life's Simple 7 has been proposed the inverse association of CVD risk. However, we were particularly interested in the predictive performance of CVD among combined healthy lifestyle factors, healthy lifestyle score from
WCRF/AICR and Life's Simple 7. Finally, age as a potential effect modifier on the association between healthy lifestyle score and CVD has been studied in a secondary data but no validation in primary analysis. Further evidence was lack whether
targeting younger adult for primordial prevention of CVD would be more feasible compared with older adults in clinical studies.
Accordingly, the current study sought to assess whether a healthy lifestyle score, as captured by a combination of non-obesity BMI, healthy dietary quality, physical activity, non-smoking and adequate drinking is associated with CVD risk in a representative cohort of Taiwan adults from the Taiwanese Survey on Hypertension, Hyperglycemia, and Hyperlipidemia. Furthermore, we weighted each lifestyle factor according to its independent magnitude of effect on CVD and estimate the impact.
In additional, we evaluated the performance ability of different healthy lifestyle score on predicting the CVD risk.
Chapter Two:Materials and Method 2.1 Study design and participants
We conducted analyses in Taiwan’s Hypertensive, Hyperglycemia, Hyperlipidemia Survey, 2002. (Taiwan’s Triple High Survey, 2002,TwSHHH) 44, a prospective cohort of 6706 participants (age>= 15 years old )in 2002. The protocol was reviewed and approved by the Research Ethics Committee of National Taiwan University Hospital. The committee was organized under and operated in accordance with the Good Clinical Practice Guidelines (NTUH-REC Number: 201901103W [Institutional Review Board reference, IRB]). Taiwan’s Triple High Survey, 2002 was using face- to-face questionnaire interviews during March 11.2002 to August 10, 2002 and recruited 7578 random sample from Taiwan National Health Interview Survey.45-46 Participants enrolled in Taiwan’s Triple High Survey, 2002 provided information on medical history, lifestyle factors and blood drawing data. In 2007, the follow-up of the Triple High cohort was done again as Taiwan’s Triple High Survey, 2007. With the informed consent of eligible participants, the Taiwan's triple high cohort were linked to the National Health Insurance Research Database from January 1, 2000 to
December 31, 2015. The National Health Insurance program is a universal, single- payer, and compulsory health insurance system that covers 99% of the 23 million residents in Taiwan. The National Health Insurance included ambulatory care,
inpatient care, dental service, prescription drugs, registration file, and scrambled identification numbers released for public access and International Classification of Disease-9 and 10 (ICD-9 and ICD-10) codes of discharge diagnosed. In the current investigation, the Taiwan’s Triple High Survey, 2002 was used as baseline
information. All eligible participants in this study were excluded if prior to the enrollment date of 2002 Taiwan’s Triple High Survey (1) they hadn’t been 20 years old (2) they had pregnancy within 1 year (3) they had records of coronary artery disease and ischemic stroke from National Health Insurance (4) their identical numbers linking to Taiwan National Health Interview Survey or National Health Insurance Research Database were missing.
2.2 Assessment of health lifestyle factors
We considered five lifestyle factors: ideal body mass index (BMI) (table 2), alternative Mediterranean diet pattern (table 3), achievement of the physical active goal (table 4), non-smoking status (table 5), and healthy alcohol consumption (table 6). BMI was calculated as weight in kilograms divided by the square of height in meters from self-reported data in 2002 but the measurement from trained
questionnaire staff in 2007 and categorized as non-obesity (BMI < 27) and obesity (BMI≧27) according to Taiwan Recommendation (table 2). Data used to generate the
healthy diet patterns were derived from a simplified food frequency questionnaire with 20 items of food. We used the alternative Mediterranean diet score as our healthy dietary score. The alternative Mediterranean diet included 11 of the 17 primary
criteria contained in the Mediterranean dietary score (table 3): fresh vegetables, legumes, fresh fruits, dairy products (milk, goat's milk, fermented milk, cheese, yogurt, Yakult), grains (rice or noodle), meat (beef, pork, goat, chicken), fish, eggs, sweets (cookies, candies, chocolate, cakes, bread, ice cream, milkshake), nonalcoholic beverages (cola, soda or sweet-beverage), saturated lipid (burger, French frizzed, pizza). The alternative Mediterranean diet score was calculated by the frequency of intake and summed across all 11 components. Participants with an alternative Mediterranean diet score less than 6 points were assigned to non-adherence of
alternative Mediterranean diet as zero point. Those with an alternative Mediterranean diet score of six or more than six points were assigned to adherence of alternative Mediterranean diet score as 1 point.
Physical activity during the past 2 weeks were categorized as adequate active (1~50, 51~100, 101~150 minutes/week) and non-optimal active including inactive (0 minute/week) or overactive (> 150 minutes/week) (table 4). Smoking status was categorized as current Smoking≧20 year, current smoking < 20 year, quit smoking < 1 year, quit smoking≧1 year and never smoking (table 5). The participants were
questioned about the usually drinking status and categorized as frequency alcohol consumption (dinking every day with undrunk, half-drunk or drunk; drinking per 2 days with half-drunk or drunk; drinking once a week with drunk) or few (drinking less than once a week or drinking per 2 days with undrunk ) or non-alcohol consumption (table 6). A detailed description of the questions and definition on ideal BMI, healthy diet, adequate physical activity, non-smoking status and frequency alcohol
consumption was based on the current literature, recommended guidelines but also on levels realistically obtainable within the general population.
2.3 Simple Taiwan healthy lifestyle scores
We created a simple pragmatic combined healthy lifestyle score. We created a healthy lifestyle score to sum each dichotomous lifestyle factor as "optimal" versus
"nonoptimal" as follows: normal BMI (BMI < 25 kg/m2) versus obese (BMI >=25 kg/m2), alternative Mediterranean diet 6 or higher points versus less than 6 points, ideal physical activity versus unideal physical activity , never smoking versus current or quit smoking and healthy drinking versus no drinking (table 7). The participants received 1 point for each optimal criterion met, and points were summed to obtain a HL-score ranging from 0 (nonoptimal) to 5 (optimal). Participants scored one point for each of the following health lifestyle criterion met: healthy diet, non-harmful
alcohol, non-obesity, adequate physical activity and non-current smoking. Participants could therefore have a total health lifestyle score ranging from 0-5 and were divided into five lifestyle groups: unhealthy lifestyle (none, one; 0–1), intermediate unhealthy lifestyle (two healthy lifestyle factors; 2), intermediate lifestyle (three healthy lifestyle factors; 3) intermediate healthy lifestyle (four healthy lifestyle factors; 4) healthy lifestyle (five healthy lifestyle factors; 5).
2.4 Weighted Taiwan healthy lifestyle score
A weighted healthy lifestyle-score named the Taiwan healthy lifestyle score also was created, where each dichotomous lifestyle factor was first weighted according to its independent magnitude of effect (ex: beta coefficient adjusted for the other
dichotomized lifestyle factors) on cardiovascular disease risk (table 8). Taiwan healthy lifestyle score was obtained from the sum of the weighted points attained by each individual, which range from 0 (Nonoptimal) to 17 (optimal). Taiwan healthy lifestyle score was classified into 4 groups for analyzing as quintile of people for comparing with healthy lifestyle score.
2.5 The World Cancer Research Fund International/ American Institute for Cancer Research (WCRF/AICR) lifestyle score
In accordance with WCRF/AICR 2018 definition, the WCRF/AICR lifestyle score was created which was a composite numerical measure of the adherence of health lifestyle and consisting of 7 main components, with each scored based on a 0, 0.25, 0.5 and 1 scale (0 point = least healthy; 10 points = most healthy) (table 9). According to recommendation of be a healthy weight, BMI was categorized as 18.5–24.9 kg/m2, 25–29.9 kg/m2 and either <18.5 or ≥30 kg/m2 for analyses. For being physically active, total moderate-vigorous physical activity was categorized as ≥150 mins/week, 75–<150 mins/week and <75 mins/week. For health dietary habits, fruits and
vegetables were categorized according to the frequency of intake as one of them every day, one of them 1~5 times per week or both of them less than once/week; the
frequency of bean intake was categorized as intake of bean every day , 1~5 times per week or less than 1 time per week. For limited consumption of “fast foods” and other processed foods high in fat, starches or sugars, the frequency of French fried or pizza intake was representative ultra-processed foods (aUPFs) and categorized tertiles. For limited consumption of red and processed meat, the frequency of pork, beef, goat, chicken and burger intake were representative and categorized tertiles, too. Limited consumption of sugar-sweetened drinks was defined by no intake of cola, soda and other sweetened drinks, < 3 times per week or ≧3 times per week. Participants was categorized into no drinking, few drinking and frequency drinking for the
recommendation of limited alcohol consumption. All points of 7 components was sumed as WCRF/AICR healthy lifestyle score .
2.6 Life’s Simple 7 score
Based on the 2019 AHA update criteria of cardiovascular health, the Life's Simple 7 score in our study included core health behaviors (weight, diet, physical activity and smoking) and health factors (cholesterol, blood pressure and glucose control). We defined the health heart participants with body mass index of >= 30, 25~29.9 and < 25 kg/m2 as poor health, intermediate health and ideal health (table 10). We categorized achievement of the alternative ideal health diet (table 11) of Life's Simple 7: >= 7 times per week of fruits and vegetables; >= 1 times per week of fish; >= 1 cup per day of grains (rice and noodles); >= 7 times per week of legumes; < 1 time per week of sugar-sweetened beverages (cola, soda and other sweetened beverages); < 1 time per week of processed meat (beef, pork, goat, and burgers) and < 1 time per week of saturated fat (French fried and pizza). We calculated the frequency of intake and summed across all food items. Participants with an alternative ideal health diet of Life's Simple 7 scoring 0~2, 3~4 and 5~7 points had poor health, intermediate health and ideal health, respectively. The weekly time of physical activity were derived from interview. We calculated the frequency of bouts of exercise by multiplying the times
of each bouts by the frequency in previous two weeks and summed across all exercise. The achievement of physical active goal were categorized according to Life's Simple 7 (poor health: 0 min/week; Intermediate health: 0~149 min/week moderate intensity or 0~74 min/week vigorous intensity; ideal health: >=150
moderate intensity or >=75 vigorous intensity or combination). Participants who had still currently smoking were defined as poor health. Former smokers but had quit within previous 12 months as intermediate level and those who had never smoked or quit more than 12 months were defined as optimal level.
We categorized poor health, intermediate health and ideal health in 3 cardiovascular health metric including total cholesterol(poor health: <200 mg/dL; intermediate health: 200-240 mg/dL ; ideal health: >240 mg/dL), blood pressure (poor health:
systolic blood pressure(sbp) ≥140mm Hg or diastolic blood pressure (dbp)≥ 90 mm Hg ; intermediate health: sbp: 120-139mm Hg or dbp: 80-89 mm Hg ; ideal health:
sbp<120mm Hg and dbp<80 mm Hg ), fasting plasma glucose (poor health: <100 mg/dL; intermediate health: 100-126 mg/dL; ideal health: >126 mg/dL).
Life's Simple 7 score were summed of each health heart behavior and factors, giving 2 points for an ideal metric, 1 point for an intermediate metric and 0 points for a poor
metric. Overall Life's Simple 7 score ranged 0 and 14 was devided into 4 categories as follows: 0-6, 7-9, 10-12, 13-14.
2.7 Measurements of blood pressure, weight and height measurement
According to American Heart Association recommendation, the measurement of blood pressure was obtained twice by certified interviewers. After the participants seated at rest for 5-10 min without walking, running or lifting heavy objects, the blood pressure was measured twice with arm raised to the same height as the heart using of a calibrated mercury sphygmomanometer and cuffs of the appropriate size. If the difference between twice was more than 10 mmHg, a third time of blood pressure measurement was taken and the average of blood pressure between two closet measurement were used in our study. Body mass index was calculated from weight and height measures obtained at clinical examination using a calibrate stadiometer.
2.8 Measurement of biochemistry markers
We performed the biochemical measurements once in the baseline 2002. The procedures involved in blood sample collection were previously reported. (citation.
Uric acid concentration as a risk marker for blood pressure progression and incident hypertension: A Chinese cohort study) Briefly, after a 9-12 hour overnight fast, all
venous blood samples were drawn into an EDTA anticoagulant tube, immediately refrigerated, and transported within 4 hours to central laboratory with an automatic multichannel chemical analyzer (TBA-200FR, Toshiba Corporation, Tokyo, Japan).
Serum samples were stored at -20℃before conducting batch assays to determine the levels of total cholesterol, triglycerides, and high density lipoprotein cholesterol (HDL-C) with blinded quality control specimens. Serum cholesterol and triglycerides were analyzed by the standard enzymatic methods. Both high-density lipoprotein cholesterol (HDL-C) and low-density lipoprotein cholesterol (LDL-C) were performed by electrophoresis. Hexokinase glucose-6 phosphate dehydrogenase procedure was used for the measurement of plasma glucose and high-performance liquid chromatographic (HPLC) method was for the determination of HbA1c. Non- high-density lipoprotein cholesterol level was derived from the simplified equation as (total cholesterol in mg/dL) - (high-density lipoprotein cholesterol in mg/dL). The inter- and intra-assay coefficients of variation of these measurements were
approximately 5%.
2.9 Important covariates
At baseline, participants reported on socio-demographic factors and medical history including educational level, monthly income, marital status, menopause status, history
of estrogen exposure and parental history of cardiovascular disease (table 12).
Educational level was classified as compulsory school education (<=9 years) and 12- year school, university or college (> 9 years). The systolic blood pressure and diastolic blood pressure were obtained twice after 5 min of rest and the mean of the two measurements at clinical examinations. The value of fasting glucose, hemoglobin A1c, triglyceride, total cholesterol and non-high-density lipoprotein were measured by blood samples drawing in the morning after overnight fasting and serum level were analyzed using enzymatic methods.
Diabetes at baseline was defined as a fasting serum glucose >= 126 mg/dL and hemoglobin A1c >= 6.5 mg/dL or records with twice diagnosis of diabetes by ICD-9 or prescription of anti-diabetes drugs more than 12 weeks from NHIRD prior to enrolled date. Hypertension was defined as systolic blood pressure >= 140 mmHg or diastolic >= 90 mmHg or records with twice diagnosis of hypertension or prescription of anti-hypertensive drugs more than 12 weeks from NHIRD prior to enrolled date.
Data on the use of lipid-lowering agent and aspirin were obtained from drug register and defined as yes while prescriptions were more than 12 weeks prior to the enrolled date. Abdominal obesity was indicated as waist circumflex ≧ 80 cm in women and
>= 90 cm in men.
2.10 Outcome ascertainment and prospective follow-up
Follow-up information was from the national health insurance research database and the Taiwan Cause of Death Register for fatal outcomes by record linkage using the personal identification numbers assigned to every citizen on Taiwan. The
International Classification of Disease 9(ICD-9) codes were used to identify coronary artery disease or ischemic stroke in the above-mentioned. (Table 13) Coronary artery disease was defined as ICD-9 codes 410-411, 414 and V45.81-82. Ischemic stroke was defined as ICD-9 codes 434-436, 4371, 4379. We ascertained incident cast of coronary artery disease and ischemic stroke using National Health Insurance Research Database with the first hospitalization with the diagnosis of above interest events and the event date defined as the first date of hospitalization. We ascertained the coronary artery disease and stroke related death using death certificate registration. All
participants were flagged for death at the department of Household Registration, and coded death certificates using the international classification of disease (ICD), revision 9. The diagnoses of coronary artery disease and ischemic stroke were made by the treating physicians, based on a clinical assessment and examinations as considered relevant by the clinician in charge of treatment.
2.11 Statistical Analyses
Person-years at risk were calculated from the baseline date to the diagnosis of a CVD
event, date of death, loss to follow-up, or end of follow-up (December 31, 2015), whichever occurred first.
Participants were categorized into 4 group among each healthy lifestyle scores, based on the numbers of adherence to Mediterranean diet related healthy lifestyle score, Taiwan healthy lifestyle score, WCRF/AICR healthy lifestyle score and Life's Simple 7 score. The continuous variables are presented by mean, standard deviation, or median levels; categorical data are presented in contingency table with ANOVA to test for differences among quintiles. Relationships between individually healthy lifestyle factor and 4 combined healthy lifestyle scores were examined by the age- and gender-adjusted Spearman's partial correlation coefficients.
We used Cox proportional hazards models to determine the hazard ratio (HR) and 95% confidence interval (CI) of the association between health lifestyle factors, either individually or as their combined health lifestyle score, and the risk of coronary artery disease and ischemic stroke during the follow-up. Multivariate Cox regression models were constructed for combined health lifestyle scores with the lowest score category as the reference category with age as the underlying time scale, and stratified jointly by age at baseline in 20 -year intervals and sex.
We made multivariate adjustments to examine how far the effect of combined health lifestyle score might be explained by known cardiovascular factors. We adjusted for age and sex in model A; age, sex, educational level, monthly income, marital status, menopause, estrogen exposure, and parental history of cardiovascular disease in model B; And as for model B with the addition of history of hypertension, diabetes, the, lower lipid agent use and aspirin used, fasting glucose, hemoglobin A1c, systolic blood pressure, diastolic blood pressure, triglyceride and non- high density
lipoprotein-cholesterol in model C.
The linear trend test for individual factors was performed by the specific median to each category and then modeling this as a continuous variable in a separate model; for combined lifestyle factors, the test was performed by treating the number of low-risk factors as a continuous variable. Proportional hazard assumption was note rejected in these Cox models by plotting the log(-log(survival time)) versus log of survival time and including time dependent covariates.
The population attributable risk (PAR), proportion of CVD hypothetically prevented if whole population with the highest number of healthy lifestyle factors, was
estimated using hazard ratio (HRs) obtained from the different Cox regression models in our cohort. The Wacholder et al. method was performed to generate 95%
confidence intervals (CI) for robust estimation according to sex, age, education years, marriage status, income level, parental histories of heart attack or stroke, menopause status, hormone replacement therapy, baseline hypertension, diabetes and
hyperlipidemia, blood pressure, fasting glucose, hemoglobin A1c, triglyceride and non-HDL-C. We tested potential effect modifiers of sex and age category (20-39.9, 40-39.9, >=60) by using the likelihood ratio test comparing models with and without a cross-product term.
To further investigate the role of combined healthy lifestyle factors to predict the cardiovascular risk, we compared the 4 model with healthy lifestyle score (simple and weight Taiwan healthy lifestyle score, WCRF/AICR lifestyle score and Life’s simple 7) and tested the prediction performance using calibration and discrimination ability.
First, we assessed the goodness of fit of all four healthy lifestyle score by the Hosmer- Lemeshow's statistic72 The test is aimed to exam the calibration between the predicted risks and the actual observed risk73. Second, we compared Harrell's C-index of
survival data, the area under receiver operative characteristic curve, among 4 healthy lifestyle score to assess model discrimination. A receiver operating characteristic
curve (ROC curve) is plotted by two parameters, true positive rate (sensitivity) versus false positive rate (1-specificity) to performance of a classification model at all classification thresholds. AUC measures the entire two dimensional area underneath the entire ROC curve from (0,0) and larger values indicate better discrimination.74-75. The method of Delong et al were used to compared the statistically difference in the AUCs, which is the global standardized measurement of the discrimination between prediction of positive and negative outcome.76 In addition, calibration curve was plotted with the average predicted risk against the observed risk in decile, to conduct the 4 healthy lifestyle score calibration.
All statistical test was 2-tailed with a type I error. Statistically significant was considered as two sided and P values < 0.05. SAS version 9.4 (SAS Institute, Cary, NC, USA) and Stata version 12(Stata Corporation, College Station, Texas USA )
Chapter Three:Result
3.1 Demographic and lifestyle characteristics among participants at baseline
The final analytic sample included During a mean follow-up of 12.5 years, 520 (8.6%) new cases of cardiovascular events and 20 confirmed CVD-deaths (3.8%) occurred in the study. Baseline characteristic of final analytic participants included 3012 men (49.8%) and 3036 women (50.2%), with a mean (SD) age of the population at baseline was 44.9 +/-SD 16 years, whereas the mean age at diagnosis of CVD was 63.0+/-SD 12.8 years. General baseline characteristics according to the number of healthy lifestyles in simple Taiwan healthy lifestyle score, weighted Taiwan healthy lifestyle score, WCRF/AICR lifestyle score and Life's Simple 7 score are presented in Table 14. Compared with participants adhering to no healthy lifestyle factors in simple Taiwan healthy lifestyle score, weighted Taiwan healthy lifestyle score and Life’s Simple 7, those adhering to highest factors tended to be women predominant and younger, with higher education level, high monthly income, low prevalence of living with spouse, parental history of CVD, menopause status, hypertension, diabetes and hyperlipidemia at baseline and hormone replacement therapy exposure. However, in contrast, compared with participants adhering to no healthy lifestyle factors in WCRF/AICR healthy lifestyle score, those adhering to highest factors tended to be
older, with lower education level, low monthly income, high prevalence of living with spouse, parental history of CVD, menopause status, hypertension, diabetes and
hyperlipidemia at baseline and hormone replacement therapy exposure.
3.2 Lifetime risk of cardiovascular disease
Overall, the lifetime risk of cardiovascular event was 0.56/ 1000 person-year at age 20~39 years old and remained constant 5.6 per 1000 person-year through age between 40~59 years old; At age more than 60 years, the lifetime risk for cardiovascular disease was 28.78 per 1000 person-year.
Lifestyle Factors and Lifetime risk of CVD
An independent inverse and graded association (table 15) among each lifestyle factor and the risk of CVD were observed after multivariable adjustment, with the strongest associations observed for BMI (risk ratio @@; 95% CI:@@ ), Mediterranean diet (risk ratio 0.35; 95% CI: 0.20,0.61) and alcohol consumption (risk ratio 0.5; 95% CI:
0.29,0.87) and p for linear trend 0.012, 0.006 and 0.001, respectively.
The linear relationship was noted among BMI, Mediterranean diet, alcohol and CVD and ideal weight, high score of Mediterranean diet and frequency drinking with the lowest risk. The association between the intensity of physical activity and CVD was a
J shaped. Adequate physical activity was associated with a reduced risk of CVD with the lowest risk being among 1~49 mins per week (risk ratio 0.6; 95% CI: 0.33, 1.09).
However, physical activity with more than 150 mins per week showed increasing risk of CVD (risk ration 1.08; 95% CI: 0.84,1.38). The percentage of partial population attributable fraction (95% CI) was highest for adequate alcohol consumption (41.1%, 95% CI: 18.1, 57.6), followed by ideal weight (25.7%, 95% CI: 5.6 to 41.6),
Mediterranean healthy diet( 23.7%, 95% CI: 6.7 to 37.6) and non-smoking status (2.4%, 95% CI: -4.7 to 8.9).
3.3 Healthy lifestyle scores and lifetime risk of CVD
When the healthy lifestyle factors were collapsed into binary categories of optimal versus not optimal, each lifestyle factor remained significantly associated with lower risk for incidental cardiovascular disease in multivariable-adjusted models including all lifestyle factors simultaneously.
Figure 1 showed the Kaplan-Meir survival curves for the probability of survival free from the risk of cardiovascular specified in the study participants among participants stratified by the numbers of healthy lifestyle factors. The highest numbers of healthy lifestyle scores had a higher survival free rate from the CVD risk in the simple and weight Taiwan healthy lifestyle scores and Life's Simple 7 with the log-rank test,
P<0.001, <0.001 and < 0.001, inversely. (table 16)
In multivariable-adjusted analyses (table 16), healthy lifestyle scores were independently associated with reducing CVD risk, especially in simple Taiwan healthy lifestyle score, weighted Taiwan healthy lifestyle score and Life’s Simple 7 (table 17) (Figure 2).
Among participants in the optimal category for all healthy lifestyle factors of ideal weight, healthy diet, achievement of physical active goal, never smoking, adequate drinking and ideal total cholesterol, blood pressure and fasting glucose, comprising approximately 7.6%, 15.2% and 17.7% of the study population in the simple and weight Taiwan healthy lifestyle score and Life’s Simple 7, respectively, the HR for cardiovascular events was 0.43 (95%CI: 0.2 to 0.94), 0.44 (95%CI: 0.28 to 0.68) and 0.6 (95%CI: 0.29 to 1.24) compared to the corresponding undesirable lifestyle, comprising approximately 22.0%, 42.6% and 2.8% of the study population (table 16).
There was an inverse and graded association between the number of healthy lifestyle scores and the lifetime risk of CVD with p for linear trend <0.001, <0.001 and 0.02 in simple Taiwan healthy lifestyle score, weighted Taiwan healthy lifestyle score and Life’s Simple 7, respectively. However, no inverse and graded association was noted
between WCRF/AICR lifestyle score and CVD. Furthermore, participants with increasing numbers of WCRF/AICR healthy lifestyle score had higher risk of CVD, insignificantly.
3.4 Healthy lifestyle scores and CVD risk in adult < 60 years old and ≧ 60 years old When we stratified by age, the association between the number of different healthy lifestyle scores and CVD risk among adults <60 years old and adults ≧60 years old were demonstrated in table 17 and figure 4. Overall, we found that persistent
significantly inverse association between healthy lifestyle scores and the CVD risk for a given number of lifestyle factors in all 4 healthy lifestyle scores, but among
participants aging younger than 60 years with more reduction of CVD risk. In addition, age played a significant effect modifier for the association among healthy lifestyle scores and the risk of CVD, indicating the protective effect of healthy lifestyle scores on CVD incidence indeed varied by the age of adult.
3.5 Comparing different healthy lifestyle scores
Hosmer-Lemeshow test statistic indicated an acceptable goodness-of-fit of the
calibration ability (table 18). Furthermore, the model was well calibrated for 12.5-year CVD risk prediction based on the calibration in four healthy lifestyle scores (figure 5).
With regards to discriminative ability of different healthy lifestyle scores to predict the CVD risk, the Harrell’s C-statistics were significantly different between the classical risk factor models with and without healthy lifestyle scores (figure 7).
Specifically, when the simple and weight Taiwan healthy lifestyle score were added to the classical model, the Harrell’s C-statistic increasing from 0.85 to 0.86 (95%
confidence interval [CI], 0.84, 087; Pdiff=0.048) in both lifestyle scores. Moreover, we found that the performance measures by integrated discriminative improvement (IDI) showed significant improvement with 0.38% (95% CI 0.01, 0.74; p=0.021) contained simple Taiwan healthy lifestyle score and .51% (95% CI 0.16, 0.86; p=0.002)
contained Taiwan healthy lifestyle score. The net reclassification improvement was statistically significant for the information of simple and weight healthy lifestyle score (0.03; 95% CI 0.01, 0.05; p= 0.004) in and of Taiwan healthy lifestyle score. (0.04;
95% CI 0.02, 0.06; p= <0.001).
3.6 Sensitivity analysis
As a sensitivity analysis, we replaced the body mass index with waist circumflex, the HR for cardiovascular events was 0.45 (95%CI: 0.21 to 0.98) among participants in the optimal category for all 5 lifestyle factors of simple Taiwan healthy lifestyle score , comprising approximately 1% of the study population, compared with 27.4%
of population with those adhering to none or 1 healthy lifestyles factors (table 19).
The replacement of body mass index with waist circumflex among weighted Taiwan healthy lifestyle score, HR for cardiovascular events was 0.4 (95%CI: 0.25 to 0.65) among participants in participants adhering to 5 desirable lifestyle factors, comprising approximately 14.9% of the study population, compared with 26.7% of population with adhering to none or 1 healthy lifestyles factors.
Chapter Four:Discussion
4.1 Main finding
In this represetative adult Taiwan population, 38.8% of all CVD events may have been avoided had all participant adhered to a health lifestyle of normal weight, healthy Meditereanean diet, physical activity regularly, non-smoking and adequate healthy drinking. We also noted the inverse relationship between combined healthy lifestyle score and CVD, such as simple Taiwan healthy lifestyle score, weighted Taiwan healthy lifestyle score and Life's simple 7. Furthermore, we noted age and hypertension at baseline had an modifer effect of the inverse association between combined lifestyle score and CVD. Younger and hypertension-free participants adopted optimal lifestyle had more benefit than elder population.
4.2 Comparing with previous studies
Our finding were consistent with preiouvs cohort studies in European, USA and Asia and suggested an protective effect between healthy lifestyle score and the risk of CVD in extensive Chinese population. Evidence have shown combined Mediterranean diet in healthy lifestyle score in Western with an inverse association with the CVD
incidence37, 42, adjusted HR ranging 0.22-0.43 and CVD death77, adjusted HR ranging 0.54-0.62. In a follow-up 7.2 years cohort study in China45, combined healthy lifestyle
factors had decreasing the risk of CVD but diet pattern in the study defined from the habitual intake of 12 conventional food was insignificant protective effect. Our study had validate the Mediterran diet pattern had benefit in reduction of CVD events.
Previous cohort studies of lifestyle score and incident CVD are limited in the adjuted covariates. Most controlled covariates in those analyses hazard including age, sex, soci-economical status, parenal history of CVD, hypertension, diabetes,
hyperlipidemia status at baseline and medication exposure, such as aspirin, hormone, anti-hypertensive, anti-diabetic or lipid-lowering agent. Several cohort studies had estimated the hazard ratio with part of additional adjuted clinical factors, like systolic blood pressure, serum level of glucose, hemoglobine A and total cholesterol33, 36, 39-42,
46-47. In our study, we estimated the hazard ratio after adjusted for age, sex, social- economical and healthy status at baseline and clinical factors such as blood pressure, serum level of glucose, triglyceride and non-HDL. All of those including clinical factor as adjustment covariates studies implies that combined lifestyles had additional benefit for the decreasing incidence of CVD other than the mechanism of blood pressure, glucose and lipid-controlling.
Comparison of weighted lifestyle score and simple lifestyle score to exam the