國立臺灣大學電機資訊學院光電工程學研究所
碩士論文
Graduate Institute of Photonics and Optoelectronics College of Electrical Engineering and Computer Science
National Taiwan University Master Thesis
光學透明化運用在人體離體與活體皮膚之倍頻影像術上的效 用與機制
Investigate the Optical Clearing Effects and Mechanisms of Ex Vivo and In Vivo Human Skin with Glycerol Application by
Harmonic Generation Microscopy
賴嘉泓 Jia-Hong Lai
指導教授:孫啟光 博士 Advisor: Chi-Kuang Sun, Ph.D.
中華民國 109 年 1 月
January 2020
誌謝
沒想到一步一步這樣走著,也總算到了盡頭,這是一段漫長的日子,途中遇到的困 難與挑戰沒有少過,也不斷地懷疑自己,整個碩士生涯都心裡都覺得心理壓力很大,有 種看不見盡頭的感覺,一路走來,最想感謝的是自己,感謝自己的努力,感謝自己的堅 持,感謝我自始自終沒有放棄。
謝謝孫啟光老師一路的悉心指導,給我機會與方向,讓我能夠成長,也提出了很多 很好的看法,跳脫框架的思考,讓我看見不一樣的思維,一生受用。最後與老師密集討 論論文與文章的日子,也讓我非常過癮,我們彼此討論著文章的邏輯架構,提出各自的 想法,整合出最好的說法,一起期待文章的發表能有最好的結果,也謝謝廖怡華醫師一 路上幫助我完成臨床試驗。
這漫長的日子中,做了好多的事情,從碩一開始學習如何建實驗室,碩二開始架系 統、處理雷射,學習如何當個”工程師”,到之後碩三、碩四改成研究皮膚透明化、寫 文章,學習如何當個”科學家”。在這裡的每一刻,都受到好多人的陪伴與幫助。碩一 指導我研究方法與態度的鄭天佑博士,嚴謹以及有耐心地指導我,讓我在之後的碩士生 涯能夠獨當一面。感謝實驗室助理 Rebecca,當我初期管理實驗室的時候常犯錯,受到 蕾姊很多行政上的幫忙以及心理上的支持。感謝 Anatoly 與政翰學長教我對光、架雷 射,也從他們的身上學到很多聰明且實用的小方法。謝謝 Bhaskar 在我們當初沒日沒夜 建系統的時候一起努力,看到現在系統能成功運作,我非常感動。感謝李志昌博士指導 我關於動物實驗的相關知識。感謝學長弈廷、從豈對我課業上的指導,還要特別感謝浩 正在我最後做研究的時候,幫助我實驗、陪著我討論,也給了我很多的建議與支持,從 浩正的身上,我學到很多。謝謝 Alicia 百忙之中抽空,協助我修改論文,在我寫論文 的初期給了莫大的幫助。謝謝學長銘良,幫忙我處理臨床試驗的申請。謝謝我的同學,
廷翰以及潘益,我們一起辛苦過來。謝謝最後一段時間陪我吃飯,一起承受很大壓力的 好學弟承霖。謝謝實驗室夥伴,沈博、Sandeep、薈元、鵬瑞、沛哲、敏慈、政浩、勝 澤,在這段時間的各種協助。
謝謝百仁男子天團: 柏淵、子揚、淶鈞、欣融、文杰、王鈞、翊誠、尹政、挺軒,
有你們陪伴、鼓勵與打屁,讓這段時間能有一個情緒的出口。謝謝陪我打球的螢火蟲戰 隊,長泰、正中。謝謝幫助我做人體實驗的所有好朋友們。然後要感謝我的女朋友彩 瑄,在我這段努力畢業的日子裡面,不離不棄的陪伴我,知道這些日子對你來說也很艱 難,也讓你委屈。你值得過更好的日子,我會更加努力。
最後要感謝我的父母支持,同年紀的孩子已經很多出外賺錢孝順父母了,我卻還不 能讓你們享清福,也謝謝你們對我的決定,沒有過多的質疑以及否定,這段在外讀書的 日子,陪伴你們的日子真的很少,我也會努力達成你們的期待,做個成功而且孝順的孩 子,愛你們。
僅將此論文獻給所有給過我幫助的人們,謝謝!
中文摘要
光學清潔法可用來提升光學顯微鏡的成像品質與深度。然而,由於缺乏影像的 細節資訊,其運用在人體皮膚上的效果與機制仍未被完全了解。此研究中,我們使 用倍頻顯微鏡,藉由結合三倍頻與二倍頻的高解析度影像,研究光學清潔法使用在 離體與活體皮膚上的效用與機制。實行光學清潔法後,樣品內部的折射率均勻度提 升,造成三倍頻影像強度在上表皮衰減,而二倍頻影像在下表皮的強度變化作為一 個可靠的指標,顯示光學散射在上表皮的減少。結合這兩個影像技術,可以獲得更 多關於光學清潔法的細節。
在離體皮膚的研究裡,我們將九位受試者分配到四種不同的實驗條件,分別將 皮膚樣品浸泡或是表面塗抹上 100% 或是 50% 的甘油,研究在不同狀況下的光學 清潔效果。在 50% 塗抹的實驗條件下,發現角質層扮演一個重要的關鍵,其光學 清潔效果在厚角質層的皮膚樣品更為明顯。
過去光學清潔法在活體皮膚的研究中,使用在手臂內側與手掌的結果有很大 的差異,在薄角質層的部位,效果非常薄弱。這些過去的活體皮膚研究也與我們的 離體皮膚研究也發現一樣的結果。然而,許多的光學療法以及光學診斷都是運用在 薄角質層的地方,光學清潔法使用在此類薄角質皮膚上的效果及機制仍需要被研 究與了解。在此研究的活體皮膚部分,我們將 50% 甘油塗抹在手前臂內側,我
們將八位受試者分配到四種不同的作用時間(15, 30, 90, 180 分鐘),發現光
學清潔法的效果在 90 分鐘以內的效用不明顯,而在 180 分鐘作用後,在三個受試 者中有兩位有明顯的效果,在此類薄角質層皮膚的部位,越長的作用時間,有越高 的機率達成光學清潔的效用。
關鍵字:光學清潔法、活體皮膚、離體皮膚、甘油、三倍頻、二倍頻
ABSTRACT
Imaging depth and quality of the optical microscopy can be enhanced by using the method of the optical clearing. However, the optical clearing effects and mechanisms in human skin remain largely unclear due to the lack of detailed image information. Here we investigate the optical clearing of the ex vivo and in vivo human skin by glycerol application. Harmonic generation microscopy, by combining second and third harmonic generation (THG) modalities, was utilized to retrieve high-resolution skin images. The THG image intensity in the epidermis is decreased due to the optical homogeneity after optical clearing, and the second harmonic generation (SHG) image intensity in the dermis is a beacon to confirm the reduction of the scattering in the epidermis layer. Combining these two image information, the details of the optical clearing effects can be well studied.
For ex vivo experiment, nine different volunteers were separated into four different case types to study and unravel the optical clearing mechanisms. The 100% or 50% glycerol is applied on the skin by immersion or topical application. For the case type of 50%
glycerol combined with the topical application, the method which can be used for the further in vivo or clinical research, SC acts the most important role. We observed stronger OC effect in thicker SC skin tissues.
For the previous in vivo human optical clearing studies, the effect between the volar
effective in the skin area with thinner SC. The same result was also noted in our ex vivo experiment. However, it is essential to study the optical clearing on the skin with thinner SC, the area where the light therapeutic and dermatological diagnosis often focus on. In this study, we investigated the OC effect on the in vivo volar forearm by using 50%
glycerol with topical application. For in vivo experiment, eight different volunteers were separated into four different applying time (15, 30, 90, and 180 minutes) to unravel the optical clearing mechanisms. The results showed that the optical clearing was less effective within 90 minutes application. After 180 minutes application, two of three cases were found the effect of the optical clearing. In the skin area with thinner SC, there was a higher probability to witness the optical clearing effects after a longer applying time.
Keywords: optical clearing, in vivo human skin, ex vivo human skin, glycerol, third- harmonic generation, second-harmonic generation.
CONTENT
誌謝
中文摘要 i
ABSTRACT ii
CONTENT iv
LIST OF FIGURES vii
LIST OF TABLES xvi
Chapter 1 Introduction 1
1.1 Motivation 1
1.2 Thesis Scope 4
Chapter 2 Background Knowledge 6
2.1 The Skin 6
2.1.1 Skin Structure and Barrier Function of the Stratum Corneum 6
2.1.2 Glycerol and the Human Skin 8
2.2 Optical Clearing 9
2.2.1 Optical Clearing of the Ex Vivo Skin Experiments 10 2.2.2 Optical Clearing of the In Vivo Skin Experiments 16 Optical Clearing of In Vivo Rat Skin Experiments 17 Optical Clearing of In Vivo Human Skin Experiments 20
2.3 Basic Theory of Harmonic Generation 24
2.3.1 Second Harmonic Generation 24
2.3.2 Third Harmonic Generation 26
Chapter 3 Method and Materials of the In vivo and the Ex Vivo Optical Clearing
Experiments 29
3.1 Experimental Protocol of the Ex Vivo Optical Clearing 29
3.1.1 Skin Sample Preparation 32
3.1.2 Glycerol Solution Preparation 34
3.1.3 Skin Slide Preparation 34
3.1.4 Glycerol Solution Application with the Skin Tissue 35 3.2 System Set Up and Virtual Biopsy of the Ex Vivo Optical Clearing 36
3.2.1 Bright-field Imaging 36
3.2.2 Harmonic Generation Microscopy 37
3.2.3 THG and SHG imaging of the Ex Vivo Human Skin 39 3.3 Experimental Protocol of the In Vivo Human Skin Image Clearance 42 3.3.1 Scanning Region Selection and Preparation 43
3.3.2 Noninvasiveness and Photodamage Concern 45
3.3.3 THG and SHG imaging of In Vivo Human Skin 46
3.4 Analysis Methods of HGM Skin Image 47
3.4.1 Image Processing of HGM Image 47
3.4.2 Blinding 48
3.4.3 Thickness Analysis 50
3.4.4 Intensity Analysis 52
Chapter 4 Results of the Ex Vivo Optical Clearing 54
4.1 System Calibration by Using Gallium Nitrite 54
4.2 Bright-filed Image 56
4.3 Statistical Analysis of HGM Image and Representative HGM Images 58 4.3.1 Tissue Immersed by 100% Glycerol for 90 Minutes (E100-I90) 59 4.3.2 Tissue Immersed by 50% Glycerol for 90 Minutes (E50-I90) 65 4.3.3 Topically Applied by 50% Glycerol for 90 Minutes (E50-T90) 71 4.4 Summary of the Ex Vivo Optical Clearing Results 82
Chapter 5 Discussion of the Ex Vivo Optical Clearing 84 5.1 Optical Clearing Effects and Mechanisms by Utilizing 100% Glycerol with
the Tissue Immersion Technique 84
5.1.1 Bight-field Imaging 84
5.1.2 HGM Imaging 84
5.1.3 Skin Structure Analysis 86
5.2 100% Glycerol Immersion V.S. 50% Glycerol Immersion 86
5.3 50% Glycerol with Topical Application 88
5.4 The Relationship between the SC and the HGM Intensity Variation 90
5.5 Conclusion of the Ex Vivo Optical Clearing 94
Chapter 6 Results of the In Vivo Optical Clearing 96
6.1 System Calibration by Using Gallium Nitrite 99
6.2 Statistical Analysis of HGM Image and Representative HGM Images 101 6.2.1 Structure and HGM Intensity Analysis of Case I50-T15 101 6.2.2 Structure and HGM Intensity Analysis of Case I50-T30 104 6.2.3 Structure and HGM Intensity Analysis of Case I50-T90 110 6.2.4 Structure and HGM Intensity Analysis of Case I50-T180 115 6.3 Summary of the In Vivo Optical Clearing Results 123 Chapter 7 Discussion of the Ex Vivo Optical Clearing 125
7.1 Case I50-T180-1 125
7.2 Case I50-T180-3 127
7.3 Case I50-T30-1 127
7.4 Conclusion 128
Chapter 8 Summary 131
References 134
LIST OF FIGURES
Fig. 2.1 The skin structure from the stratum corneum to the dermis. ... 8
Fig. 2.2 Simple physical picture of the SHG theory. ... 25
Fig. 2.3 Simple physical picture of the THG theory... 27
Fig. 3.1 Flow chart of whole ex vivo experiment. ... 32
Fig. 3.2 Human skin sample preparation (a) The original skin sample with fat tissue. (Red circle) (b) Remove the fat tissue under the dermal. (c) The skin sample was separate into two parts. The size of each part will be larger than 0.5*0.5 𝑚𝑚2 ... 34
Fig. 3.3 (a) iSpacer fix on the slide to form a space and watertight well. (b) & (c) Use clay to fix cover slip and slide together. (d) One of the finished slides with skin sample and water inside. ... 35
Fig. 3.4 (a) Skin sample was immersed into the glycerol solution. (b) We used a brush to make the skin surface covered by glycerol solution. ... 36
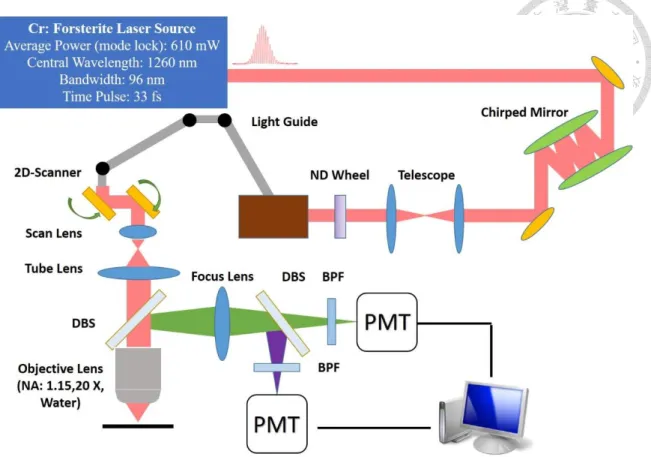
Fig. 3.5 Optical system setup. DBS: dichroic beam splitter; BPF: band-pass filter; PMT: photomultiplier tube. ... 39
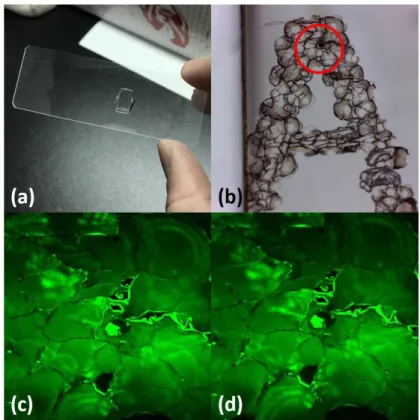
Fig. 3.6 (a) A gallium nitrite (GaN) sample with some scotch (A1Z003) on it. (b) Imaged by bright light microscopy. (LEICA ICC50 HD). We choose the top of first letter “A” to image by our HGM. (c) & (d) The HGM images of the GaN before taking the image of the control group and taking the image of the glycerol group. There’s no big difference between each other. Laser power (after the objective lens): 20 mW, Average frame: 10 frames/frame. PMT setting: 400 V for SHG channel. .... 40 Fig. 3.7 (a) The slide fixed on the 2D stage which could manually adjust the scan area to get the image of different position. (b) Red circle: An objective lens. When
we started to scan, it moved automatically to get a stack of images. ... 41 Fig. 3.8 Flow chart of whole in vivo experiment. ... 43 Fig. 3.9 (a) The waterproof tape (3M™ Tegaderm™) with the hole in the center to mark the position of the region of interest at the forearm. (b) Glycerol application for the in vivo experiment. We used second waterproof tape to seal the glycerol solution on the skin surface. ... 44 Fig. 3.10 (a) A volunteer was laying on the electric hospital bed. A red circle is the scanning head of our HGM system. (b) The details of the scanning head: Object lens (water immersion) was fixed on the system and covered by an adapter. This adapter not only separated the skin and objective lens to prevent from direct contact with each other by using coverslip but also kept water inside of it to create the water immersion condition for the in vivo experiment. ... 47 Fig. 3.11 (a) Grayscale image of the THG signal. (b) Grayscale image of SHG image at the same skin depth of THG image. (c) Image after combining SHG and THG. (d) Color remapping of SHG and THG signal. (Green: SHG, Red: THG) ... 48 Fig. 3.12 The HGM images of human skin obtained at different depth with different skin structures. Here we defined the thickness of SC, the thickness of viable epidermis, the depth of the basal layer, the depth of the middle papillary dermis, and the depth of the top reticular dermis. Scale bar: 100 μm ... 52 Fig. 4.1 SHG images of GaN for system calibration. Left: The reference SHG image before taking the HGM skin image of the control group. Right: The SHG image before taking the HGM skin image of the glycerol group. (PMT setting: 400 Volt, Contrast: 400~4500, Illuminate power: 20 mW). It was only a little difference and indicates that the system condition remained the same. (a) Case E100-I90-1 (b) Case E100-I90-2 ... 54
Fig. 4.2 SHG images of GaN for system calibration. Left: The SHG image before taking the HGM skin image of the control group. Right: The reference SHG image before taking the HGM skin image of the glycerol group. (PMT setting: 400 Volt, Contrast: 400~4500, Illuminate power: 20 mW). It was only a little difference and indicates that the system condition remained the same. (a) Case E50-I90-1 (b) Case E50-I90-2 ... 54 Fig. 4.3 SHG images of GaN for system calibration. Left: The reference SHG image before taking the HGM skin image of the control group. Right: The SHG image before taking the HGM skin image of the glycerol group. (PMT setting: 400 Volt, Contrast: 400~4500, Illuminate power: 20 mW). It was only a little difference and indicates that the system condition remained the same. (a) Case E50-T90-1 (b) Case E50-T90-2 (c) Case E50-T90-3 (d) Case E50-T90-4 ... 55 Fig. 4.4 Bright field images taken by Leica ICC50 HD. Left: normal skin. Right:
skin after immersed into 100% glycerol for 90 mins. The transmission light increased and the deeper hair became visible. Scale bar: 1 mm. (a) Case E100-I90-1 (b) Case E100-I90-2 ... 56 Fig. 4.5 Bright field images taken by Leica ICC50 HD. Left: normal skin. Right:
skin after immersed into 50% glycerol for 90 mins. The transmission light increased and the deeper hair became visible. (a) Case E50-I90-1 (b) Case E50-I90-2 ... 57 Fig. 4.6 Bright field images taken by Leica ICC50 HD. Left: normal skin. Right:
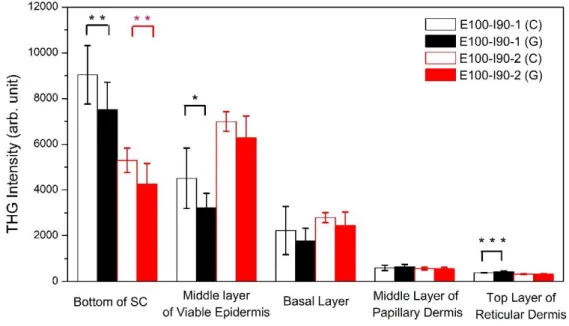
skin after topically applied with 50% glycerol for 90 mins. (a) Case E50-T90-1 (b) Case E50-T90-2 (c) Case E50-T90-3 (d) Case E50-T90-4 ... 58 Fig. 4.7 Quantitative analysis and comparison of skin THG intensities at five different depths. Black: Case E100-I90-1 (control: N=8, glycerol: N=8); Red: Case E100-I90-2 (control: N=9, glycerol: N=9). *P <0.05; **P <0.01; *** P <0.001. C:
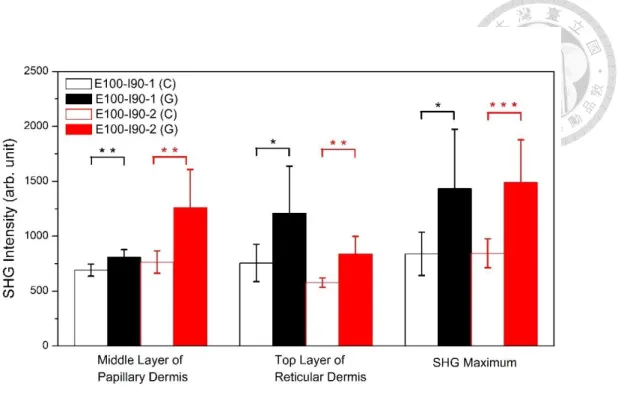
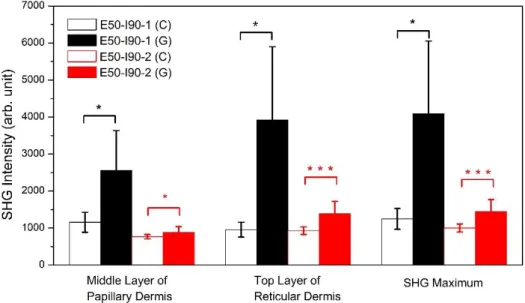
control; G: glycerol. ... 60 Fig. 4.8 Quantitative analysis and comparison of skin SHG intensities at three different depths. Black: Case E100-I90-1 (control: N=8, glycerol: N=8); Red: Case E100-I90-2 (control: N=9, glycerol: N=9). *P <0.05; ** P <0.01; *** P <0.001. C:
control; G: glycerol. ... 61 Fig. 4.9 En face skin image of Case E100-I90-1 (a) Glycerol-1 (b) Glycerol-2 (c) Control-1 (d) Control-2. Red: THG (Contrast setting: 600~10000). Green: SHG (Contrast setting: 600~4500). ... 63 Fig. 4.10 En face skin image of Case E100-I90-2 (a) Glycerol-1 (b) Glycerol-2 (c) Control-1 (d) Control-2. Red: THG (Contrast setting: 600~10000). Green: SHG (Contrast setting: 600~4500). ... 65 Fig. 4.11 Quantitative analysis and comparison of skin THG intensities at five different depths. Black: Case E50-I90-1 (control: N=6, glycerol: N=6); Red: Case E50-I90-2 (control: N=12, glycerol: N=12). *P <0.05; **P <0.01; *** P <0.001. C:
control. G: glycerol. ... 67 Fig. 4.12 Quantitative analysis and comparison of skin SHG intensities at three different depths. Black: Case E50-I90-1 (control: N=6, glycerol: N=6); Red: Case E50-I90-2 (control: N=12, glycerol: N=12). *P <0.05; **P <0.01; *** P <0.001. C:
Control. G: glycerol. ... 67 Fig. 4.13 En face skin image of Case E50-I90-1 (a) Glycerol-1 (b) Glycerol-2 (c) Control-1 (d) Control-2. Red: THG (Contrast setting: 600~10000). Green: SHG (Contrast setting: 600~8000). ... 69 Fig. 4.14 En face skin image of Case E50-I90-2 (a) Glycerol-1 (b) Glycerol-2 (c) Control-1 (d) Control-2. Red: THG (Contrast setting: 600~10000). Green: SHG (Contrast setting: 600~4500). ... 71
Fig. 4.15 Quantitative analysis and comparison of skin THG intensities at five different depths. Black: Case E50-T90-1 (control: N=8, glycerol: N=8); Red: Case E50-T90-2 (control: N=10, glycerol: N=10). Blue: Case E50-T90-3 (control: N=9, glycerol: N=9). Magenta: Case E50-T90-4 (control: N=7, glycerol: N=7). *P <0.05;
**P <0.01; *** P <0.001. C: control; G: glycerol ... 74 Fig. 4.16 Quantitative analysis and comparison of skin SHG intensities at three different depths. Black: Case E50-T90-1 (control: N=8, glycerol: N=8); Red: Case E50-T90-2 (control: N=10, glycerol: N=10). Blue: Case E50-T90-3 (control: N=9, glycerol: N=9). Magenta: Case E50-T90-4 (control: N=7, glycerol: N=7). *P <0.05;
**P <0.01; *** P <0.001. C: control; G: glycerol. ... 74 Fig. 4.17 En face skin image of Case E50-T90-1 (a) Glycerol-1 (b) Glycerol-2 (c) Control-1 (d) Control-2. Red: THG (Contrast setting: 600~6000). Green: SHG (Contrast setting: 600~8000). ... 76 Fig. 4.18 En face skin image of Case E50-T90-2 (a) Glycerol-1 (b) Glycerol-2 (c) Control-1 (d) Control-2. Red: THG (Contrast setting: 600~10000). Green: SHG (Contrast setting: 600~4500). ... 78 Fig. 4.19 En face skin image of Case E50-T90-3 (a) Glycerol-1 (b) Glycerol-2 (c) Control-1 (d) Control-2. Red: THG (Contrast setting: 600~10000). Green: SHG (Contrast setting: 600~6000). ... 80 Fig. 4.20 En face skin image of Case E50-T90-4 (a) Glycerol-1 (b) Glycerol-2 (c) Control-1 (d) Control-2. Red: THG (Contrast setting: 600~8000). Green: SHG (Contrast setting: 600~6000). ... 82 Fig. 5.1 The variation of the THG intensity at the middle epidermis layer. We presented and compared the THG intensity variation at the middle epidermis layer of Case E100-I90-1 and Case E50-I90-2. C: control; G: glycerol. (a) In the Case of
100% glycerol immersion (Case E100-I90-1), the THG intensity greatly reduced. (b) However, in the case of 50% glycerol immersion (Case E50-I90-2), the THG intensity greatly increased, opposite from (a). Scale bar = 100 μm. ... 88 Fig. 5.2 En face skin image of Case E100-T30-1 (a) Glycerol-1 (b) Glycerol-2 (c) Control-1 (d) Control-2. Red: THG (Contrast setting: 600~10000). Green: SHG (Contrast setting: 600~8000). ... 92 Fig. 6.1 SHG images of GaN for system calibration of Case I50-T15-1. Left: The reference SHG image before taking the HGM skin image of the control group. Right:
The SHG image before taking the HGM skin image of the glycerol group. (PMT setting: 400 Volt, Contrast: 400~4500, Illuminate power: 20 mW). It is only a little difference and indicates that the system condition remained the same. ... 99 Fig. 6.2 SHG images of GaN for system calibration. Left: The reference SHG image before taking the HGM skin image of the control group. Right: The SHG image before taking the HGM skin image of the glycerol group. (PMT setting: 400 Volt, Contrast: 400~4500, Illuminate power: 20 mW). It is only a little difference and indicates that the system condition remained the same. (a) Case I50-T30-1 (b) Case I50-T30-2 ... 99 Fig. 6.3 SHG images of GaN for system calibration. Left: The reference SHG image before taking the HGM skin image of the control group. Right: The SHG image before taking the HGM skin image of the glycerol group. (PMT setting: 400 Volt, Contrast: 400~4500, Illuminate power: 20 mW). It is only a little difference and indicates that the system condition remains the same. (a) Case I50-T90-1 (b) Case I50-T90-2 ... 100 Fig. 6.4 SHG images of GaN for system calibration. Left: The reference SHG image before taking the HGM skin image of the control group. Right: The SHG
image before taking the HGM skin image of the glycerol group. (PMT setting: 400 Volt, Contrast: 400~4500, Illuminate power: 20 mW). It is only a little difference and indicates that the system condition remained the same. (a) Case I50-T180-1 (b) Case I50-T180-2 (c) Case I50-T180-3 ... 100 Fig. 6.5 Quantitative analysis and comparison of skin THG intensities at five different depths. Black (control: N=10, glycerol: N=10). ... 102 Fig. 6.6 Quantitative analysis and comparison of skin SHG intensities at three different depths. Black (control: N=10, glycerol: N=10). ... 102 Fig. 6.7 En face skin image of Case I50-T15-1 (a) Glycerol-1 (b) Glycerol-2 (c) Control-1 (d) Control-2. Red: THG (Contrast setting: 600~10000). Green: SHG (Contrast setting: 600~8000). ... 104 Fig. 6.8 Quantitative analysis and comparison of skin THG intensities at five different depths. Black: Case I50-T30-1 (control: N=10, glycerol: N=10); Red: Case I50-T30-2 (control: N=10, glycerol: N=10). **P <0.01; *** P <0.001. C: control; G:
glycerol. ... 105 Fig. 6.9 Quantitative analysis and comparison of skin SHG intensities at three different depths. Black: Case I50-T30-1 (control: N=10, glycerol: N=10); Red: Case I50-T30-2 (control: N=10, glycerol: N=10). ** P <0.01. C: control; G: glycerol. .. 106 Fig. 6.10 En face skin image of Case I50-T30-1 (a) Glycerol-1 (b) Glycerol-2 (c) Control-1 (d) Control-2. Red: THG (Contrast setting: 600~15000). Green: SHG (Contrast setting: 600~10000). ... 108 Fig. 6.11 En face skin image of Case I50-T30-2 (a) Glycerol-1 (b) Glycerol-2 (c) Control-1 (d) Control-2. Red: THG (Contrast setting: 600~10000). Green: SHG (Contrast setting: 600~8000). ... 110 Fig. 6.12 Quantitative analysis and comparison of skin THG intensities at five
different depths. Black: Case I50-T90-1 (control: N=6, glycerol: N=6); Red: Case I50-T90-2 (control: N=6, glycerol: N=6). *P <0.05. C: control; G: glycerol. ... 111 Fig. 6.13 Quantitative analysis and comparison of skin SHG intensities at three different depths. Black: Case I50-T90-1 (control: N=8, glycerol: N=8); Red: Case I50-T90-2 (control: N=9, glycerol: N=9). C: control; G: glycerol. ... 111 Fig. 6.14 En face skin image of Case I50-T90-1 (a) Glycerol-1 (b) Glycerol-2 (c) Control-1 (d) Control-2. Red: THG (Contrast setting: 600~15000). Green: SHG (Contrast setting: 600~8000) ... 113 Fig. 6.15 En face skin image of Case I50-T90-2 (a) Glycerol-1 (b) Glycerol-2 (c) Control-1 (d) Control-2. Red: THG (Contrast setting: 600~10000). Green: SHG (Contrast setting: 600~8000) ... 115 Fig. 6.16 Quantitative analysis and comparison of skin THG intensities at five different depths. Black: Case I50-T180-1 (control: N=7, glycerol: N=7); Red: Case I50-T180-2 (control: N=9, glycerol: N=9). Blue: Case I50-T180-3 (control: N=10, glycerol: N=10). *P <0.05; *** P <0.001. C: control; G: glycerol ... 117 Fig. 6.17 Quantitative analysis and comparison of skin SHG intensities at three different depths. Black: Case I50-T180-1 (control: N=7, glycerol: N=7); Red: Case I50-T180-2 (control: N=9, glycerol: N=9). Blue: Case I50-T180-3 (control: N=10, glycerol: N=10). *P <0.05. C: control; G: glycerol. ... 117 Fig. 6.18 En face skin image of Case I50-T180-1 (a) Glycerol-1 (b) Glycerol-2 (c) Control-1 (d) Control-2. Red: THG (Contrast setting: 600~10000). Green: SHG (Contrast setting: 600~8000) ... 119 Fig. 6.19 En face skin image of Case I50-T180-2 (a) Glycerol-1 (b) Glycerol-2 (c) Control-1 (d) Control-2. Red: THG (Contrast setting: 600~15000). Green: SHG (Contrast setting: 600~8000) ... 121
Fig. 6.20 En face skin image of Case I50-T180-3 (a) Glycerol-1 (b) Glycerol-2 (c) Control-1 (d) Control-2. Red: THG (Contrast setting: 600~15000). Green: SHG (Contrast setting: 600~8000) ... 123
LIST OF TABLES
Table 3.1 Three different case types of the ex vivo optical clearing. ... 32 Table 3.2 Four different cases of the in vivo optical clearing. ... 43 Table 4.1 Skin structure analysis results of case E100-I90. (*P <0.05, ** P <0.01,
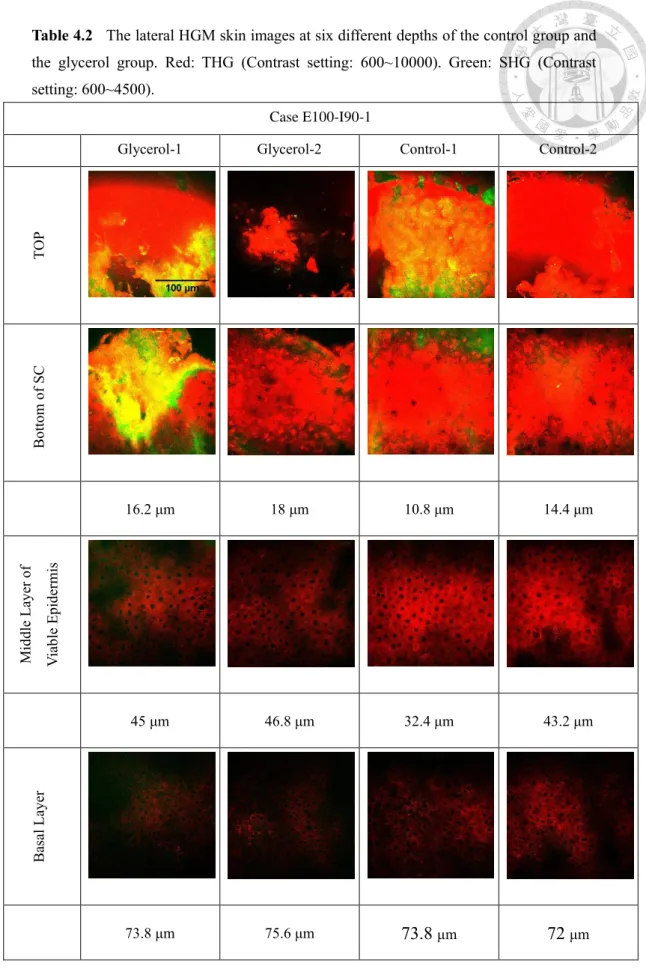
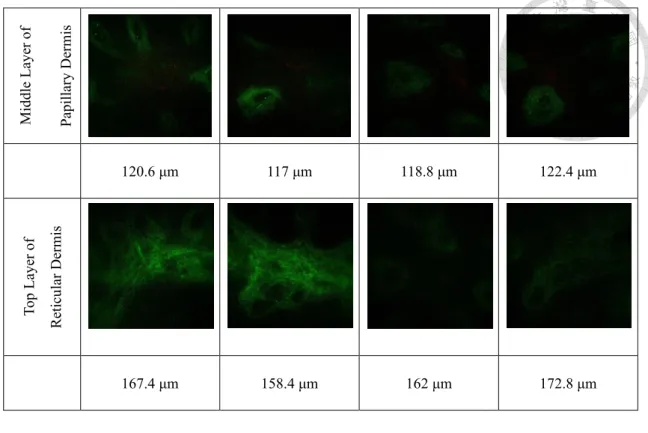
*** P <0.001) ... 59 Table 4.2 The lateral HGM skin images at six different depths of the control group and the glycerol group. Red: THG (Contrast setting: 600~10000). Green: SHG (Contrast setting: 600~4500). ... 62 Table 4.3 The lateral HGM images of the control group and the glycerol group at different depths. Red: THG (Contrast setting: 600~10000). Green: SHG (Contrast setting: 600~4500). ... 63 Table 4.4 Skin structure analysis results of Case E50-I90. (*P <0.05, ** P <0.01,
*** P <0.001) ... 66 Table 4.5 The lateral skin images of the control group and the glycerol group. We choose different skin layers to display the images. Red: THG (Contrast setting:
600~10000). Green: SHG (Contrast setting: 600~8000). ... 68 Table 4.6 The lateral skin images of the control group and the glycerol group. We choose different skin layers to display the images. Red: THG (Contrast setting:
600~10000). Green: SHG (Contrast setting: 600~4500). ... 70 Table 4.7 Skin structure analysis results of all studied cases. (*P <0.05, ** P <0.01,
*** P <0.001) ... 72 Table 4.8 Case E50-T90-1: The lateral skin images of the control group and the glycerol group. Different skin layers images were presented. Red: THG (Contrast setting: 600~6000). Green: SHG (Contrast setting: 600~8000). ... 75 Table 4.9 Case E50-T90-2: The lateral skin images of the control group and the
glycerol group. Different skin layer images were presented. Red: THG (Contrast setting: 600~10000). Green: SHG (Contrast setting: 600~4500). ... 76 Table 4.10 Case E50-T90-3: The lateral skin images of the control group and the glycerol group. Different skin layers images were presented. Red: THG (Contrast setting: 600~10000). Green: SHG (Contrast setting: 600~6000). ... 78 Table 4.11 Case E50-T90-4: The lateral skin images of the control group and the glycerol group. Different skin layers images were presented. Red: THG (Contrast setting: 600~8000). Green: SHG (Contrast setting: 600~6000). ... 80 Table 4.12 Skin structure analysis results of all studied cases. (*P <0.05, ** P
<0.01, *** P <0.001) ... 82 Table 4.13 Statistical analysis result on the THG intensity variation after the glycerol application. (-: no significant difference, △: Increased significantly, ▽:
Decreased significantly, *P <0.05, ** P <0.01, *** P <0.001) ... 82 Table 4.14 Statistical analysis result on the SHG intensity variation after the glycerol application. (-: no significant difference, △: Increased significantly, ▽:
Decreased significantly, *P <0.05, ** P <0.01, *** P <0.001) ... 83 Table 5.1 Variation of skin structure, THG intensity, and SHG intensity after 100%
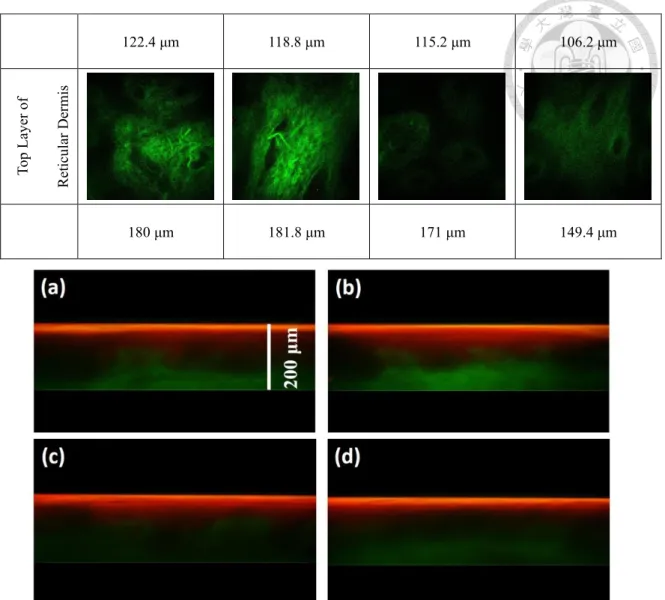
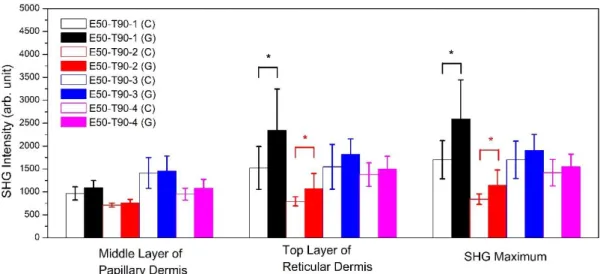
glycerol topical application for 30 minutes. ... 90 Table 5.2 The lateral skin images of the control group and the glycerol group at different depths. Red: THG (Contrast setting: 600~10000). Green: SHG (Contrast setting: 600~8000). ... 91 Table 5.3 Mean SHG intensities (arbitrary unit) of all studied cases at the middle papillary dermis layer, top reticular dermis layer, and SHG maximum layer. *P <0.05,
** P <0.01, *** P <0.001. ... 93 Table 6.1 Skin structure analysis results of all studied cases. (*p<0.05, **p<0.01,
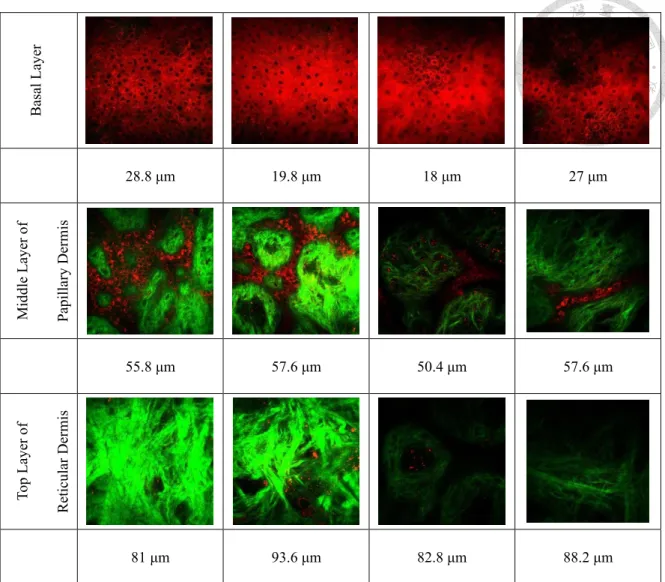
***p<0.001) ... 101 Table 6.2 Case I50-T15-1: The lateral skin images at different skin layers of the control group and the glycerol group. Red: THG (Contrast setting: 600~10000).
Green: SHG (Contrast setting: 600~8000). ... 102 Table 6.3 Skin structure analysis results of Case I50-T30. (*p<0.05, **p<0.01,
***p<0.001) ... 105 Table 6.4 Case I50-T30-1: The lateral skin images at different skin layers of the control group and the glycerol group. Red: THG (Contrast setting: 600~15000).
Green: SHG (Contrast setting: 600~10000). ... 106 Table 6.5 Case I50-T30-2: The skin images at different skin depths of the control group and the glycerol group. Red: THG (Contrast setting: 600~10000). Green: SHG (Contrast setting: 600~8000). ... 108 Table 6.6 Skin structure analysis results of all studied cases. (*p<0.05, **p<0.01,
***p<0.001) ... 110 Table 6.7 Case I50-T90-1: The skin images at different depths of the control group and the glycerol group. Red: THG (Contrast setting: 600~15000). Green: SHG (Contrast setting: 600~8000) ... 112 Table 6.8 Case I50-T90-2: The skin images at different depths of the control group and the glycerol group. Red: THG (Contrast setting: 600~10000). Green: SHG (Contrast setting: 600~8000) ... 113 Table 6.9 Skin structure analysis results of all studied cases. (*p<0.05, **p<0.01,
***p<0.001) ... 116 Table 6.10 Case I50-T180-1: The skin images at different depths of the control group and the glycerol group. Red: THG (Contrast setting: 600~10000). Green: SHG (Contrast setting: 600~8000) ... 118
Table 6.11 Case I50-T180-2: The skin images at different depths of the control group and the glycerol group. Red: THG (Contrast setting: 600~15000). Green: SHG (Contrast setting: 600~8000) ... 119 Table 6.12 Case I50-T180-3: The skin images at different depths of the control group and the glycerol group. Red: THG (Contrast setting: 600~15000). Green: SHG (Contrast setting: 600~8000) ... 121 Table 6.13 Skin structure analysis results of all studied cases. (*p<0.05, **p<0.01,
***p<0.001) ... 123 Table 6.14 Statistical analysis result on the THG intensity variation after the glycerol application. (-: no significant difference, △: Increased significantly, ▽:
Decreased significantly, *p<0.05, **p<0.01, ***p<0.001) ... 123 Table 6.15 Statistical analysis result on the SHG intensity variation after the glycerol application. (-: no significant difference, △: Increased significantly, ▽:
Decreased significantly, *p<0.05, **p<0.01, ***p<0.001) ... 124
Chapter 1 Introduction
1.1 Motivation
Optical microscopy is a light-based technique with a resolving power that is much higher when compared to other conventional imaging techniques such as ultrasound, x- ray tomography, and MRI. Optical microscopy is able to provide resolution in the submicron range, enabling it to resolve the fine structure inside a tissue. Its application has been extended into neural science which successfully shows sensory information within the rat brain in distributed spatiotemporal patterns of neuronal activity [1].
Although capable of providing high-resolution parameters, its application of clinical study is still limited by the imaging depth. As light scattering and absorption introduce both light pulse broadening, defocusing, and decrement of intensity, it is likely that image quality and contrast will be compromised with increasing depth of imaging [2]. Thus, in order to overcome the depth limitation and enhance the image quality, researchers have attempted to reduce the scattering of tissue turbidity by matching the refractive index using various osmotic agents, a procedure known as optical clearing.
The optical clearing was first studied by Tuchin using human sclera in 1997 [3] and since then, it has been frequently studied for various tissues. Many types of optical clearing agents (such as glucose, glycerol, peg-400, and DMSO) were combined with
different application methods (such as immersion, stratum corneum abrasion, injection, sonophoresis, micro-needle, and topical) to enhance optical clearing efficacy. Among these studies, skin optical clearing attracts high attention. The skin is the outermost organ of human, which acts as the barrier between organism and environment. Many skin diseases are related to morphological changes in the different skin layers. Early diagnosis of skin disease, studying age-related changes of morphology, and understanding drug delivery are essential in dermatology and cosmetology. However, the skin is a high scattering tissue that comprises multiple layers with a variation of refractive index. The turbid nature of the skin strongly decreases the imaging depth of the optical microscopy (OCT<2 mm [4], confocal<0.35 mm [5]). In order to increase the depth of investigation, the optical clearing technique of the skin was proposed. Although the effect and mechanisms of optical clearing have been studied by many different optical imaging techniques such as NIR spectrophotometer [3, 6-18], confocal microscopy [19-21], multi- photon microscopy [5, 22, 23], harmonic generation microscopy [5, 24], optical coherence tomography (OCT) [4, 9, 13, 15, 25-34], and Raman microscopy [35] in the past few decades, most of them focused on tissues ex vivo and rat in vivo imaging. The agents and methods which have proven effective for ex vivo tissue or in vivo rat have not yet been well applied for in vivo human studies due to the safety concerns, and for this reason, the optical clearing efficacy and mechanism remain unclear in human clinical
examinations.
Glycerol is the mostly-used and well-studied optical clearing agent for tissue ex vivo and rat in vivo to provide a promising optical clearing effect. Glycerol solutions have been shown to improve the skin condition and it is also widely used in skin-care products due to its high hygroscopicity in keeping the skin hydrated. It is a low toxicity substance and applied for skin-care products (Glysolid Germany) at low concentrations (50%). While the skin optical clearing effect of glycerol has been studied in some in vivo human experiments using OCT and NIR spectrometer, most were unsafe due to invasive methods or inappropriate concentrations of glycerol, resulting in tissue damage. On the other hand, the optical clearing effect of low concentration (below 50%) glycerol due to the safety concern for noninvasive skin imaging is still unclear due to inconsistent results and insufficient data from the OCT images.
In this thesis, we aim to study the optical clearing of ex vivo and in vivo human skin by noninvasive harmonic generation microscopy (HGM). HGM microscopy provides a much higher resolution compared to OCT, which is most frequently used to study optical clearing. Sub-micron resolution and label-free characteristics of HGM make it a promising tool to image and resolve the different layers of ex vivo and in vivo human skin.
Although the HGM is a useful tool for clinical imaging by combining the THG and SHG, there is no investigation about the clinical optical clearing by using HGM. We first
addressed the optical clearing effects and its mechanisms using a combination of the second and third harmonic generation. This unprecedented approach will enable us to obtain more information to realize the optical clearing mechanism. We want to achieve the optical clearing of the in vivo human skin, expanding the application of the HGM in the clinical region.
This study will be initiated in ex vivo experiments using two concentrations of glycerol solutions (50% and 100%) by topical application or immersion. Human skin tissue will be imaged by HGM microscopy before and after the glycerol solutions application. At least six different stacks of the image at different positions of each human skin were collected and averaged to obtained quantitative and statistical information of optical clearing efficiency. The subcellular resolution of the HGM image also enables us to directly observe the morphology change and the thickness variation of each skin layer, providing more information to study the mechanism of the optical clearing. For the in vivo human experiment, the same experimental and analytical processes will be carried
out but with only 50% glycerol topically on the human forearm due to the safety concern.
As the final goal of optical clearing research is the in vivo application, this study serves as a guide for future research of in vivo optical clearing of the human skin.
1.2 Thesis Scope
In chapter 2, all necessary background knowledge of this study is included. First, we
briefly introduce the skin structure of the human. Second, we review the investigations of the optical clearing on ex vivo and in vivo experiments. Third, we introduce the basic theory of the second harmonic generation and third harmonic generation.
In chapter 3, we perform all experiment methods and procedures of ex vivo and in vivo experiments. We summarize all the methods of sample preparation of ex vivo
experiments in section 3.1, and the details of the ex vivo imaging are included in section 3.2. In section 3.3, first, we describe the details of in vivo human experiments preparation include the scanning region selection and the glycerol application. Second, we perform the methods of in vivo human imaging by utilizing HGM microscopy. In section 3.4, all
analysis methods of the HGM images are included.
In chapter 4, we summarize the results of the ex vivo experiments. Afterward, we discuss the optical clearing effects and mechanisms of the ex vivo human skin in chapter 5.
In chapter 6, we summarize and discuss the results of the in vivo experiments.
Afterward, we discuss the optical clearing effects and mechanisms of the in vivo human skin in chapter 7.
Chapter 8 is the summary of this thesis.
Chapter 2 Background Knowledge
2.1 The Skin
2.1.1 Skin Structure and Barrier Function of the Stratum Corneum
Skin is the largest organ of the human body; approximately 16% of the total weight of the total body. Moreover, it is also one of the most important organs. As the outermost layer of the human body, its diverse functions help people to maintain daily life. It contains many different tissues, including blood vessels, nerves, glands, collagen fibers, and fat. The skin can basically be divided into three different layers, which are epidermis, dermis, and subcutaneous fat.[36] These layers work in concert to provide flexibility and strength. The epidermis is the first layer of the skin, and itself can be divided into stratum corneum (SC), and viable epidermis. The viable epidermis is the layer suited beneath the SC. It contains other sub-layers (stratum lucidum, stratum granulosum (SG), stratum spinosum and basal layer) in which the cells are at different stages of differentiation (Fig.
2.1). Actively dividing cells are present in the stratum basal to form the stratum granulosum (SG), stratum spinosum, and the stratum lucidum (only founded in the very thick epidermis of the palms and soles). There are two different types of granules formed at the viable epidermis. First is keratohyalin granules which is full of protein; the other one is lamellar bodies that contain lipids. The deposition of the dead cells without nuclei
SC. The most important function of the SC is the barrier function. The SC can prevent water loss and protect the body against the fluctuations in temperature, radiation, chemical toxic. “Brick and Mortar” is the basic model of SC. The SC cells and keratin microfibrils formed the brick structure. The intercellular space which fulfills the lipid was called mortar. The motor is the main reason that water cannot pass through the skin from the human body [37]. The barrier function will be destroyed by the use of surfactant and soap. The repeated wash of the skin by human cleaning products will break the barrier function by dissolving the lipid in the SC [38]. Most of the cosmetic products contain the surfactant to enhance the absorbing efficiency of their products by decreasing the barrier function. For drug delivery, SC will also cause the problem. Although the mechanisms of the drug delivery through the skin still unclear, there is some evidence showing the use of some methods like laser skin abrasion, skin stretching, tape stripping, ultrasonic and penetration enhancer are valid [39].
Skin is a complex organ that contains many layers for multiple functions. For these different layers, each of them has different refractive indices. These variations of refractive index cause much random scattering. In 1995, J. G. Fujimoto group determination the refractive index by measuring the focal length shift based on OCT (center bandwidth: 1300 nm, bandwidth: 50 nm). They computed that: for in vitro dermis:
1.41, in vivo stratum corneum: 1.51 and in vivo epidermis: 1.34 [40].
Fig. 2.1 The skin structure from the stratum corneum to the dermis.
2.1.2 Glycerol and the Human Skin
Glycerol or glycerin [𝐶3𝐻5(𝑂𝐻)3], is trihydroxy alcohol. It has three hydrophilic hydroxyl groups to provide high hygroscopicity and water solubility. Glycerol is also low toxic and widely used for the food industry, medicine, cosmetic products. For cosmetics, skincare products usually add glycerol because of its moisturizing and smoothing effects.
There are lots of investigations to illustrate that after applying glycerol cream or solutions on the skin, the skin condition will be improved [41-43]. There is evidence showing that the glycerol solution will benefit the dry lower leg skin with 20-40% concentration. They also compared two different cases: high concentration with shorter treating time and lower concentration with longer treating time. The first one shows better improvement, proving that the total quantity of glycerol is the main factor in improving the skin condition. However, when the concentration is higher than 40% the skin improvement ability will saturate [42]. Glycerol will also help the skin to rebuild the barrier function
remove the stratum corneum, there is a significant difference between occluding glycerol and untreated case. The untreated case showed higher trans-epidermal water loss after 14 days compare to the occluded ones. The glycerol can accelerate the rate of barrier function recovery.
2.2 Optical Clearing
Currently, light-based diagnostic techniques have been widely developed, such as confocal microscopy, optical coherence tomography (OCT), two-photon fluorescence microscopy (TPFM), harmonic generation microscopy (HGM) and Raman microscopy.
These optical microscopies can provide higher resolution and contrast images when compared to other conventional image techniques like x-ray computed tomography, MRI, ultrasound. It can provide submicron resolution to resolve the fine structure inside the tissues, expanding a new area for biomedical imaging. However, until this age, the application of optical microscopy is still limited because of the low imaging depth.
Optical scattering originated from the turbid tissue decreases the contrast and the spatial resolution, as well as the imaging depth. In order to enhance the image contrast and depth of the optical microscopy, people are trying to reduce the optical scattering inside the tissue by replacing the interstitial fluid with various agents, which is called optical clearing.
To our best knowledge, the first research of optical clearing was published in 1994,
originated from noninvasive monitoring the glucose concentration for human in vivo and in vitro [10, 11]. By using the near-infrared (NIR) light technique, they found that the concentration of glucose inside the human body affected the scattering coefficient. The higher the glucose concentration they used, the lower the light scattering inside the tissue.
It was also found that the optical clearing mechanism not only depends on the refractive index matching. In 1996, Hanli Liu et al., used both the Mie and Rayleigh-Gans theory approximation to simulate scattering properties inside the liver tissue [12]. The calculations showed that the changes in scattering properties were affected by the cell size and volume fraction, osmolarity, and change of refractive index. These simulations were also correlated with the experiment results. After that, there are many investigations to study optical clearing by applying various agents and methods, trying to find out the most effective optical clearing agents for different tissues. Among them, the optical clearing of
skin experiments attracts much intension.
2.2.1 Optical Clearing of the Ex Vivo Skin Experiments
The optical clearing technique was first studied by Tuchin in 1997, by immersing human sclera into optical clearing agents to reduce the scattering [3]. The method is to replace the interstitial fluid by some osmotic agents which are called optical clearing agents (OCAs) to make tissue transparent. The refractive index matching was convinced as the most important mechanisms to reduce the scattering inside the tissue. However, in
different experiments of various tissues such as sclera[3], liver[12, 27, 44], muscle[45], tendon[27, 45], and the skin[5-9, 20-22, 24-27, 35, 46, 47], the results showed that there were more complicated mechanisms of the optical clearing. The optical clearing mechanisms and efficacy are still unclear and need more investigations. Among these tissues, the optical clearing of the skin is the most frequently studied by using different OCAs and imaging techniques. The final goal of the optical clearing is the in vivo application. The investigations of ex vivo tissue opened the door for further study of in vivo experiments.
Different optical clearing agents (OCAs), such as glycerol, polyethylene glycerol (PEG), the combined PPG- and PEG-based polymer mixture, sorbitol, glucose, dextrose, oleic acid, dimethyl sulphoxide (DMSO) were applied to study the optical clearing effect of the skin. Their chemical structure can classify these chemical agents as alcohols, sugars, organic acid, and organic solvents. In 2005, Cohi et al., studied the optical clearing potential of these different groups of solutions by diffuse reflectance and total light transmittance. The hydroxy-terminated clearing agents, named alcohol, demonstrated the highest optical clearing power. Their results suggested that only the hydrophilic clearing agents will diffuse into the skin [46]. Based on the research of the Cohi et al., the optical clearing potential of different alcohols (glycerol, PEG400, PEG200, 1,3-propanediol, 4,4- butanediol, 1-butanol) were studied by Dan Zhu et al [6]. The results showed that the
optical clearing potential of these alcohols was related to the number of hydroxyl groups.
The more hydroxyl groups an OCA had, the more effective optical clearing. In contrast, the refractive index and the molecular weight of these alcohols did not correlate with the degree of the optical clearing effect. Glycerol is the one of the most effective OCAs among these alcohols with its strongest dehydration power [46, 48].
Glycerol is the most popular and well-studied OCAs of the optical clearing. In this section, we discussed and summarized the previous studies related to the optical clearing of the ex vivo skin by using two different applying methods: (1) Tissue immersion technique: It is the primary and most widely used method for OCAs application. By using tissue immersion technique, glycerol solutions is able to diffuse into the tissue from the every surface, and achieve a promising optical clearing effect [5, 8, 9, 21, 22, 24, 27, 47].
(2) Topical application: There are some other studies used the topical application on the epidermal side by considering the barrier function of the stratum corneum [6, 7, 20, 25, 26, 35]. The method of topical application provides less optical clearing effects, but this kind of noninvasive method is proper for the further in vivo experiment and then clinical.
Vargas et al. studied the optical clearing of ex vivo rat skin by spectrophotometer and OCT in 1999 [9]. They immersed the rat skin tissue into the anhydrous glycerol to achieve the optical clearing. After 20 minutes of immersion, the transmittance intensity increased and the reflectance intensity decreased. The human hair was put under the rat skin tissue
as the reference and took the OCT image. The skin appeared much darker at superficial layer and the hair under the skin became much brighter when comparing to the native skin. The shrinkage of the skin was also observed after the tissue immersion. Glycerol is a hyperosmotic agent that made water travel out of the cells. At the same time, glycerol traveled into the cells passively. However, the diffusion coefficient of the glycerol was much smaller than that of the water; less glycerol diffused into the tissue when compared with the water diffused out of it and resulted in the tissue shrinkage. The variation of the skin structure was also found to affect the scattering coefficient. The experiment results of the spectrophotometer correlate to the thickness of the skin. They hypothesized that the refractive index matching is the main but not only mechanism of the optical clearing.
The next important factor should be dehydration.
In order to prove and find out how dehydration affects the optical clearing efficacy, Xiangqun Xu et al., used near-infrared reflectance spectroscopy (NIR) to determine the water content inside the skin tissue [49]. The optical clearing rate of the porcine muscle by 80% glycerol application was strongly correlated to the water desorption with the unchanged thickness. There are three different kinds of water inside the tissue, which are strong tightly bound water, less tightly bound water, and buck water. There are three different stages of the optical clearing. In the first stage, transmittance was enhanced and reflectance was reduced rapidly at the first minute as the result of a loss of the buck water.
In the second stage, transmittance was enhanced and reflectance was reduced linearly during 1-10 minute as the result of a loss of the less tightly bound water. In the third stage, transmittance was enhanced and reflectance was reduced exponentially at the slowest rate during 10-30 minute as the result of a loss of the strong tightly bound water. In their research, glycerol showed a better optical clearing effect than that of the ethylene glycerol since that ethylene glycerol cannot introduce the third stage due to the lack of desorbing power. Dehydration was proved one of the most important mechanisms of optical clearing for porcine skin, human skin [24], rat skin [27]. In some cases, dehydration also changed the tissue structure. The collagen fibrils were found more densely packed after the glycerol application and the increased scattering as well as the image intensity.
The optical clearing of ex vivo skin by glycerol application has been studied by many optical imaging technique such as NIR spectroscopy [9, 27, 49], OCT [9, 26, 27, 47, 49], confocal microscopy(CM) [21, 24], two-photon fluorescence microscopy (TPFM) [5, 22, 23], Confocal Raman microscopy (CFM) [35], and second harmonic generation microscopy (SHGM) [5, 24]. These imaging techniques were used alone or combined to study the mechanisms and efficacy of optical clearing. In the most recent study by Tuchin in 2017, two different kinds of imaging techniques (Two-photon fluorescence microscopy and second-harmonic generation microscopy) were combined to study optical clearing quantitatively and qualitatively for ex vivo porcine skin. Two-photon excited auto-
fluorescence originated from NAD(P)H, keratin, elastin, and melanin, while the second harmonic generation is due to the collagen response. By combining these two different image techniques, the high-resolution images from the epidermis to the dermis can be obtained. Depth dependent increments of TPF and SHG intensities for samples after one- hour immersion by different concentrations (40%, 60%, 100%) glycerol in comparison with the control sample were obtained. At least three different stacks of the image at different positions of each porcine skin were collected and average to obtained quantitative information of optical clearing efficiency. There was a trade-off between concentration and viscosity. High concentration glycerol provided a higher refractive index matching condition to reduce the scattering inside the skin. However, the high concentration glycerol could not penetrate far enough into the deep region due to its high viscosity. Low concentration glycerol was with higher penetration ability but provided insufficient clearing effect via the refractive matching mechanism. For two-photon measurements, 100% glycerol is the most effective in the depth from 25 μm to 100 μm and intensity was enhanced by a factor of 1.6. While 60% glycerol introduces a better optical clearing for two-photon in depth from 100 μm to 200 μm by a factor of 1.3 and for SHG in depth from 50 μm to 200 μm by a factor of 1.7. Optical clearing should be used with caution to improve the signals of TPFM and SHGM in the region of interest.
2.2.2 Optical Clearing of the In Vivo Skin Experiments
Although there are many investigations to study the optical clearing effects and mechanisms of ex vivo skin tissue, there are quite different optical clearing efficacy between ex vivo and in vivo experiments. For in vivo experiments, the metabolism and blood circulation also affect the efficacy of optical clearing and OCAs cannot introduce the same optical clearing effect on the skin in vivo as that ex vivo. The strong barrier function of the stratum corneum makes substances hardly penetrate skins, and the optical clearing effects are not obvious by applying the OCAs on the surface in some previous study of in vivo experiments [14, 15, 33, 50]. As the results, many physical method such as injection[48, 51, 52] sonophoretic[33], electrophoretic[14], removal of SC[14, 29, 32, 53], laser ablation[18, 34, 54] and chemical methods such as chemical enhancer Thiazone [15, 54, 55] were applied to accelerating OCAs penetration into skin tissue. The basic theory for all these methods is reducing the barrier function and enhancing the penetration efficacy of OCAs by removing the SC or changing the skin condition. Most of these methods damaged the skin and were less desirable for the in vivo human clinical examination. Glycerol was proved the most effective optical clearing agent for the ex vivo experiments. However, for in vivo human experiments, the optical efficacy by topical application still remains unclear: First, the OCT images provide insufficient image information since it is unable to resolve the cellular morphology. Second, only one or two
volunteers were studied in the most of these previous studies, and the results between each studies were inconsistent. Some of it achieved the optical clearing, but the others were not [14, 30, 31, 33, 50]. When applied the glycerol on the volar forearm [50] and dorsal hand [33], no observable optical clearing effect. In contrast, when applied the glycerol on the palm [13, 30] and finger [31], the scattering of the skin was reduced and enhanced the image intensity. The optical clearing of the in vivo human skin still needs more exploitation. There are still lack of the study cases and the results were strongly affected by the individual differences of the human. Due to above reasons, it is thus essential to investigate the optical clearing technique for in vivo application with glycerol, and some optical clearing experiments of in vivo rat and human skin have already been studied. In this section, the experimental results by using glycerol application of in vivo
rat and in vivo human were presented.
Optical Clearing of In Vivo Rat Skin Experiments
In 2003, Vargas et al. studied the optical clearing effect by applying 100% and 75%
glycerol topically on the rat dorsal skin [47]. They used the dorsal skin flap window to pull the skin away from the body and sutured to a vertical C-Clamp. The glycerol solution was occluded the epidermis side of the skin, and the Doppler optical coherence tomography image was taken from 0 to 30 minutes. The results showed that the image intensity and contrast of blood vessel were enhanced by using these two different
concentrations glycerol. However, application of the 75% and 100% glycerol resulted in venule stasis for prolonged treatment times. In 2003, Tuchin and coworkers studied the back reflectance and micro-vascular system functioning at the action of osmotic agents [51]. Two different OCAs: 75% glycerol and 40% glucose, were injected into the rat. The results of 75% glycerol solution injection showed that the back reflectance reduced by 30% at the maximum and maintained for a long time. It was observed that 75% glycerol decreased the scattering but also caused hemolysis, dilation, and stasis in some micro- vessels. For 40% glucose, the back reflectance reduced 70% at the maximum but only remained for 1-3 minutes only. These two osmotic agents were used to improve the image depth by increasing the refractive index of the blood plasma to make it closer to the value of the erythrocyte cytoplasm, which is the main scatters of the blood. Glycerol acted as a better OCA due to its prolonged optical clearing effect. Based on the research of Vargas and Tuchin, the Dan Zhu group published two papers of the optical clearing by glycerol application of in vivo rat skin in 2008 and 2010 [48, 55]. In 2008, they studied the influence of glycerol with different concentrations (75%, 50%, 40%, 30%, and 20%) on skin optical clearing and morphological changed in vivo [48]. In order to find the best glycerol solutions concentration for in vivo application, the reflectance spectra were taken to monitor the optical clearing effect after different applying time (0 to 24 hours). The reflectance of the skin decreased after being injected withhigh concentration glycerol,
which meant scattering coefficient decreased and the skin became optical clearing. High concentration glycerol solution had a more prominent optical clearing effect than a lower one. However, high concentration glycerol solution (40%, 50%, 75%) made the skin suppurate and necrosis just like Vargas’s work and low concentration (20%) solution showed little optical clearing effect. 30% glycerol solution was believed to be the ideal concentration for the rat skin optical clearing when there was a safety concern by injection.
The reflectance was 0.8 and rose to the initial level in 10 minutes. In 2010, they studied optical clearing with the same experimental setup (optical clearing by injecting 20%, 30%, 75% glycerol solutions into rat dermis) but combined with more image techniques. SHG, NIR, TEM images were taken to get more information so that the mechanisms of optical clearing could be better studied [52]. The results showed that the variety of skin thickness affected the efficacy of optical clearing. After the glycerol solutions injection, the skin thickness decreased significantly and then increased with prolonged time. The results of the NIR spectrum correlated to the thickness measurement. When tissue shrank, the reflectance decreased also. In contrast, when tissue swelled, the reflectance increased.
Thickness was one of the main factors that affected the scattering properties inside the skin. For SHG image observation, after immersing the sample into the 13M glycerol for 30mins, the SHG signal became much weaker and the bundle pattern was no longer be observed as the consequence of collagen dissociation. However, for the in vivo case of
direct injection, no collagen dissociation was observed and the SHG signal was still strong.
These results indicated that the optical clearing effects and mechanisms are different for in vivo and ex vivo applications.
Optical Clearing of In Vivo Human Skin Experiments
The first optical clearing experiment of in vivo human skin was studied in 1994 by John S. Maier et al. [11]. With the measurement of the NIR spectrometer, they found that the light scattering coefficient inside the human thigh decreased after the sub-dermal injection of the high concentration glucose. Since then, people who studied the optical clearing technique tried to find out the best optical clearing agents and methods to increase optical clearing efficacy for in vivo human experiments. Glycerol was found as the most effective optical clearing agent for ex vivo skin experiments [46, 48]. Although there are some investigations about in vivo human skin optical clearing by using OCT and NIR spectrometer, most of them used inappropriate concentration glycerol or delivery methods resulting in skin damage. The experimental results of these studies are also inconsistent and provide insufficient experimental data. The optical clearing techniques can achieve a promising optical effect by glycerol application for in vivo rat, while for in vivo human skin, it still unclear and need more exploration.
In 2000, optical clearing efficacy of 100% glycerol with gelatin and 40% glucose with gelatin were compared by three different applying methods (topical application,
epidermis removal, and electrophoretic) by NIR reflectance microscopy [14]. The results indicated that the methods of topical application, epidermis removal, and electrophoretic would lead to the enhancement of optical clearing. Glycerol has better optical clearing efficacy when compared to the 40% glucose. The best optical clearing efficacy was obtained by using the electrophoretic administration glycerol from the anode, which could introduce nearly 20% reduction of the scattering signal. The topical application showed the minimal optical clearing among these methods, which could only introduce nearly an 8% reduction of the scattering signal for glycerol application.
In 2004, Xu et al. studied the optical clearing of in vivo human skin using OCT and spectrometer [13]. 80% glycerol was used as the clearing agents and topically applied on the palmar skin. The OCT and spectra were acquired respectively at the time intervals of 15, 30, 45, and 60 after the 80% glycerol applied topically on the skin surface. After 15 minutes, the upper layer of epidermis became more homogenous and the penetration depth was enhanced due to the refractive index matching as glycerol diffused into the skin. The clearing effect was maintained and saturated till 30minutes. After 30 minutes, the penetration depth was decreased, but the contrast started to be improved. The best optical clearing effect was obtained at 60 minutes with the maximum contrast. The skin layers of stratum corneum, viable epidermis and dermis were distinguished. In their study, the optical clearing was also studied by a spectrometer to acquire the scattering property
of the skin. Within 45 minutes after application, the diffuse reflectance decreased with time up to 6% and then increased at the time interval from 45 minutes to 60 minutes.
There was a compromise between optical clearing and contrast enhancement for the image. A substantial decrease in light scattering may actually decreased image contrast.
It was likely that there is an optimal time period after the addition of the glycerol solution to increase the imaging depth as well as that it needed sufficient backscattering for contrast enhancement. In this study, only one data of optical clearing by glycerol application was performed. The method of topically applied with glycerol was also studied by Proskurin et al. at 2007 [31]. In this study, same as the Xu’s research, only a data of a volunteer was performed. They applied 100% glycerol topically on the human finger. After 15 minutes application, the upper surface structures have similar resolution, whereas the deep vessel signal at ~1.5-1.7 mm was better resolved.
Although glycerol does lead to the optical clearing by topically applied in the above studies, there still some other researches do not agree with their results. In 2008, Xu et al.
published another research of optical clearing on dorsal hands [33]. Two different methods were applied and compared to study the optical clearing effect. The treatments were topically applied with a 60% glycerol solution (as control) or a 60% glycerol in combination with 15 minutes of ultrasound (60% G/SP). It can be seen that the light penetration depth of the skin treated with 60% G/SP was gradually enhanced from 1.4
mm to 2.5 mm at maximum (60minutes treatment). For the skin with 60% G (control), OCT imaging of the skin with only 60% glycerol applied topically has shown little enhancement in the imaging depth. This result has also been observed in the previous study in 2004 [50]. After applying 100% glycerol on the in vivo human forearm skin, there was not showing any enhancement of in vivo light penetration depth and contrast over 120 minutes. They suggested that it is extremely difficult for glycerol alone to permeate into viable skin and could not introduce the optical clearing.
There are still unclear optical clearing mechanisms and effects by topically applied glycerol on the in vivo human skin. The experiment results of previous studies are inconsistent, and only a few volunteer’s data were taken. It is still questionable that if glycerol will penetrate through intact skin with the stratum corneum. In 2011, the optical clearing efficacy of 40% glycerol was studied by quantifying permeability using OCT.
The measurements of 40% glycerol on the palm were carried out on four volunteers. In this study, the depth interval of 210-420 μm in the 1D OCT signal was chosen to calculate the attenuation coefficient. After the glycerol application, the attenuation coefficient started to decrease and then reached equilibrium after a long time of treatment. The decrement of the attenuation coefficient and the time of equilibrium were combined to calculate the permeability coefficient of 40% glycerol. The result indicated that 40%
glycerol would diffuse into the skin from the surface with a permeability coefficient of