Chapter 4
FEA and Experiment
This chapter reveals that a system including flexure hinge mechanism, PZT, voltage amplifier, and Non-Contacting Capacitive Gauge (NCCG) could precisely generate micro-scale of three-dimensional surface.
4.1 Methodology of EPFHM design
According to the design methodology from chapter three reveals that the deformation characteristics help precisely complete an EPFHM made of rough ABS by utilizing a rapid prototyping machine. Beginning with a weakened mechanism approach as the design process, it shows that the deformable displacement of EPFHM in each degree of freedom in translation/rotation can be driven by a PZT.
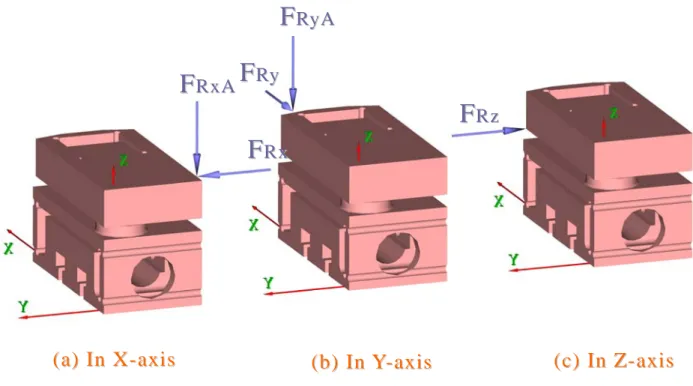
The design fixture needs to be defined as shown in Fig. 7 for illustrating the behavior of X, Y, and Z-axis translation. The component of X-axis occurred by the force of bending moment leads to X-axis translation while weakness design in X-axis. The behaviors of rotational degree of freedom for three axes are illustrated in Fig. 8, which is based on the mechanism of Fig. 7 with the additional rotational mechanism.
Fig. 7 Schematic diagrm of translation design in X, Y, and Z axes.
Fig. 8 Schematic design diagram of bending moment in R ,x Ry and Rz axes.
Based on the concept of designer’s preliminary analysis, simply structural estimation needs to be taken into consideration during the procedure. In reviewing weakness axis design shown in Fig. 9, which is the illustration of the relationship between
F F
xxF F
yyF F
zz((aa)) IInn XX--aaxxiiss ((bb)) IInn Y-Y-aaxxiiss ((cc)) IInn ZZ--aaxxiiss
F F
RRyyA AF F
RyRyF F
RRxxAAF F
RRxxF F
RRzztranslation and force. FRyA and FRy are the force of bending moment in which results in the force to the neck of mechanism, and Fx can be the force regarding as the compensation of translation.
Fig. 9 Schematic diagram of bending moment and translation in y-axis.
The position of FRyA and FRy force is regarded as the output position of PZT in which Fig. 8b illustrated the relationship of bending moment and force.
Fig. 8b illustrates the relationship of bending moment and force, and the applied position of FRyA and FRy is regarded as the position of applied force in experiment or output displacement of PZT. Respectively analyzing stiffness in X,Y,Z,A,B and C-axis helps examine the rigidity of weakened X-axis shown in Fig. 9, which is lower than Y and Z axes while analyzing the stiffness of
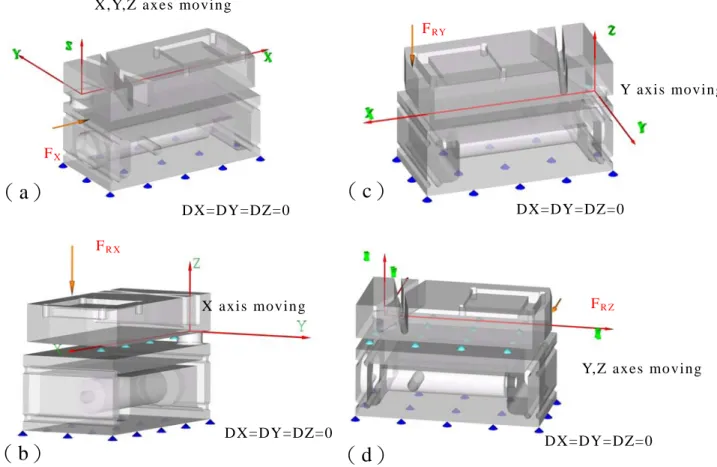
K value. And the boundary condition is illustrated in Fig. 10.
F F
RRyyA AF F
RyRy
Fig. 10 Definition of boundary condition based on FEM analysis.
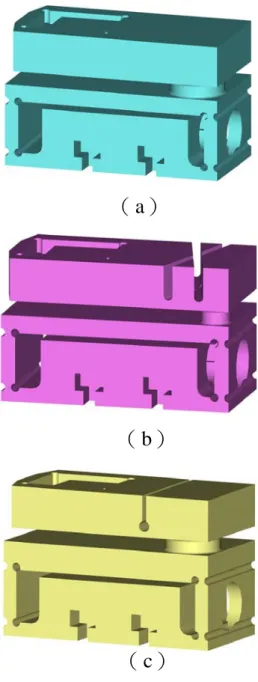
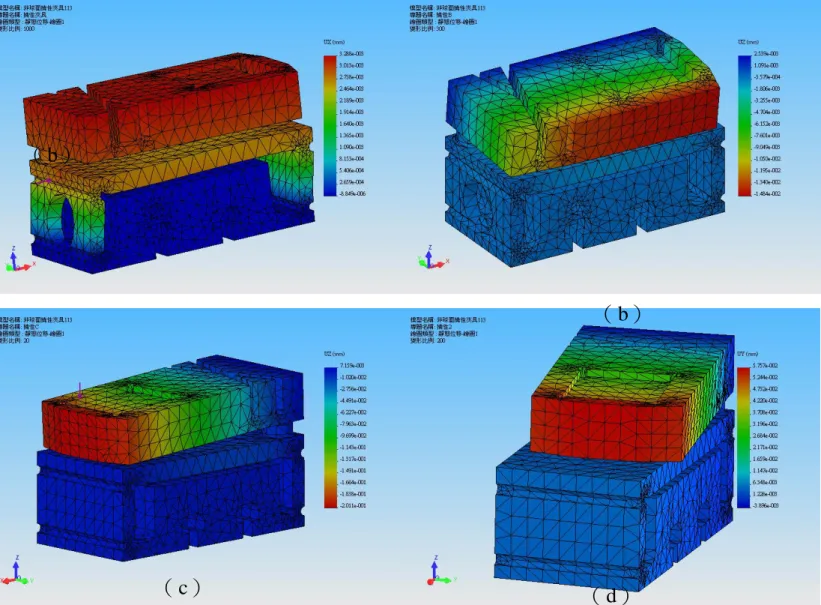
During the weakness design of rotational degree of freedom, the preliminary deformation design of Model 0 must be taken into consideration to help comprehend the appropriate weakness design style which is illustrated in Fig. 11b and 11c. The results of static analysis in each axis of Model 1 are shown as the deformation post-process diagram in Fig. 12, and K values are obtained after the calculation of Eq. (18). Correspondingly, Model 2 is identified with the same operation of Model 1.
Furthermore, the allowable quasi-linear displacement in each axis can be obtained by the calculation of maximum stress in each case.
There is no weakness design in Y and Z axes. The results of analyzing the translation effect in X-axis and the rotation effect in X,Y and Z axes are respectively labeled as Case 1, 2, 3 and 4.
DX=DY=DZ=0 DX=DY=DZ=0
DX=DY=DZ=0
DX=DY=DZ=0 FX
FRY
FR X
FR Z
Y axis moving
X axis moving
Y,Z axes mo ving
( c)
( d)
( a)
( b)
X,Y,Z axes moving
Fig. 11 (a) Model 0 (b) Model 1 (c) Model 2
( b)
( c)
( a)
Fig. 12 Deformation diagram of Case 1, 2, 3, and 4 based on FEM analysis.
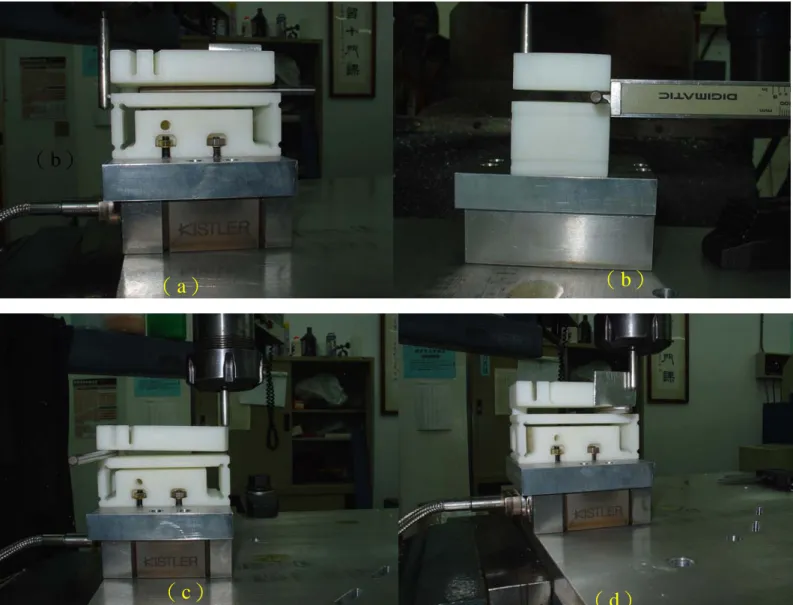
In this case, K values need to be derived from the measurement due to the irregularity of ABS RP. Fig. 13.(a) (b) (c) and (d) separately are the testing manipulation in different axis of Fig. 8 and 9. The constrained condition in each axis respectively refers to the FEA definition of Case 1, 2, 3, and 4,which is mentioned in the chapter 5.
( b)
( b)
( c) ( d)
Fig. 13 Stiffness experiment: (a) in translation x-axis, (b) in rotation x-axis, (c) in rotation y-axis, (d) in rotation z-axis.
In the FEA for finding the characteristic of EPFHM, if it brings a displacement to bear on the EPFHM with ∆ =0.031mm x normal displacement in minus x-direction of the top, it obtains the results of simulation having the maximum displacement as
∆z=0.02661mm in z-direction. Therefore, the displacement ratio of z-x is defined as a feature of fixture.
832 . 0 /∆ =
∆
= z x
ψ (21)
( b)
( a) ( b)
( c) ( d)
4.2 Methodology of System Design
The relationship between input and output of the system must be detected during the procedure in order to generate the precision surface. As an EPFHM, the displacement of fixture platform is output and the displacement occurred by the operation of PZT is input. Therefore, the system block diagram of Model 1 fixture is illustrated in Fig.14 with the input voltage and output displacement.
Fig. 14 System block diagram
The relationship of displacement and voltage in relation to combining PZT and voltage amplify is shown as below.
) (V f l=
∆ (22) The function relationship between displacement and voltage is acquired and illustrated in Fig.15 after repeatedly practical experiment of PZT under the environment with the minimum interference, and it reveals that the ∆l−Vcurve is approaching to
linear equation when voltage changes in the increasing process.
y = 0.031x - 32.023
y = 1E-08x3 - 4E-05x2 + 0.0562x - 32.184 -35
-30 -25 -20 -15 -10 -5 0 5
0 200 400 600 800 1000 1200
voltage displacement
Fig. 15 Diagrm of displacement versus voltage.
b V a l= +
∆ (23) The ∆l−V curve in the decreasing process leads to hysteresis phenomenon, and can be expressed as triple multinomial equation.
f V e V d V c
l= + + +
∆ 3 2 (24) And a,b,c,d,e,f are constants in which triple multinomial Utilizing the quasi-linear equation of Eq.(22) function helps control easily in order to simplify varied parameters. In this condition, b value is regarding the installation of measurement.
Before starting the experiment, the voltage is reset to 0 and helps acquire b=0 in the following derivation.
V a l =
∆ (25) In relation to the equation of Eqs.(1) and (4), the displacement of an EPFHM occurred by the PZT in the action position is regarded as the component displacement in each axis.
The translation vector in X-axis is shown as below.
] 0 0 [∆lx−∆lRy
=
∆x (26)
The translation vector in Y-axis is shown as below.
] 0 0
[ ly lRz y= ∆ −∆
∆ (27) The translation vector in Z-axis is shown as below.
] 0
0
[ lz lRx
z= ∆ −∆
∆ (28) And, the translation of a fixture - leads to rotation in A,B and C-axis - occurred by a PZT are shown as below.
] 0
0
[ Rx
F at
Rx l
Rx = −∆
∆l
] 0 0 [ Ry
F at
Ry l
Ry = −∆
∆l
] 0 0
[ Rz
F at
Rz l
Rz = −∆
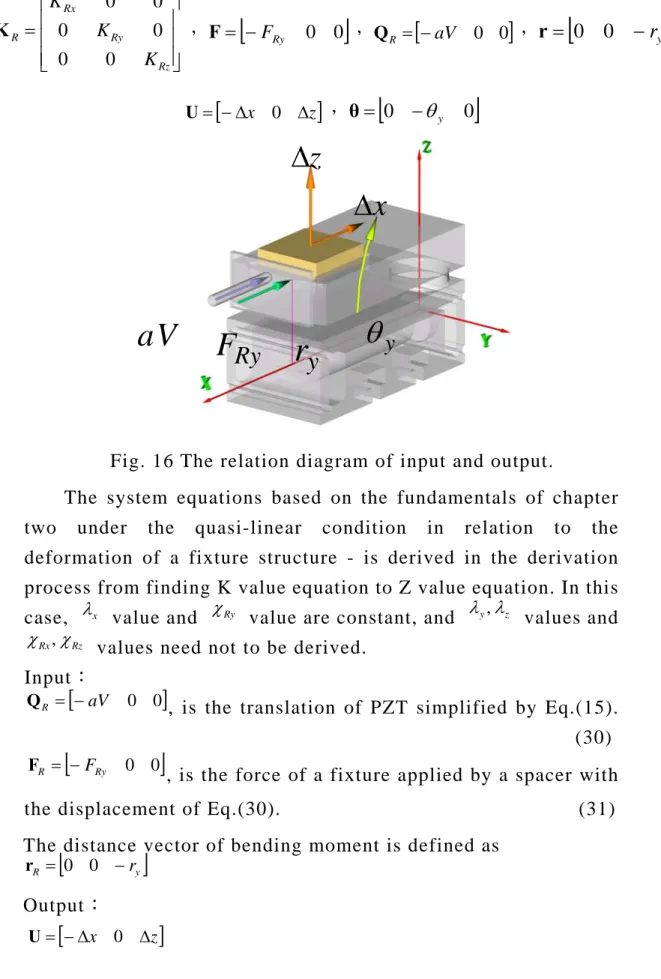
∆l (29) In design a mechanism for generating 3D micro-scale surfaces, a PZT used for driving on the fixture in minus x direction leads to a bending moment in B-axis, and a precise displacement in z-axis is occurred. So that this mechanism is recognized as a simplified case of a general mechanism with six degrees of freedom. The relationship between input and output is illustrated in Fig.16. ry is defined as the radius distance of bending moment, and the X,Y,Z coordinate system is also defined as virtual local coordinates by FEA or experiments.
⎥⎥
⎥
⎦
⎤
⎢⎢
⎢
⎣
⎡
=
Rz Ry Rx
R
K K K
0 0
0 0
0 0
K ,F=
[
−FRy 0 0]
,QR =[
−aV 0 0]
,r =[
0 0 −ry]
[
−∆x ∆z]
= 0
U ,θ=
[
0 −θy 0]
Fig. 16 The relation diagram of input and output.
The system equations based on the fundamentals of chapter two under the quasi-linear condition in relation to the deformation of a fixture structure - is derived in the derivation process from finding K value equation to Z value equation. In this case, λx
value and χRy
value are constant, and λy,λz
values and
Rz Rx χ χ ,
values need not to be derived.
Input:
[
aV 0 0]
R = −
Q , is the translation of PZT simplified by Eq.(15).
(30)
[
Ry 0 0]
R = −F
F , is the force of a fixture applied by a spacer with the displacement of Eq.(30). (31) The distance vector of bending moment is defined as
[
y]
R = 0 0 −r
r
Output:
[
−∆x ∆z]
= 0
U
∆ z
∆ x
θ
yr y
F Ry
V
a
[
0 ∆θy 0]
=
θ (32) Black box:
Three items need to be discussed:
1. The applied force FRy of a fixture occurred by a spacer.
2. The effect of bending moment caused by F ,Ry ry. 3. Friction force FFriction =
[
0 0 −FRyζ]
, which has friction coefficient of ζ . Therefore, the relationship of Input/Output is derived from the effects of translation and bending moment occurred byFRy.
From Eq.(1),
[ ] [ ]
⎥⎥
⎥
⎦
⎤
⎢⎢
⎢
⎣
⎡
⎥⎥
⎥
⎦
⎤
⎢⎢
⎢
⎣
⎡
∆
∆
−
=
−
−
z y x
z y x Ry
Ry
K K K z
x F
F
0 0
0 0
0 0
0 0
0 0
0 0 0
0
λ λ λ ζ
(33)
[
−FRy 0 −ζ FRy]
=[
−∆xλxKx 0 ∆zλzKz]
(34) It illustrates that FRy results in x-axial displacement and z-axial friction and also leads to the obstruction of output in ∆θy angular displacement. Therefore, the displacement of output, ∆z, could transform by angular displacement.
The derivation from Eq. (4) is shown as below.
[ ] [ ] [ ]
⎥⎥
⎥
⎦
⎤
⎢⎢
⎢
⎣
⎡
⎥⎥
⎥
⎦
⎤
⎢⎢
⎢
⎣
⎡
∆
=
−
−
×
−
−
Rz Ry Rx
Rz Ry Rx y
y y
Ry Ry
K K K r
r F
F
0 0
0 0
0 0
0 0
0 0
0 0 0
0 0
0 1
χ χ χ θ
ζ
(35) And ry1 friction results in the measurable radius of bending moment through the weakness design of a fixture.
[
0 −FRyry+ζ FRyry1 0] [
= 0 −∆θyχRyKRy 0]
(36) So,
Ry Ry y y
Ry y
Ryr F r K
F −ζ 1=∆θ χ
(37) From Eqs. (34) and (25), ∆l replaces ∆x as
x x
Ry x K
F =∆ λ
(38) So,
x x
Ry aV K
F = λ
(39) Eq.(37) is rewritten as
Ry Ry z y
y x
x K
Tan r r
r K V
a λ ( −ζ 1)=( −1δ )χ
(40) Due to the weakness design in B axle, all the angles are the same on the working platform. With small angle, it
K r r
r K V
a λx x( y−ζ y1)=χRy Ry δz
(41)
l Theoretica z =∆z δ
And the position of r=0 is the rotational centre of working platform with the weakness point of a fixture. With the variation of voltage in the position of ∆z measurement, so
) )(
( 1
χ ε ζ
η λ − +
=
∆ r
K r r V K
a z
Ry Ry
y y x x l
Theoretica
(42)
ε
is a constant. In this methodology, it reveals that the variation of voltage causes the deformation of weakness position and qualitative results by EFA. And η is relevant to friction effect, mechanism type and fixed pointed. Due to the necessity of modified coefficient ρ in experiment, so) ) (
( 1
χ ε ζ η λ
ρ − +
=
∆ r
K r r V K
a z
Ry Ry
y y x
x (43)
Followed with format of Eq.(20), it is rewritten as
) ( ε
φ +
=
∆z RV r (44) And, transform function is
Ry Ry
y y x x
R K
r r a K
χ ζ η λ
ρ
φ = ( − 1)
(45) The design methodology plans to obtain input/output system function in Eq. (44) format by FEA and practical measurement.
According to Eq. (29), the value of displacement is closed to lRy
∆
− (=−aV) due to the output displacement of PZT in x axle with weakness design. From Eq.(25) and (44), it reveals that coordinated equation of system displacement is
[
∆x ∆y ∆z] [
= −ξaV 0 φRV (r+ε)]
(46) And, ξ is modified function. If friction coefficient, flexure hinge mechanism, and material property are taken into consideration with quasi-linear in a system, ξ is a constant.While ry −ζ ry1 =0
in Eq.(45),
1 y
y
r
= r ζ
(47)
∆z represents an important discriminant and has further discussion in next chapter.