The Hong Kong Debt market in 2020
by the Monetary Management Department
Policy actions implemented by central banks and governments around the world in response to the COVID-19 pandemic led to a loose monetary environment for most of 2020. Among other things, central banks in major developed markets were seen to have slashed policy rates and injected liquidity through, for instance, direct bond purchases, with a view to loosening the financial conditions and stimulating economic growth. Scepticism towards how long the accommodative monetary environment might stay had increased as we headed into 2021, having regard to factors such as the latest development of the pandemic, rate of vaccinations, as well as timing and pace of economic recovery in key economies. In Hong Kong, new issuances of Hong Kong dollar debt instruments from the non-public segment registered a substantial increase in volume over 2019 as local and overseas issuers expanded the scale of their funding. This article offers a brief summary of the key developments in 2020.
Overview of international bond market
The outbreak of COVID-19 prompted central banks around the world to take action to address economic risks brought about by the pandemic. In the US, the Federal Reserve lowered the federal funds rate from 1.5%–1.75% at the beginning of the year to 0%–
0.25% through two consecutive rate cuts in March 2020, and relaunched its asset purchase programme.
US Treasury yields declined sharply in March, and only picked up slightly towards the end of the year.
Similarly, the European Central Bank kept interest rates at historically low levels and introduced the Pandemic Emergency Purchase Programme in Europe. As a result of the accommodative policies of major central banks, the monetary environment was loose in 2020. Emerging economies saw capital outflows from the debt market at the onset of the pandemic, but the situation soon stabilised.
According to the data from the Asian Development Bank, the size of local currency bond markets in Asia expanded notably as both the public and the private sectors continued to tap local bond markets to meet their funding needs.
CHART 1
Average borrowing costs in developed and emerging markets
Notes:
1. Average yields of the BofA Merrill Lynch G7 Government Index are used as proxies for the yield levels of developed markets.
2. Average yields of the ICE BofA Merrill Lynch Emerging Market Sovereign Bond Index are used as proxies for the yield levels of emerging markets.
Sources: Thomson Reuters, Bloomberg and BofA Merrill Lynch.
Overview of Hong Kong debt market
Driven by carry-trade activities and equities-related demands, Hong Kong dollar registered strong inflows in 2020. The strong-side Convertibility Undertaking was repeatedly triggered between April and October 2020. The aggregate balance increased from around HK$54 billion at the beginning of the year to around HK$457 billion in December. In line with other advanced economies, short-term interest rates as measured by Hong Kong Interbank Offered Rate or Exchange Fund Bills and Notes (EFBNs) yields generally decreased.
Yields of Hong Kong Government Bonds also declined during the year. At the short end of the yield curve, yields for the three-year and five-year tenors declined in the first half of 2020 and remained low for the rest of the year. At the long end of the curve, yields for the 10-year and 15-year tenors trended downwards in the first half of 2020 and picked up slightly from August.
Towards the end of the year, the spread between the long-tenor and short-tenor yields widened as the Hong Kong yield curve steepened in tandem with the US Treasury yield curve. Steepening of both curves reflected market expectations of stronger economic activity and higher prospects of inflation in the longer term.
In 2020, Hong Kong dollar debt issuance increased by 5% over 2019 to HK$4.32 trillion. The rise in issuance was contributed by increased issuance from both the public and non-public segments. Excluding EFBNs, new issuance of Hong Kong dollar debt instruments increased by 16.8% compared with 2019, reaching HK$923 billion.
Overseas entities
Although the US dollar/Hong Kong dollar basis spreads remained negative for most of 2020 (Chart 2), overseas issuers continued to participate in the local bond market. Multilateral development banks (MDBs) and non-MDB overseas issuers both increased their issuances of Hong Kong dollar debt by 80% and 2.8% respectively.
CHART 2
Key tenors of USD/HKD basis spreads
Source: Bloomberg.
Local corporates and authorized institutions (AIs)
At the same time, the scale of funding in the local debt market of local corporates continued to stay at a high level of above HK$35 billion in 2020. This was due mainly to the “pre-financing” and refinancing activities which took place to benefit from low local interest rates. On the other hand, AIs continued to remain one of the largest groups of local issuers. In 2020, AIs expanded the size of their new issuances by 19.6% from 2019 as most AIs tried to tap the Hong Kong dollar market to meet their short-term funding needs through the issuance of notes and certificates of deposit in the low interest rate environment. During the year, statutory bodies and government-owned corporations also expanded the scale of their funding by more than doubling their Hong Kong dollar issuances.
Government bonds
The HKMA continued to implement the Government Bond Programme to promote the further and sustainable development of the local bond market.
At the end of 2020, the total outstanding amount of 11 issues of institutional bonds stood at HK$80.6 billion. In addition, one Islamic bond issued under the Government Bond Programme was outstanding with an issuance size of US$1 billion.
During the year, the Government resumed the issuance of inflation-linked retail bond, iBond. The seventh batch of iBond was issued in November with an issuance size of HK$15 billion and a minimum annual interest rate of 2%. There were 456,380 valid applications and total subscriptions exceeded HK$38 billion. Separately, the Government continued the issuance of Silver Bond, an inflation- linked bond with a minimum annual interest rate of 3.5%, targeting Hong Kong residents aged 65 or above. The fifth batch of Silver Bond was issued in December with an issuance size of HK$15 billion. It attracted 135,243 valid applications with a total subscription of over HK$43 billion. The government retail bonds provided citizens with investment options that offered steady and guaranteed returns in the low interest rate environment, and both retail bonds received good response from the public.
In the 2021–22 Budget, the Government announced that the issuance of iBond and Silver Bond would continue to promote the further development of the local retail bond market.
Looking ahead
In the near future, factors such as the evolving development of the pandemic, possible geopolitical tensions, and timing and pace of recovery of key global economies, will continue to weigh on the outlook of the local bond market. The HKMA will continue to support the development of the local bond market through implementing various initiatives under the Government Bond Programme and Government Green Bond Programme.
APPENDIX (see notes)
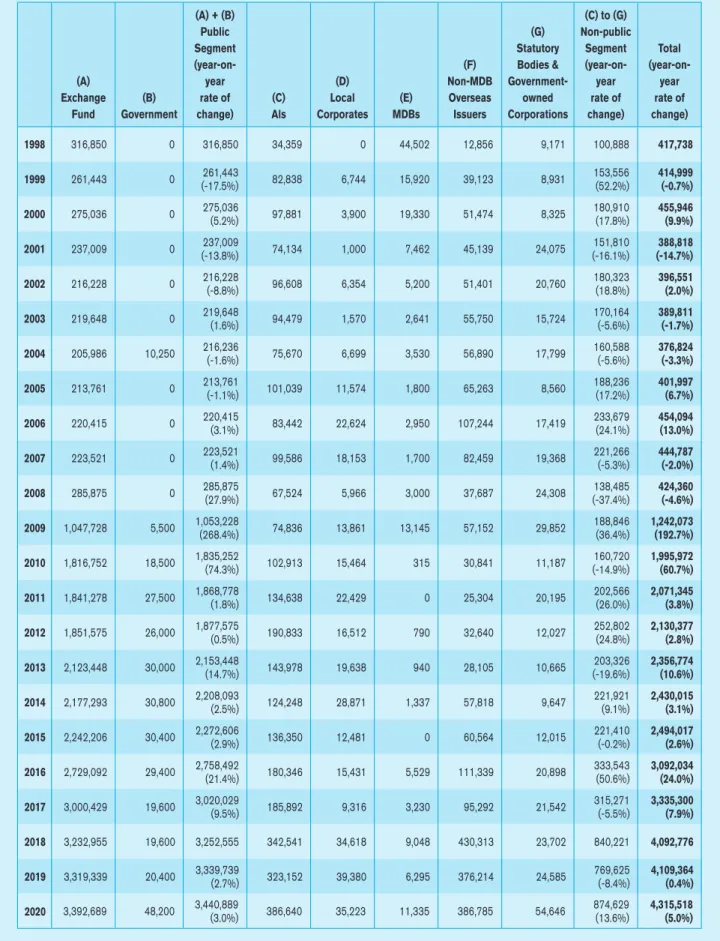
Table B1: Issuance of Hong Kong dollar debt instruments (in HK$ million)
(A) + (B) (C) to (G)
Public (G) Non-public
Segment Statutory Segment Total
(year-on- (F) Bodies & (year-on- (year-on-
(A) year (D) Non-MDB Government- year year
Exchange (B) rate of (C) Local (E) Overseas owned rate of rate of
Fund Government change) Als Corporates MDBs Issuers Corporations change) change)
1998 316,850 0 316,850 34,359 0 44,502 12,856 9,171 100,888 417,738
1999 261,443 0 261,443
(-17.5%) 82,838 6,744 15,920 39,123 8,931 153,556
(52.2%) 414,999 (-0.7%)
2000 275,036 0 275,036
(5.2%) 97,881 3,900 19,330 51,474 8,325 180,910
(17.8%) 455,946 (9.9%)
2001 237,009 0 237,009
(-13.8%) 74,134 1,000 7,462 45,139 24,075 151,810
(-16.1%) 388,818 (-14.7%)
2002 216,228 0 216,228
(-8.8%) 96,608 6,354 5,200 51,401 20,760 180,323
(18.8%) 396,551 (2.0%)
2003 219,648 0 219,648
(1.6%) 94,479 1,570 2,641 55,750 15,724 170,164
(-5.6%) 389,811 (-1.7%) 2004 205,986 10,250 216,236
(-1.6%) 75,670 6,699 3,530 56,890 17,799 160,588
(-5.6%) 376,824 (-3.3%)
2005 213,761 0 213,761
(-1.1%) 101,039 11,574 1,800 65,263 8,560 188,236
(17.2%) 401,997 (6.7%)
2006 220,415 0 220,415
(3.1%) 83,442 22,624 2,950 107,244 17,419 233,679
(24.1%) 454,094 (13.0%)
2007 223,521 0 223,521
(1.4%) 99,586 18,153 1,700 82,459 19,368 221,266
(-5.3%) 444,787 (-2.0%)
2008 285,875 0 285,875
(27.9%) 67,524 5,966 3,000 37,687 24,308 138,485
(-37.4%) 424,360 (-4.6%) 2009 1,047,728 5,500 1,053,228
(268.4%) 74,836 13,861 13,145 57,152 29,852 188,846
(36.4%) 1,242,073 (192.7%) 2010 1,816,752 18,500 1,835,252
(74.3%) 102,913 15,464 315 30,841 11,187 160,720
(-14.9%) 1,995,972 (60.7%) 2011 1,841,278 27,500 1,868,778
(1.8%) 134,638 22,429 0 25,304 20,195 202,566
(26.0%) 2,071,345 (3.8%) 2012 1,851,575 26,000 1,877,575
(0.5%) 190,833 16,512 790 32,640 12,027 252,802
(24.8%) 2,130,377 (2.8%) 2013 2,123,448 30,000 2,153,448
(14.7%) 143,978 19,638 940 28,105 10,665 203,326
(-19.6%) 2,356,774 (10.6%) 2014 2,177,293 30,800 2,208,093
(2.5%) 124,248 28,871 1,337 57,818 9,647 221,921
(9.1%) 2,430,015 (3.1%) 2015 2,242,206 30,400 2,272,606
(2.9%) 136,350 12,481 0 60,564 12,015 221,410
(-0.2%) 2,494,017 (2.6%) 2016 2,729,092 29,400 2,758,492
(21.4%) 180,346 15,431 5,529 111,339 20,898 333,543
(50.6%) 3,092,034 (24.0%) 2017 3,000,429 19,600 3,020,029
(9.5%) 185,892 9,316 3,230 95,292 21,542 315,271
(-5.5%) 3,335,300 (7.9%)
2018 3,232,955 19,600 3,252,555 342,541 34,618 9,048 430,313 23,702 840,221 4,092,776
2019 3,319,339 20,400 3,339,739
(2.7%) 323,152 39,380 6,295 376,214 24,585 769,625
(-8.4%) 4,109,364 (0.4%) 2020 3,392,689 48,200 3,440,889
(3.0%) 386,640 35,223 11,335 386,785 54,646 874,629
(13.6%) 4,315,518 (5.0%)
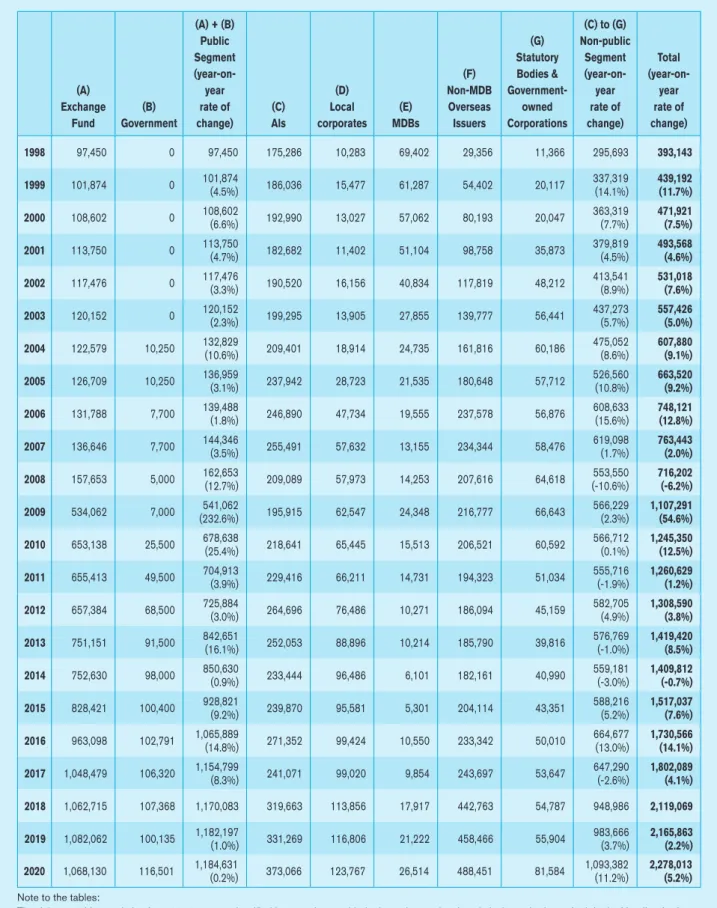
Table B2: Outstanding size of Hong Kong dollar debt instruments (in HK$ million)
(A) + (B) (C) to (G)
Public (G) Non-public
Segment Statutory Segment Total
(year-on- (F) Bodies & (year-on- (year-on-
(A) year (D) Non-MDB Government- year year
Exchange (B) rate of (C) Local (E) Overseas owned rate of rate of
Fund Government change) Als corporates MDBs Issuers Corporations change) change)
1998 97,450 0 97,450 175,286 10,283 69,402 29,356 11,366 295,693 393,143
1999 101,874 0 101,874
(4.5%) 186,036 15,477 61,287 54,402 20,117 337,319
(14.1%) 439,192 (11.7%)
2000 108,602 0 108,602
(6.6%) 192,990 13,027 57,062 80,193 20,047 363,319
(7.7%) 471,921 (7.5%)
2001 113,750 0 113,750
(4.7%) 182,682 11,402 51,104 98,758 35,873 379,819
(4.5%) 493,568 (4.6%)
2002 117,476 0 117,476
(3.3%) 190,520 16,156 40,834 117,819 48,212 413,541
(8.9%) 531,018 (7.6%)
2003 120,152 0 120,152
(2.3%) 199,295 13,905 27,855 139,777 56,441 437,273
(5.7%) 557,426 (5.0%) 2004 122,579 10,250 132,829
(10.6%) 209,401 18,914 24,735 161,816 60,186 475,052
(8.6%) 607,880 (9.1%) 2005 126,709 10,250 136,959
(3.1%) 237,942 28,723 21,535 180,648 57,712 526,560
(10.8%) 663,520 (9.2%)
2006 131,788 7,700 139,488
(1.8%) 246,890 47,734 19,555 237,578 56,876 608,633
(15.6%) 748,121 (12.8%)
2007 136,646 7,700 144,346
(3.5%) 255,491 57,632 13,155 234,344 58,476 619,098
(1.7%) 763,443 (2.0%)
2008 157,653 5,000 162,653
(12.7%) 209,089 57,973 14,253 207,616 64,618 553,550
(-10.6%) 716,202 (-6.2%)
2009 534,062 7,000 541,062
(232.6%) 195,915 62,547 24,348 216,777 66,643 566,229
(2.3%) 1,107,291 (54.6%) 2010 653,138 25,500 678,638
(25.4%) 218,641 65,445 15,513 206,521 60,592 566,712
(0.1%) 1,245,350 (12.5%) 2011 655,413 49,500 704,913
(3.9%) 229,416 66,211 14,731 194,323 51,034 555,716
(-1.9%) 1,260,629 (1.2%) 2012 657,384 68,500 725,884
(3.0%) 264,696 76,486 10,271 186,094 45,159 582,705
(4.9%) 1,308,590 (3.8%) 2013 751,151 91,500 842,651
(16.1%) 252,053 88,896 10,214 185,790 39,816 576,769
(-1.0%) 1,419,420 (8.5%) 2014 752,630 98,000 850,630
(0.9%) 233,444 96,486 6,101 182,161 40,990 559,181
(-3.0%) 1,409,812 (-0.7%) 2015 828,421 100,400 928,821
(9.2%) 239,870 95,581 5,301 204,114 43,351 588,216
(5.2%) 1,517,037 (7.6%) 2016 963,098 102,791 1,065,889
(14.8%) 271,352 99,424 10,550 233,342 50,010 664,677
(13.0%) 1,730,566 (14.1%) 2017 1,048,479 106,320 1,154,799
(8.3%) 241,071 99,020 9,854 243,697 53,647 647,290
(-2.6%) 1,802,089 (4.1%) 2018 1,062,715 107,368 1,170,083 319,663 113,856 17,917 442,763 54,787 948,986 2,119,069 2019 1,082,062 100,135 1,182,197
(1.0%) 331,269 116,806 21,222 458,466 55,904 983,666
(3.7%) 2,165,863 (2.2%) 2020 1,068,130 116,501 1,184,631
(0.2%) 373,066 123,767 26,514 488,451 81,584 1,093,382
(11.2%) 2,278,013 (5.2%) Note to the tables:
The debt securities statistics from 2018 were reclassified in accordance with the latest international statistical standards set forth in the Handbook of Securities Statistics published by the Bank for International Settlements, International Monetary Fund and European Central Bank. They may not be comparable with statistics previously published in the HKMA’s Quarterly Bulletins.
CHART B1
Proportions of Hong Kong dollar debt issuance activities (by type of issuer)
CHART B2
Proportions of outstanding Hong Kong dollar debt instruments (by type of issuer)
Notes:
1. Authorized institutions (AIs) include licensed banks, restricted licence banks and deposit-taking companies.
2. Multilateral development banks (MDBs) refer to the Asian Development Bank, the Council of Europe Development Bank (formerly known as the Council of Europe Social Development Fund), the European Company for the Financing of Railroad Rolling Stock, the European Investment Bank, the European Bank for Reconstruction and Development, the Inter-American Development Bank, the International Bank for Reconstruction and Development, the International Finance Corporation, the African Development Bank, the Nordic Investment Bank, and the CAF - Development Bank of Latin America. Income earned on Hong Kong dollar debt securities issued by the MDBs is exempt from profits tax.
3. Statutory bodies and government-owned corporations include Bauhinia Mortgage-backed Securities Limited, The Hong Kong Mortgage Corporation Limited, Airport Authority Hong Kong, Hong Kong Link 2004 Limited, Kowloon-Canton Railway Corporation, MTR Corporation Limited, Hong Kong Interbank Clearing Limited, Urban Renewal Authority, Hong Kong Housing Society, and Hong Kong Science and Technology Parks Corporation. It should be noted that while the issuers are public bodies in the legal sense, they are typically considered as non-public issuers by the market. Hence, they are categorised under the
“non-public” segment in the tables above.
4. Figures may not add up to the total because of rounding.
5. The debt securities statistics from 2018 are reclassified in accordance with the latest international statistical standards set forth in the Handbook of Securities Statistics published by the Bank for International Settlements, International Monetary Fund and European Central Bank. They may not be comparable with statistics previously published in the HKMA’s Quarterly Bulletins.