計畫中文摘要 計畫中文摘要 計畫中文摘要 計畫中文摘要: 了解身體肢段的力學作用和互動關係與高爾夫球揮桿動作之協調性的力量界限對於改善 高爾夫球揮桿表現和設計有效之訓練計畫有著至關緊要的重要性。高爾夫球揮桿動作的生物 力學特性已經被研究很多年在為選手找出最佳化表現。特別是手腕動作已經被一些研究者分 析了。雖然其他的因素也很重要,文獻亦顯現下桿時手腕的豎起與釋放動作是獲得撞擊時之最 大球桿頭速度的關鍵所在之一。然而迄今,在手腕釋放動作啟動的時間、揮桿表現和手臂肌 力之間的關係還尚未有解答。因此,本篇研究的目的就是:(1)利用測得選手揮桿之運動學與 動力學數據來證實手腕釋放時間和撞擊球體時桿頭速度之間的相互關係,和(2)以實驗數據及 最佳化電腦模擬分析以探討產生最大桿頭速度之最佳手腕、手肘、肩膀釋放時間與手臂肌力 相互關係。 利用最佳化模擬來測試假設的觀點並使用測得資料來驗證模型的參數。基於所得結果, 將可依個人肌力強度特質來建議促進揮桿表現的訓練策略。此結果也將幫助我們了解關節力 矩強度之限制對於揮桿表現的影響,及其對於揮桿動作動力學上與預防潛在運動傷害。 關鍵詞 關鍵詞 關鍵詞 關鍵詞:::::最佳化控制、腕部、高爾夫球、運動學、動力學學學學
Abstract 計畫英文摘要計畫英文摘要計畫英文摘要計畫英文摘要:
Understanding the effects of body segment dynamics and interactions with strength boundaries on the coordination of the golf swing is crucial for improving swing performance and the design of effective training plans. Biomechanical features of the golf swing have been studied for many years in an effort to optimize performance of golfers. In particular, wrist action during the swing has been analyzed by a number of researchers. The cocking and uncocking action of the wrist during the downswing is known to be critical to achieving maximum clubhead velocity at ball impact, although other factors may also be important. To date, the relationships among release time for the uncocking motion, swing performance, and arm strength have not been resolved. Therefore, the purposes of this study are: (1) to obtain the kinematic and kinetic data necessary to verify the relationship between wrist uncocking release time and clubhead speed at ball impact, and (2) to determine the relationship between wrist uncocking release time and arm strength necessary to produce maximum clubhead speed by both experimental and modeling approaches.
Optimal control modeling will be used to test hypothetical predictions, and the observed data will be used to verify the model's parameters. Based on the results, strategies for improving swing performance will be suggested. The results also will contribute to the understanding of the importance in performance of joint torque limits, particularly in the context of golf swing dynamics and with implications for potential injuries prevention.
Keywords: Optimal control, Wrist, Golf, Swing, Kinematics, Kinetics Introduction (前言前言前言前言)
experimentally and numerically carried out in this study. Biomechanical features of the golf swing have been studied for many years in an effort to optimize performance of golfers. In particular, wrist action during the swing has been analyzed by a number of researchers. The cocking and uncocking action of the wrist during the downswing is known to be critical to achieving maximum clubhead velocity at ball impact (Campbell and Reid, 1985), although other factors may also be important. To date, the relationships among release time of the uncocking motion, swing performance and arm strength have not been resolved. Optimal control modeling was used to test hypothetical predictions, and the observed data will be used to verify the model’s parameters. Based on the results, strategies for improving swing performance would be suggested.
Comparison of experimental results to optimal model predictions revealed that wrist strength plays a major role in golf swing performance, especially the wrist strength in high-speed rotation. Simulations of Study Three indicate that wrist strength is more crucial for improving the clubhead speed at impact than are shoulder and elbow strengths. For wrist release timing, simulations showed that for certain increases in wrist and elbow strength, a later wrist release timing may benefit the clubhead speed at impact. With increased shoulder strength, later wrist release may not be necessary. It seems that substantial delay in wrist release is not the only way to improve performance, but that the joint strength profile is also important. Furthermore, the strength at high speeds is crucial to performance, especial in the leading arm (non-dominant arm), but may be difficult to achieve because of limitations on muscle activation. While these observations are based on a model representing only a single swinging arm, the general principles seem to be very appropriate for application to real, two-arm golf swings.
This study has thus shown that individual dynamic characteristics must be evaluated in order to determine productive or counter-productive means of improving golfers’ performance.
Purpose (研究目的研究目的研究目的研究目的)
To date, the relationships among release time, swing performance and arm strength have not been resolved. Therefore, the purposes of this study are to obtain the kinematic and kinetic data necessary to verify the relationship between wrist uncocking release time, and clubhead speed at ball impact, and to determine the relationship between wrist cocking release time and arm strength necessary to produce maximum clubhead speed. Optimal control modeling will be used to test hypothetical predictions, and the observed data will be used to verify the model's parameters. Due to the differences between the optimal torque patterns obtained from two-segment modeling and from an actual swing, this study will use a two-segment model, a three-segment model and a four-segment model to determine the most appropriate complexity of the model.
This proposed study will also examine the relationship between optimal release time and arm strength. Based on these results, strategies for improving swing performance can be provided. The results will also contribute to the understanding of the importance of joint torque limits, particularly in the context of golf swing dynamics and with implications for potential injuries.
Related Literature (文獻探討文獻探討文獻探討文獻探討)
found that the shoulder torque first achieved the constraint boundary, and then the wrist, suggesting that the wrist action should be delayed to improve performance.
In addition to wrist timing issues, the peak torques generated by the linked body-arm system may be important. Lampsa (1975), using an optimal control model, showed that the torso torque did not limit the swing but that the shoulder and wrist torques reached their constraints and so may be limiting factors. Furthermore, electromyographic (EMG) data indicated that the relative activation of the trunk musculature is much less than that of the shoulder muscles during the swing (Pink et. al.,1990;1993; Watkins et. al.,1996). As torque and EMG activity are positively correlated, these data suggest that shoulder torque dominates the swing. The proposed study will characterize the relationships among wrist uncocking release time, arm strength, and torque during the downswing and predict optimal dynamics and kinematics as well as strategies for improving swing performance.
Research Methods(研究方法研究方法研究方法研究方法)
1. Study Design:
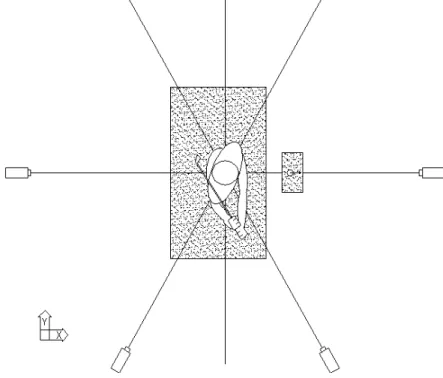
To answer the study questions, the following procedure was followed (Figure 1). First, a motion analysis system was arranged to collect swing data accurately from the subjects. Anthropometrics was obtained to derive the participants' inertia and mass property values. Next, a dynamic system model of a human swinging a golf club was developed, including the governing differential equations. Then, using the anatomical anthropometric measurements and calculated kinematic data, an inverse dynamics analysis were performed to obtain the torque history for the model. The torque history was used as an initial input for the optimal control modeling.
2. Subjects:
Six elite female collegiate golfer (a handicap index of 0 to 5) participating in this study as volunteers after signing the consent forms averaged 59±11.2 kg in weight, 163.8±6.9 cm in height and 21.8±1.3 years of age. They had played golf for an average of 5.2±1years. The handicap system developed by the United States Golf Association (USGA) was used to classify the test subjects. This system gives a ranking to participants based upon their golfing skill.
Figure 1 study procedures 3. The modeling simplifications in this study are as follows - The segments were modeled as rigid masses.
Comparing the experimental data and analyze optimal solutions Collecting swing data and anthropometrics data
Building up a dynamic system model
Obtaining Inverse dynamics analysis
- The joints were simple frictionless hinge joints. - The trunk was modeled as one segment only.
- The swing motion in the model is limited to a planar motion. From literature reports (Cochran & Stobbs, 1968; Soriano, 1997), the planar motion of the golf swing was verified.
- The constraints in this model can be adjusted to include the physical limits of the participants recruited for this study.
- Anthropometric parameters were obtained from statistical tables based on cadaver studies. These simplifying assumptions were made for the implementation of the dynamical model in this study, and these assumptions were necessary so that the model remained feasible. Models with such assumptions are widely accepted in the literature. Furthermore, the focus of this study is to examine the patterns of joint torques among golfers with different physical limits, but not to determine the exact joint torques for the optimal swing.
4. Instrumentation:
The two main components of this study were the quantification of the golf swings and mathematical modeling. The golf swings were performed, recorded, and quantified in National College of Physical Education and Sports (NCPES). Each participant (varsity and professional volunteers) were outfitted with 16 reflective markers on his joints and the test golf club were equipped with 3 reflective markers.
Specific instruments were used in this study include: 1) A Biodex Dynamometer for isokinetic strength testing.
2) Three-dimensional video motion analysis system with eight high-speed CCD cameras and reflective markers. Sampling rate at 500 Hz.
3) A High speed computing system to analyze video data, run forward simulations, run inverse dynamic simulations, solve minimization problems, and to serve as an instruction display during data collection.
4) Autolev, a dynamical simulation software package, for the formulation of the equations of motion and forward simulation routines.
5) Adams, a professional computer simulation software package, for the formulation of the equations of complexity model.
6) Reflective markers to be attached to the subject and the golf club, providing the spatial data to be captured by CCD cameras.
7) Test iron clubs and two mats, one for participants to stand on and the other for the tee and hanging the ball.
5. Test Administration:
Participants were tested standing on a mat and hitting the ball (Figure 2). Each participant was allowed as many practice swings and practice hits as necessary to gain a comfortable feeling with the testing environment. After warm up and some drills involving the wrist uncocking motion, their subsequent motion was recorded. The task for participants was to produce the best possible swings in terms of accuracy and speed.
1) Data collection procedures -Isokinetic strength measurements
Isokinetic wrist, elbow, shoulder torques were measured for participants as a gross indicator of participant strength. Measurements were performed using a Biodex Dynamometer owned and operated by Graduate Institution of Athletic training of NCPES. The average peak isokinetic torque was used to establish constraints on the controls as functions of the states of the system in the optimal control model, and also was compared to the optimal peak torque values in the model. 1) Data collection procedures
-Isokinetic strength measurements
operated by Graduate Institution of Athletic training of NCPES. The participants' average peak
Figure 2 Experimental set-up showing cameras, driver, data collection system, and participant position.
isokinetic wrist, elbow, and shoulder torque, defined as strength, were compared to the peak torque derived from the actual swing motion in order to examine how closely the participants reach the strength boundary. On the other hand, the average peak isokinetic torque was used to establish constraints on the controls as functions of the states of the system in the optimal control model, and also was compared to the optimal peak torque values in the model.
- Kinematic data
The first step was to process the 3D data transferred through the package software from the motion system. Then, the trajectories of each marker were smoothed using a zero phase-lag Butterworth second-order digital. With the marker position data, the joint angle histories could be computed. The time at the start of the downswing will be known, as well as the time of impact. Thus, a plot of the joint angle during the downswing through impact can be generated in a straightforward manner. Numerical differentiation was then used to calculate joint angular velocity and acceleration curves for each trial. Average plots with variance for all of the above plots then were obtained.
-Optimal Control Study
Optimal control problems have been solved to determine the optimal torques needed to maximize the distance of a golf drive (Lampsa, 1975; Campbell, 1985; Kaneko & Sato, 1993). Lampsa (1975), using a double pendulum, and Campbell (1985) and Kaneko and Sato (1993), using a three-segment pendula, reported a difference in joint dynamic patterns, with the latter one being more similar to experimental data. Therefore, this study compared two-segment and three-segment pendulum models in their dynamic pattern. Moreover, in these studies, only the shoulder and wrist were included, but the elbow was not included. In order to understand whether the elbow joint contribution can play an important role, the elbow joint was added in the third model for this study as well. Kane's method (Kane & Levinson, 1985) of describing dynamical
Desktop computer with build-in video board
systems was used to derive the equations of motion (EOM) for each model used. The software package Autolev was used to process each model's description and task-specific constraints to derive its EOM and produce FORTRAN77 code for the forward simulation. The performance criterion to be maximized was the clubhead velocity at impact. Constraints were applied to the system to match the physical constraints.
-Model verification
In order to obtain the best fit between the experimental and simulated results, Pearson correlation tests were performed between the experimental results of the most complex model and each of the simulated solutions.
-Model Result Analysis
To understand how strength is related to the dynamic pattern and optimal wrist release time, the joint torque constraints for the wrist and shoulder joints in the model were set up in different ways. Six different combinations of the joint torque constraints were modeled. The optimal joint torque histories and the angular displacement were obtained, and the optimal wrist release time was derived.
Then, the optimal wrist release time for (a) high wrist strength vs. low wrist strength, (b) high elbow strength vs. low elbow strength, and (c) high shoulder strength vs. low shoulder strength.
Results and discussions 結果與討論結果與討論結果與討論結果與討論
1. Isokinetic strength results
The results showed that the wrist of non-dominant arm played an important role with the clubhead speed as well as the elbow and shoulder of dominant arm( table 1, 2, and 3). It showed that the wrist strength in leading arm is important. The results may suggest stronger wrist strength is needed for wrist delay uncocking motion which is related to high speed releasing at wrist (2002, Tang).
Table 1 Isokinetic strength profile relative to downswing motion on wrist, elbow, forearm, and shoulder with 3 speeds (30,120, and 180 o/s)
C C C
Close to bodylose to bodylose to bodylose to body WRI-ULN FORE-SUP ELB-EXT SHO-EXT SHO-ADD SHO-TOWARD
Angular velocity( Angular velocity(Angular velocity( Angular velocity(oooo /s) /s) /s) /s) 606060 60 120120 120120 180 60 180180180 60 60 60 120 120 120 120 180 180 180 180 60 60 60 60 180 180 180 180 300 300 300 300 60 60 60 60 180 180 180 180 300 300 300 300 60 60 60 60 180 180 180 180 300 300 300 300 60 60 60 60 180 180 180 180 300 300 300 300 Mean MeanMean
Mean----ddddominantominant armominantominant arm arm arm((((N N N N m)m) 9.9m)m) 9.99.9 8.69.9 8.68.6 8.58.6 8.5 3.18.58.5 3.13.13.1 2.92.92.9 2.72.9 2.7 24.3 2.72.7 24.3 24.3 24.3 17.9 17.9 17.9 17.9 13.0 13.0 13.0 13.0 35.7 35.7 35.7 35.7 25.0 25.0 25.0 25.0 13.7 13.7 13.7 13.7 27.9 27.9 27.9 27.9 22.6 22.6 22.6 22.6 21.2 21.2 21.2 42.6 21.2 42.6 42.6 42.6 24.5 24.5 24.5 24.5 12.6 12.6 12.6 12.6 Standard Deviation Standard Deviation Standard Deviation Standard Deviation 2.62.6 2.62.6 1111.8.8.8.8 2.32.32.32.3 0.50.50.50.5 0.60.6 0.60.6 1.0 6.1 1.01.01.0 6.1 6.1 6.3 6.1 6.3 6.3 6.3 6.6 6.6 6.6 6.6 10.5 10.5 10.5 10.5 13.1 13.1 13.1 13.1 13.3 13.3 13.3 13.3 8.2 8.2 8.2 8.2 7.8 7.8 7.8 7.8 11.5 11.5 11.5 12.3 11.5 12.3 12.3 12.3 13.2 13.2 13.2 13.2 8.7 8.7 8.7 8.7 Mean MeanMean
Mean----nonnon----dominant arm (N m)nonnondominant arm (N m)dominant arm (N m)dominant arm (N m) 10.510.510.5 9.610.5 9.69.6 8.69.6 8.68.68.6 4.34.3 3.64.34.3 3.63.6 3.33.6 3.33.33.3 22.9 22.9 22.9 22.9 15.6 15.6 15.6 15.6 12.7 12.7 33.0 12.7 12.7 33.0 33.0 33.0 24.6 24.6 24.6 24.6 9.9 9.9 9.9 9.9 22.6 22.6 22.6 22.6 17.5 17.5 17.5 17.5 10.5 10.5 10.5 35.4 10.5 35.4 35.4 35.4 22.5 22.5 22.5 22.5 9.7 9.7 9.7 9.7 Standard Deviation Standard Deviation Standard Deviation Standard Deviation 2.92.92.9 2.22.9 2.22.2 2.72.2 2.72.72.7 0.70.70.70.7 0.30.3 0.30.3 1.11.11.11.1 4.94.9 5.7 4.94.9 5.7 5.7 5.7 6.5 6.5 6.5 6.5 5.8 5.8 5.8 5.8 10.0 10.0 10.0 10.0 9.1 9.1 5.8 9.1 9.1 5.8 5.8 5.8 4.8 4.8 4.8 4.8 7.7 7.7 7.7 7.7 7.9 7.9 7.9 7.9 8.0 8.0 8.0 8.0 6.9 6.9 6.9 6.9 R RR Ratio atio atio atio (dominant /non (dominant /non(dominant /non
(dominant /non----dominant)dominant) dominant)dominant) 0.950.950.950.95 0.890.890.89 0.990.89 0.990.990.99 0.720.720.720.72 0.810.81 0.820.810.81 0.820.820.82 1.06 1.06 1.06 1.06 1.15 1.15 1.15 1.15 1.02 1.02 1.02 1.02 1.08 1.08 1.08 1.08 1.02 1.02 1.02 1.02 1.38 1.38 1.38 1.38 1.23 1.23 1.23 1.23 1.29 1.29 1.29 1.29 2.01 2.01 2.01 1.20 2.01 1.20 1.20 1.20 1.09 1.09 1.09 1.09 1.30 1.30 1.30 1.30
1.WRI-RAD:WRIST--ULNAR 2. FORE-SUP:FOREARM SUPINATION 3.ELB-EXT:ELBOW-EXTENTION 4.SHO-EXT:SHOULDER-EXTENTION 5.SHO-ADD:SHOULDER-ADDUTION 6.SHO-TOWARD:
SHOULDER- TOWARD
Table 2 Isokinetic strength profile relative to upswing motion on wrist, elbow, forearm, and shoulder with 3 speeds (30,120, and 180 o/s)
A A A
Away from bodyway from bodyway from bodyway from body WRI-RAD FORE-PRO ELB-FLE SHO-FLE SHO-ABD SHO-AWAY
Angular velocity( Angular velocity(Angular velocity( Angular velocity(oooo /s) /s) /s) /s) 606060 60 120120 120120 180180180180 60606060 120 120120120 180180180180 60606060 180180180180 300300 300300 60606060 180180 300180180 300300 60300 606060 180 300180180180 300300300 60606060 180180180180 300300300300 Mean MeanMean
Mean----ddddominantominant armominantominant arm arm arm((((N N N N m)m)m) 8.2m) 8.28.2 7.08.2 7.0 6.67.07.0 6.66.66.6 4.74.74.7 4.54.7 4.54.54.5 4.44.44.44.4 21.021.0 13.821.021.0 13.813.8 8.713.8 8.78.7 36.78.7 36.736.7 27.236.7 27.227.2 10.127.2 10.110.110.1 27.227.2 24.027.227.2 24.024.024.0 9.59.59.59.5 40.540.540.540.5 28.928.928.928.9 15.215.215.215.2 Standard Deviation Standard Deviation Standard Deviation Standard Deviation 2.22.2 2.22.2 1.21.2 1.21.2 1.41.41.41.4 0.40.4 0.60.40.4 0.60.6 0.50.6 0.50.50.5 6.46.46.4 3.56.4 3.53.53.5 4.44.4 4.84.44.4 4.84.8 5.34.8 5.35.3 8.55.3 8.58.58.5 4.14.14.14.1 7.77.7 8.67.77.7 8.68.68.6 5.65.65.6 6.65.6 6.66.6 8.56.6 8.58.5 8.5 Mean MeanMean
Standard Deviation Standard Deviation Standard Deviation Standard Deviation 1.7 1.71.71.7 1.41.4 1.41.4 1.31.31.31.3 0.70.7 0.70.7 1.0 1.01.01.0 1.01.01.0 4.71.0 4.74.7 3.64.7 3.63.63.6 3.83.8 4.13.83.8 4.14.1 4.94.1 4.94.9 7.34.9 7.37.37.3 5.75.75.75.7 5.05.0 6.25.05.0 6.26.26.2 8.88.88.8 8.08.8 8.08.0 6.88.0 6.86.8 6.8 R RR Ratio atio atio atio (dominant /non (dominant /non(dominant /non
(dominant /non----dominant)dominant)dominant)dominant) 1.091.091.091.09 1.031.031.031.03 1.02 0.991.021.021.02 0.990.99 0.99 1.041.041.041.04 1.121.121.12 1.011.12 1.011.011.01 1.041.04 1.101.041.04 1.101.101.10 1.031.031.031.03 1.061.061.061.06 1.031.031.031.03 1.031.03 1.361.031.03 1.361.361.36 1.381.381.38 0.971.38 0.970.970.97 0.950.950.950.95 0.900.900.900.90
1.WRI-ULN:WRIST-RADIAL 2 FORE-PRO:FOREARM-PRONATION 3.ELB-FLE:ELBOW-FLEXTION 4.SHO-FLE:SHOULDER-FLEXION 5.SHO-ABD:SHOULDER-ABDUCTION 6.SHO-AWAY:
SHOULDER-AWAY
Table3 Pearson correlation coefficient of joint strength and clubhead speed at impact(n=6)with significance
Joints Motion P value Significance
Wrist Left wrist radial deviation1800
/s
.848 .033*
Elbow Right elbow flexion 600/s .873 .023*
Elbow Right elbow flexion1800
/s .917 .010*
Elbow Right elbow flexion 3000
/s .959 .003**
Shoulder Right shoulder flexion600/s .867 .025*
(*
:P<.05)
(**
:P<.01)
2. Optimal Control Study
Optimal simulations were calculated with the wrist strength boundary varied from –50% to +100 % of the subject M4’s peak wrist torque. Trunk, shoulder, and elbow torque did not vary much but wrist torque did when wrist torque constraints increased. With the higher wrist strength limit, the wrist torque constraint was achieved later. Angular displacements showed that the elbow had more flexion and the wrist release timing was later when the wrist strength boundary became higher. Differences in angular velocity between high wrist strength and low wrist strength became greater in the wrist but was not much in the trunk.
Threshold joint strength in a golf swing may also be inferred from injury reports. A survey of professional golfers regarding injury was conducted by McCarroll and Gore (1982) , who found that the left wrist was most commonly injured (27%) in professional golfers. By contrast, the most commonly injured region in amateur golfers is the lower back (24%; see Duda, 1987). The present study using elite golfers shows that wrist strength likely imposes a limiting factor on the swing, a finding that is consistent with injury reports among professionals.
(1) Low and High Elbow Strength Boundary
Simulation results were obtained for solutions with the elbow strength boundary varying from –50% to +100 % of the subject’s peak elbow torque. The trunk, shoulder, and wrist torques did not vary when the elbow torque constraints increased, but they varied some when the constraints were reduced. With higher elbow strength limits, the elbow torque constraint was achieved later but dropped more. Angular displacement at all joints varied less than 0.1 rad when the elbow strength boundary became greater, but varied up to 1.1 rad when the elbow strength boundary was reduced. The angular velocity analysis showed similar results.
(2)Low and High Shoulder Strength Boundary
increased by 50%. The angular displacement of the shoulder, elbow and wrist changed up to 75% when the constraint was reduced 50%.
(3)Wrist Release Timing
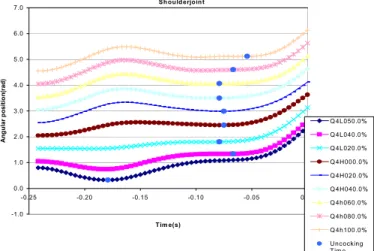
The wrist release timing resulting from varied wrist, elbow, shoulder strength boundaries is shown in Figures 1 to 3. The wrist release timing was delayed more when the wrist strength boundary was increased from 0% through 40%, then did not change after the wrist strength boundary increased to 80%, but was prolonged when the wrist strength boundary was reduced from 0% to -40%.
The wrist release timing delay was 0.025 s when the elbow strength boundary was increased from 0% through 20%, did not change much after a 20% increase or a redution from 0%, but increased again when the wrist strength boundary was reduced from -20% to -40% (Figure 2).
Wrist release timing was a little earlier when the shoulder strength boundary was increased from 0% through 60%, was delayed further after wrist strength boundary increased to 100%, but did not change substantially when shoulder strength boundary was reduced from (0% through -40%) except at -50% (Figure 3).
(4)Performance (Clubhead Speed at Impact)
Results for clubhead speed at impact as derived from the optimal control model for the variable wrist, elbow, and shoulder strength boundaries are shown in Figure 4. Clubhead speed at impact increased up to 9.0% when the wrist strength boundary increased through 100%, but only improved up to 1.8% for elbow strength boundary increases and up to 0.9% for shoulder strength boundary increases. The clubhead speed at impact did not change after an increase of 20% of elbow strength. The clubhead speed at impact also dropped much faster with a reduction of the wrist strength than with reduction in elbow and shoulder strengths. This result shows that wrist strength is the most crucial to performance in terms of clubhead speed at impact.
Discussion
Joint Strength Boundary and Strategy
From this study, it is possible to determine an efficient training plan based on variable physical strength. Training can improve strength typically up to 40%. This study tested the hypothesis that the optimal time for initiation of wrist release is (a) positively associated with wrist strength, (b) inversely associated with shoulder joint strength, and (c) inversely associated with elbow joint strength (Hypothesis 2). The model used here showed that within the range of a 40% increase in the wrist or elbow strength boundary, a later wrist release is preferred for optimal performance. However, earlier or constant wrist release time is preferable within the range of a 40% increase in the shoulder strength boundary. Interestingly, the relationship between the elbow strength boundary and wrist release timing is similar to that exhibited by the wrist strength boundary. This result does not support Hypothesis 2(c). If wrist strength is improved over the shoulder strength, then the wrist release timing is delayed for optimal performance.
Joint Strength Boundary and Clubhead Speed at Impact
W ris t jo in t -1 .0 0 .0 1 .0 2 .0 3 .0 4 .0 5 .0 6 .0 7 .0 -0.2 5 -0 .2 0 -0 .1 5 -0 .1 0 -0 .0 5 0 .0 0 T im e (s ) A ngul ar pos ition(r ad) Q 4 L 0 5 0 .0 % Q 4 L 0 4 0 .0 % Q 4 L 0 2 0 .0 % Q 4 L 0 0 0 .0 % Q 4 H 0 2 0 .0 % Q 4 H 0 4 0 .0 % Q 4 H 0 6 0 .0 % Q 4 H 0 8 0 .0 % Q 4 H 1 0 0 .0 % U n c o c k in g T im e
Figure 1 W rist an gu lar disp lacem en t an d u ncock ing tim e fo r v aried w rist stren gth bo u nd aries. Elbow joint -1.0 0.0 1.0 2.0 3.0 4.0 5.0 6.0 7.0 -0.25 -0.20 -0.15 -0.10 -0.05 0.00 Time(s) Angu la r pos it io n (r a d) Q4L050.0% Q4L040.0% Q4L020.0% Q4L000.0% Q4H020.0% Q4h040.0% Q4H060.0% Q4h080.0% Q4h100.0% Uncocking Time
Figure 2 W rist angular displacement and uncocking time for varied elbow strength boundaries. Shoulderjoint -1.0 0.0 1.0 2.0 3.0 4.0 5.0 6.0 7.0 -0.25 -0.20 -0.15 -0.10 -0.05 0.00 Tim e(s) A n gu la r po si ti on (r ad ) Q 4L050.0% Q 4L040.0% Q 4L020.0% Q 4H000.0% Q 4H020.0% Q 4H040.0% Q 4h060.0% Q 4h080.0% Q 4h100.0% Uncocking Tim e
48 50 52 54 56 58 60 62 64 -60 -50 -40 -30 -20 -10 0 10 20 30 40 50 60 70 80 90 100 110
Percentage of strength boundary (%)
C lubhe ad Spe e d ( m /s) Shoulder Elbow W rist
Figure 4 The clubhead speed through varied strength boundaries in wrist, elbow, shoulder joints.
Conclusions
Comparison of experimental results to optimal model predictions revealed that wrist strength plays a major role in golf swing performance, especially the wrist strength in high-speed rotation. Simulations study indicate that wrist strength is more crucial for improving the clubhead speed at impact than are shoulder and elbow strengths. For wrist release timing, simulations showed that for certain increases in wrist and elbow strength, a later wrist release timing may benefit the clubhead speed at impact. With increased shoulder strength, later wrist release may not be necessary. It seems that substantial delay in wrist release is not the only way to improve performance, but that the joint strength profile is also important. Furthermore, the strength at high speeds is crucial to performance, but may be difficult to achieve because of limitations on muscle activation. While these observations are based on a model representing only a single swinging arm, the general principles seem to be very appropriate for application to real, two-arm golf swings.
References
Budney, D. R. and Bellow, D.G. (1979) Dynamic model for the golf swing. In Terauds: Del Mar, Ca., Academic Publishers, 1979, pp.1973-1920. International Congress of Sports Sciences, Edmonton, 1978.
Campbell, K. R. and Reid, R. E. (1985) The application of optimal control theory to simplified models of complex human motions: the golf swing. In:D.A. (ed.) et al., Biomechanics IX-B, Champaign, Ill., Human Kinetics Publishers, pp.1527-1532. Congress of Biomechanics. Cochran A. and Stobbs, J. (1968) The search for the perfect swing. Grass Valley: the Booklegger,
pp. 8-147.
Jorgensen, T. P. (1970) On the dynamics of the swing of a golf club. Am. J. of Physics,
38,5,644-651.
Kane, R. T. and Levnson, A. T. (1985) Dynamics: Theory and Applications: McGraw-Hill.
Kaneko Y. and Sato, F. (1993) The optimization of golf swing and its application to the golfclub design. In:XIVth Congress, Paris, 4-8 July, 1993, vol. I, Paris, pp.1652-1653.
Lampsa, M. A. (1975) Maximizing Distance of the golf drive:an opitmal control study. J. of Dynamic Systems, Measurement, and Control,362-367.
Mason, B. R., Megann, B. and Herbert, R. (1996) Biomechanical golf swing analysis. In: International Society for Biomechanics, XIII International symposium for biomechanics in sport: proceedings. Lakehead University, Thunder Bay, Ontario, Canada, July 18-22, 1995, pp. 67-70. (Bauer T, ed).
McLaughlin, P. A. and Best, R. J. (1994) Three-dimenstional kinematic analysis of the golf swing. In: Science and golf II: proceedings of the 1994 World Scientific Congress of Golf (Cochran AJ, Farrally FR, eds), pp. 91-96. London: E & FN Spon.
Nagao, N., Sawada, Y. (1977) Kinematic analysis of the golf swing by means of fast motion picture in connection with wrist action. J. of Sports Med. and Physical Fitness 17,413-419.
Pink, M., Jobe, F. W. and Perry, J. (1990) Electromyographic analysis of the shoulder during the golf swing. Am. J. of Sports Med. 18,137-140.
Pink, M., Perry, J.and Jobe, F. W. (1993) Electromyographic analysis of the trunk in golfers. Am. J. of Sports Med. 21,385-388.
Soriano, B. C. (1997) A biomechanical investigation of human movement during the golf swing. University Microfilms International Ann Arbor.
Tang, W. -T. (2002): Relationships among arm strength, wrist release, and joint torques during golf downswing. Dissertation, The University of Texas at Austin.
Watkins, R. G., Uppal, G. S., Perry, J., Pink, M. and Dinsay, J. M. (1996) Dynamic electromyographic analysis of trunk musculature in professional golfers. Am. J. of Sports Med. 24,535-538.