國立臺灣大學理學院化學系 碩士論文
Department of Chemistry College of Science
National Taiwan University Master Thesis
史特拉底瓦里與義大利歷史小提琴的分析比較:
從材料化學與結構設計到發聲性質
Comparison of Stradivari and old Italian violins:
from material chemistry and construction design to voice quality
沈晏平 Yen-Ping Shen
指導教授:戴桓青 博士
誌謝
研究的時間很快得就過去了,相較於歷史名琴所流傳的時日,自己的這段 學術經歷更顯得如夢如幻,相當不真實,聽著各把名琴的聲音,歲月似乎就停 滯了……
奇美博物館的數位典藏計畫說道:一把名琴,牽起了素昧平生的製琴師與 演奏家、甚或繫起了百年後的演奏家與蒐藏家。我何其有幸,能見證小提琴的 歷史發展。十六世紀中旬,義大利北部人阿瑪第發明現代小提琴,他的家族與 學徒在兩百年後皆致力於小提琴的發展,突破了人類對音樂的理解。十九世紀 初期,義大利北部人塔瑞西歐徒步至巴黎,將義北的歷史名琴推廣至全歐洲,
而後各地的藏琴師們,投盡資產傾盡歲月的搜集名琴,保存與傳承那些超越三 百年歲數的文化瑰寶,自西元一九九零年起,奇美博物館加入了名琴收藏的行 列,因此,我才能有緣分邂逅這些瑰寶。現代,美國的畢辛吉爾與納吉瓦里教 授,投入了三十年的光陰,發展各種技術量測小提琴的震動,使人類對於音樂 物理的認識更加邁進,在戴桓青教授的帶領下,我有幸能一窺提琴研究的奧 妙,在這領域中成長學習。人類能不斷成長,正是因為許多人們不斷地做著自 己喜愛的事,樂而不能止,三月而不知肉味,不為名利矇蔽雙眼,不被人類經 驗束縛,不知不覺間,就將人類推向了新的高度。
感謝戴桓青教授提供實驗室的環境使我能夠學習,感謝家人讓我能夠心無 旁鶩的投入,感謝李國乾學長、林哲宏學弟等實驗室夥伴還有社會中各位有心 人士的支持,我才能進行這份研究,期待自己的這份研究,能在往後給予人們 些微的啟發。
中文摘要
小提琴演變的五百年歷史中,在結構設計與聲音特性上,有兩個眾所皆知的 里程碑。第一個里程碑是安德雷亞‧阿瑪蒂(Andrea Amati, 1505-1577)十六世紀初 期在義大利克里蒙納小鎮(Cremona)所發明的現代小提琴。爾後有許多制琴師嘗 試改變阿瑪蒂的結構設計,但都在聲音特性上調整失敗,因此小提琴的結構設計 並未有太大的演變。第二個里程碑是安東尼奧‧史特拉底瓦里(Antonio Stradivari, 1644-1737)在十八世紀初期的成就,史特拉底瓦里師承阿瑪蒂家族,微調其結構 設計並改進聲音特性。過去兩個世紀中,許多著名的獨奏家獨鍾於演奏史特拉底 瓦里的小提琴,而相較其餘製琴師,史特拉底瓦里小提琴的構型也最常被模仿。
然而,從阿瑪蒂至史特拉底瓦里的演進之路上,其幾何結構的演變雖然容易量測,
其聲學性質的變化卻仍未被定義。
我們錄製了由阿瑪蒂至史特拉底瓦里時代間的十五把義大利歷史小提琴,以 及男女聲的半音階。並利用線性預測編碼方法進行泛音特徵的比對。本實驗的義 大利小提琴中,兩把最早的典型(1570 Andrea Amati 與 1560 Gasparo da Salo)都在 5000 赫茲以下呈現出四個類似人聲的共振峰(F1-F4),其 F1 與 F2 對應到國際音 標元音圖(IPA vowel diagram)的中央區域,F3 與 F4 則對應於男性的歌唱。因此,
小提琴的發明者們,極可能是藉由模仿男性歌唱的聲音而達到了第一個里程碑。
從 F1 至 F4,相較共振峰類似男中音/男低音的其餘歷史小提琴,史特拉底瓦里 都呈現了更高的頻率,更類似於男高音/女低音。在國際音標元音圖中,升高的 F1 與 F2 會產生更開放與更前端的元音,使得元音聽起來更明亮更渾厚,這些獨特 的元音與性別特徵符合幾世紀來人們對其不同尋常的經驗感受。傳統上,人們將 阿瑪蒂至史特拉底瓦里間的聲音轉變歸因於後者較小的木板曲度,但近來的證據 顯示,木材的化學處理也可能造成其特性的轉變。
關鍵字:小提琴、阿瑪蒂、史特拉底瓦里、線性預測編碼、人聲、泛音
ABSTRACT
During the evolution of violin models over the past 500 years, there were two
widely recognized design/acoustic landmarks. The first landmark was the invention of
the modern violin in the early 16th century by Andrea Amati (1505-1577) in Cremona,
Italy. The shape and form of the violin have evolved very little since, as numerous later
attempts to alter Amati’s basic design have failed to maintain the favorable acoustic
qualities. The second landmark was achieved by Antonio Stradivari (1644-1737) in the
early 18th century, who learned his craft from the Amati family but made slight
modifications to improve the acoustics. For the past two centuries, more famous soloists
have preferred to play Stradivari violins than all other makers combined. Stradivari’s
violin models are also copied more frequently than any other violin maker. While the
geometric evolution from Amati to Stradivari models are easily measurable, the
underlying acoustic properties that help define these two landmark designs remain
unknown.
In this study, we recorded the chromatic scales of 15 old Italian violins, ranging
from Amati to Stradivari, as well as male and female singing voices. The linear
showed four voice-like formants (F1-F4) below 5000 Hz. The F1 and F2 values in these
early violins mapped to the central region on the international phonetic alphabet (IPA)
vowel diagram, while their F3 and F4 values corresponded to those of male singing.
Therefore, the first landmark design devised by the early inventors of the violin
appeared to mimic the male singing voice.
Compared to other old Italian violins of which formants were similar to
basses/baritones, in F1 through F4, Stradivari violins exhibited higher formant
frequencies which were similar to tenors/altos. In the IPA vowel diagram, elevated F1
and F2 led to the lower vowel height and the more front vowel, shifting toward the
brighter and bigger symbolism. The unique vowel and gender qualities associated with
Stradivari violins appeared to correlate well with long-held opinions about their
distinctive brilliance. The tonal improvement going from Amati to Stradivari violins
has been historically attributed to lower plate arching in the latter,1 but recent evidence
also suggested that chemical treatment of wood may have altered its material
properties.2
CONTENTS
中文摘要 ... i
ABSTRACT ... ii
CONTENTS ... iv
LIST OF FIGURES ... v
LIST OF TABLES ... vii
LIST OF APPENDIX ... vii
Chapter 1 Introductions ... 1
1.1. The history of old Italian violins ... 1
1.2. The collection of old Italian violins ... 5
1.3. The manufacture of violins ... 9
1.4. The acoustics of violins ... 11
1.5. The acoustics of vocals in comparison with violins ... 21
1.6. Rationale and research aim ... 29
Chapter 2 Experiment Methods ... 30
2.1. Sound Recording ... 30
2.1.1. Violin recordings ... 30
2.1.2. Vocal recordings ... 33
2.2. Analytical Methods ... 34
2.2.1. Frequency response analysis ... 34
2.2.2. Formants analysis... 37
2.2.3. Formants to vowel diagram mapping ... 39
Chapter 3 Results ... 40
3.1. The acoustic features of the origin violins ... 40
3.1.1. Frequency response ... 40
3.1.2. Similarities with vocals ... 44
3.1.3. Vowel qualities ... 47
3.1.4. Gender qualities ... 50
3.2. The acoustic features of the Strad violins ... 54
3.2.1. Frequency response ... 54
3.2.2. Similarities with vocals ... 56
The elevated formants are affected by the top plate. ... 67
Chemistry of the top plate should be considered. ... 70
Factors that enhance the elasticity of the top plate. ... 73
Chapter 5 Conclusions ... 76
Reference ... 78
Appendix ... 84
LIST OF FIGURES
Figure 1- 1. The position of Brescia and Cremona. ... 2Figure 1- 2. The relationship of the Brescian and Cremona school. ... 3
Figure 1- 3. The violin pictures. ... 8
Figure 1- 4. Making the top plate from pine or spruce. ... 9
Figure 1- 5. The diagram of the violin components. ... 10
Figure 1- 6. Summary schema for “building” violin radiative profile. ... 12
Figure 1- 7. The signature modes. ... 13
Figure 1- 8. Sketches of the resonances of the bridge. ... 14
Figure 1- 9. The vibration of the islands. ... 16
Figure 1- 10. Impedance ratio of bridge to island. ... 16
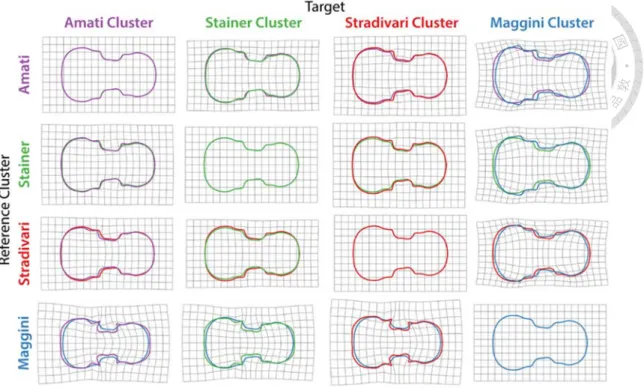
Figure 1- 11. Hierarchical clustering of violin shape. ... 18
Figure 1- 12. Thin plate splines of major violin clusters. ... 19
Figure 1- 13. Time series of changes in radiated power and f-hole length. ... 20
Figure 1- 14. Representative images of the vocal fold vibration. ... 22
Figure 1- 15. Schematic diagram describing the production of vocal. ... 23
Figure 1- 16. The IPA vowel chart. ... 25
Figure 1- 17. The formants of Viotti Strad violin analyzed by LPC method. ... 27
Figure 1- 18. The notes of “Ole Bull” Guarneri violin in the vowel chart. ... 27
Figure 1- 19. Vowel quality of Guarneri del Gesù and Stradivari violins. ... 28
Figure 2- 1. Violin fingering chart. ... 31
Figure 2- 2. The top view of microphone recording setups. ... 32
Figure 2- 3. The interface and the tool bar of Audacity. ... 35
Figure 2- 4. The interface and the parameters in “Plot Spectrum”. ... 35
Figure 2- 5. The example of the formant analysis of vocals in Praat. ... 38
Figure 3- 1. The example of the frequency response curves of singing. ... 41
Figure 3- 2. The example of how to define the formant of violins from the frequency response... 43
Figure 3- 3. The illustration of the LPC method on vocals and violins. ... 45
Figure 3- 4. Vowel qualities of the Amati and the da Salo. ... 48
Figure 3- 5. F3 and F4 distributions of the Amati and the da Salo. ... 51
Figure 3- 6. Frequency response comparisons between Strad and non-Strad violins. 55 Figure 3- 7. Formant comparisons in each musical note between Strad and non-Strad violins. ... 58
Figure 3- 8. Formant comparisons in an octave between Strad and non-Strad violins. ... 59
Figure 3- 9. Vowel quality comparisons between Strad and non-Strad violins. ... 61
Figure 3- 10. F3 and F4 distribution comparisons between Strad and non-Strad violins. ... 63
Figure 3- 11. Vocal tract length estimates for males vs. females, and Strad vs. non- Strad violins. ... 64
Figure 4- 1. X-ray image of a Guadagnini violin. ... 66
Figure 4- 2. The scheme of the island area. ... 68
Figure 4- 3. Three principal axes of wood. ... 69
Figure 4- 4. The structure of cellulose. ... 72
Figure 4- 5. Spatial arrangement of the matrix and the cellulose microfibrils. ... 72
LIST OF TABLES
Table 1- 1 The formants of 10 basic vowels in English from Childers. ... 24
Table 1- 2 The formants of 12 basic vowels in English from Hillenbrand. ... 24
Table 2- 1. 15 old Italian violins we recorded. ... 30
Table 3- 1. The formants of the Amati and the da Salo comparisons with vocals. ... 46
Table 3- 2. The formants of Strad and non-Strad violins comparisons with vocals. ... 56
LIST OF APPENDIX
Appendix- 1. The coordinate values of sung vowels on the IPA vowel chart. ... 84Appendix- 2. Comparison of spoken and sung vowels we recorded. ... 84
Appendix- 3. The coordinate values of the Amati and the da Salo on the IPA vowel chart... 85
Appendix- 4. The F3 and F4 values of sung vowels. ... 85
Appendix- 5. The F3 and F4 values of the Amati and the da Salo. ... 85
Appendix- 6. The mean F1 to F4 values of the recoded antique violins. ... 86
Appendix- 7. The coordinate values of the recoded antique violins on the IPA vowel chart... 87
Appendix- 8. The F3 and F4 values of the recoded antique violins ... 88
Chapter 1 Introductions
1.1. The history of old Italian violins
The ideas for inventing violins may be borrowed from the early string instrument,
such as rebecs, lutes and vielles. One of the earliest descriptions of the violins was from
the Epitome musical by Jambe de Fer, published in Lyon in 1556.3 Besides, it was said
that the French king Charles Ⅸ ordered Andrea Amati to make 24 violins for him in
1560.4 By these two descriptions above, we suggested that violins had already begun to
spread through Europe since the middle of the 16th century.
In 1505, Andrea Amati was born in Cremona, Italy.5-7 He was a luthier who began
making the three-stringed bowed instruments. Because of creating the first four-
stringed violins in 1542, he was credited for the inventor of modern violins. Andrea
Amati only taught his two sons, Antonio Amati and Girolamo Amati, about the skills
of making violins. In Cremona, the knowledge of making violins was only passed
through the Amati family until the grandson of Andrea Amati, Nicolo Amati, took
outside apprentices.
Near Cremona, there was a town called Brescia(Figure 1- 1). In this town, there
was a prestigious violin maker named Gasparo da Salo. He was born in 1542 and 37
years younger than Andrea Amati.8-9 He grew in a family which was famous for playing
and making string instruments. Although we didn’t know how he learned to make the
violins, he was referred as a violin master as early as 1568.10 His violins were
wonderfully decorated, and some of the patterns could be seen in the violins made by
Antonio Stradivari. Gasparo da Salo developed the Brescian school and the master
luthier, Giovanni Paolo Maggini was also his student. Hence, the Brescian and Cremona
school were regarded as two of the earliest schools which made violins.
Back to the Cremona school, when the famine and the plague decimated Cremona
in 1630, Nicolo Amati was the only survivor in the Amati family.11 He had no
immediate heirs and took on apprentices outside the family, and it made the Guarneri
and Stradivari family rise a few decades later. We listed the relationship of important
Cremona and Brescian luthiers(Figure 1- 2). All the violins we recorded in this thesis
were made by these masters.
In 1641, Andrea Guarneri was living with Nicolo Amati and being instructed in
the art of violin making, probably working with Francesco Ruggeri and Antonio
Stradivari who were also apprentices at the same time.12 The earliest Andrea Guarneri
violins unsurprisingly closely resembled the Amati style. Later in his life, he developed
his own style in not only the structure of the violins but also the varnish.13 He then
passed on these techniques to his descendants. His grandson, Giuseppe Guarneri who
was known as del Gesù, was regarded as one of the most brilliant luthiers in history.
Due to these fantastic violins that the Guarneri family made, their reputation was as
high as the Amati family who invented the violins.
One of the other apprentices of Nicolo Amati, Antonio Stradivari, brought together
his decades of experimentation, combing the powerful tone of the Brescian instruments
with the clear sweet sound of the Cremonese.14 Because of that, he was also regarded
as one of the most brilliant luthiers in history, equaled only by Guarneri del Gesù. In
the minds of most violinists and the connoisseurs, the best violins they have ever heard
were made by either del Gesù or Stradivari. At the mention of the Cremona school,
people immediately thought of these three great families: Amati, Guarneri and
Stradivari.
1.2. The collection of old Italian violins
No matter how brilliant these old Italian violins were, people would not know their
beauty if no one preserved and collected these treasures. Count Cozio di Salabue (1755-
1840) was the first great connoisseur and collector of violins.15 His father owned a
Nicolo Amati violin dated 1688.14 It may cultivate his enthusiasm about rescuing the
violin art from declining. Cozio was the patron of the violin maker, Giuseppe
Guadagnini, who settled in Turin in 1771.15 He systematically tracked down all the
existing Stradivari violins from all over northern Italy. In his collection, the most
important instruments were ten violins of Antonio Stradivari. Although he kept those
he considered the most valuable, he still had to sold some of the instruments to maintain
his silk merchant’s shop in Turin. The old Italian violins could be repaired and
preserved well due to the efforts of Cozio.
When Cozio died in 1840, Luigi Tarisio (1755-1854) acquired all his treasures.14
Encouraged by his family in Milan and his violin teacher who owned a Stradivari violin,
Luigi Tarisio was determined to collect the Cremona violins when he was young. He
had tried to find the old Italian violins since 1809, and had made the people in Europe
from Tarisio. Soon after, Aldric invited his friends and colleagues, including George
Chanot, Charles Francois Gand and Jean Baptiste Vuillaume, to admire these treasures.
Therefore, the greatest authorities on violins among Europe at that time all knew the
value of old Italian violins. It encouraged Tarisio to keep up his work until he died in
1855, and all his collection were bought by Vuillaume.
In brief, Cozio was the pioneer to find and collect old Italian violins. Tarisio
continued Cozio’s work and made the value of the old Italian violins known to all
Europe. If without their efforts, these violins could not be preserved and could not be
appreciated now.
In our study, the violins we recorded were all borrowed from Chi-Mei Museum.
Chi-Mei Museum has been collecting the historic violins since 1990. At that time, Wen-
Lung Hsu, the founder of Chi-Mei, bought the first Stradivari violin, Dushkin, from
Chao-Liang Lin, a famous Taiwanese violinist. Dushkin was made by Antonio
Stradivari in 1707. It was named after the owner, Samuel Dushkin (1891-1976), who
collected it in the beginning of the 20th century. Then, it was sold to England where
Chao-Liang Lin found it. Fortunately, Dushkin became the first Stradivari violin
collected in Taiwan.
The Chimei collection has now over 1000 antique string instruments, arguably the
largest in the world, including 5 violins made by Antonio Stradivari and 1 violin made
by Giuseppe Guarneri.
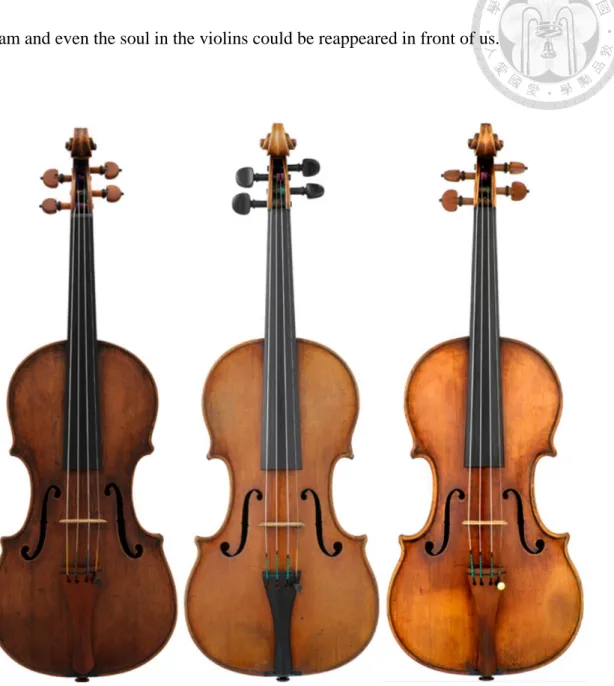
Each historic violin has its own story. We chose two of the violins we recorded as
example, one was Stradivari Elman (1722) and the other was Gasparo da Salo (1560).
Elman had the richest historical meanings in our violins. Joseph Joachim, born in
Hungary, regarded as one of the most significant violinists of the 19th century, once
owned this violin. Passed through some dealers, this violin had been owned by Mischa
Elman for around 40 years. That was why this violin was named Elman. From 1981 to
1991, Josef Suk, a Czech violinist, owned this violin. Finally, Elman has been collected
by Chi-Mei since 1991.
Gasparo da Salo (1560) was the oldest violin in our recordings. There was an
original mark which was carved the completion date in the interior. The violinist who
had owned this violin until 1968 was Leslie Browne in London. The next owner was
Homi Kanga, who was the most remarkable western musicians came out of India. After
Homi Kanga retired, Chi-Mei has collected this violin until now.
of makers, the preserving of collectors and the playing of violinists. Therefore, the
dream and even the soul in the violins could be reappeared in front of us.
Figure 1- 3. The violin pictures.
Left: Gasparo da Salo (1560). Center: Dushkin. Right: Elman.
The pictures were from Chi-Mei <http://db.dacm.ntnu.edu.tw/Chimei/tw/index.html>.
1.3. The manufacture of violins
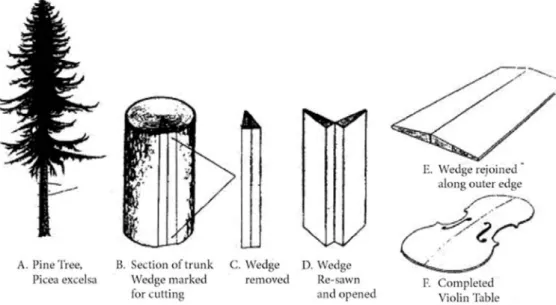
For hundreds of years, the boards for manufacturing violin have been from spruce
or maple. The plate of violin is cut from one board, which is then sawed in the
middle(Figure 1- 4).16
Figure 1- 4. Making the top plate from pine or spruce.
This figure is adopted from Wali et al., 2010.16
The basic components of a violin are shown in Figure 1- 5.17 The resonant chamber
is composed of the top plate made of spruce, the back plate made of maple, and the ribs
which hold the two plates together. The air goes in and out the chamber from the two f-
holes on the top plate. Inside the chamber, there are two components which influence
the vibration of the plates and the air. One is the bassbar which is a wooden piece along
connects the chamber and the four strings. The tailpiece and the neck are at the two
ends of the fingerboard. The neck is attached to the peg box and ends in a scroll. Besides,
to help our discussing below, we define a special part of top plate as island. The island
is beneath the two bridge feet and between the two f-holes. This region is related to the
vibration of high frequency.
1.4. The acoustics of violins
There are four strings in a violin. The musical notes of the four open strings are
G3, D4, A4 and E5 respectively. The range of the violin pitch is from G3 to E7. When
we play the violin, the string produces the fundamental frequency and many related
harmonic frequencies. The sting transmits the vibrations to the bridge, then to the
chamber and finally to the air which we hear of. The bridge and the chamber would
enhance the intensity of several specific harmonics if these harmonics match the
vibration modes on them. On the other hand, the intensity of several specific harmonics
would be weakened if these harmonics are correspondent to the forbidden mode of them.
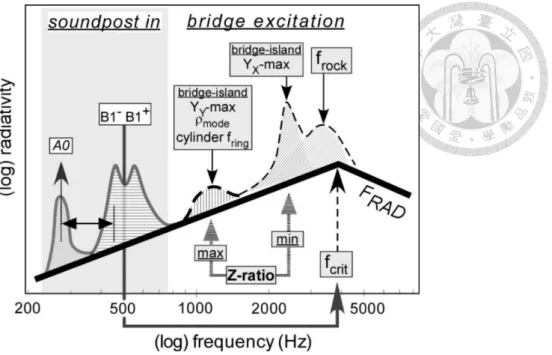
Bissinger associated the enhanced frequency bands to the violin structure (Figure 1-
6).18 This figure is a combination of several different experimental methods, because
the influence of different violin structures can only be observed in different experiments.
Figure 1- 6. Summary schema for “building” violin radiative profile.
A0: the air mode, produced by the resonance of the violin plates. B1- and B1+: the baseball modes, produced by the resonance of the violin plates. bridge-island: the resonance produced by the bridge and
the island. f rock: the rocking mode, produce by resonance of the bridge.18
There are two bands related to the chamber in the frequency ranging from 200 to
800 Hz. Bissinger used the modal analysis to observe these three modes, A0, B1- and
B1+, which are called the signature modes. In this method, a hammer is used to hit the
bridge corner, and the mechanical response of the violin plates could be measured.19
Each violin has a unique set of signature modes. Many researchers also proved it and
explained it well. A0 is called the air mode and is produced by the resonance of violin
plates and the air in the violin body. If we suppose the string is pulled to the right. The
left foot of the bridge goes up, and the bassbar transmits the force to the top plate. The
right foot of the bridge goes down, and the soundpost transmits the force to the back
plate. At this time, the top moves up, and the back moves down. It expands the chamber
left, and the air flows out. In this kind of motion, the f-holes acts as the nose of the
violin, and this is why the motion is called the breathing mode. B1- and B1+ are called
the baseball modes, because of the shape of the nodal lines. These modes are produced
by the resonance of the violin plates. In the previous research, there have two characters,
the bending and the breathing mode, with opposite phases.20 The sum and difference
combination cause the B1- and B1+ modes respectively. In Figure 1- 7, the left pair
shows the top and the back plate measurements while the right pair shows simplified
finite element computations.21 The two patterns are close to each other, proving the
correct explanation of signature modes. In brief, the signature modes were mainly
influenced by the vibration of the violin chamber.
In Figure 1- 6, the resonance bands from 800-5000 Hz are mainly influenced by
the bridge and the islands in the frequency. Although the full explanation of this
frequency range is complicated and nuanced, that the resonance of the bridge leads to
this feature is not controversial.22 As noted earlier, the soundpost is not directly linked
to the right foot of the bridge but slightly displaced from it. Besides, in this frequency
range, the inertia of the soundpost and the back plate become significant enough to
reduce the vibration. Therefore, the soundpost can be seen to be stationary and acts as
a fulcrum to allow a teeter-totter motion of the bridge and the top plate. This motion is
called the rocking mode and assigned around 3500 Hz in Figure 1- 6. Several possible
modes of bridge rocking have been proposed in Figure 1- 8.23
Figure 1- 8. Sketches of the resonances of the bridge.
This figure is adopted from Bissinger et al., 2006.23
Besides, Bissinger used zero-mass-loading laser scans to analyze the mechanical
response of the islands, finding that there was a vibration peak around 1200 Hz in the
Y-direction (perpendicular to the violin plate) and a vibration peak around 2500 Hz in
the X-direction (across the violin) (Figure 1- 9).24 Compared with the bridge vibration,
when the energy is transferred from the bridge to the island, Bissinger found stronger
vibration on the island than on the bridge. It suggested some excitation due to the X
motion of the island happened (Figure 1- 10).24 Hence, he assigned the band in 2500
Hz which was traditionally called bridge-hill (BH) as the bridge-island peak.
Finally, Bissinger used the far-field radiativity scans in an anechoic chamber to measure
the pressure response. Compared with the total mechanical response of the violin, he
obtained a parameter, the fraction of the vibrational energy radiated (FRAD), finding
that the most effective frequency was related to B1 mode.18
Figure 1- 9. The vibration of the islands.
Cross: X-direction. Triangle: Y-direction (perpendicular to the violin plate). Circle: Z-direction.24
Figure 1- 10. Impedance ratio of bridge to island.
Cross square: X-direction. Solid square: Y-direction. BH is the abbreviation of bridge hill.24
Based on the works of Bissinger, the knowledge of the violin acoustics is extended
far, Then, people want to know how the acoustics evolved and what is the relation
between the acoustics and the construction design or the material chemistry.
To get the answers, we go back to the time when the violin was created. After the
invention of the modern violin by Andrea Amati, the shape and form of violins has been
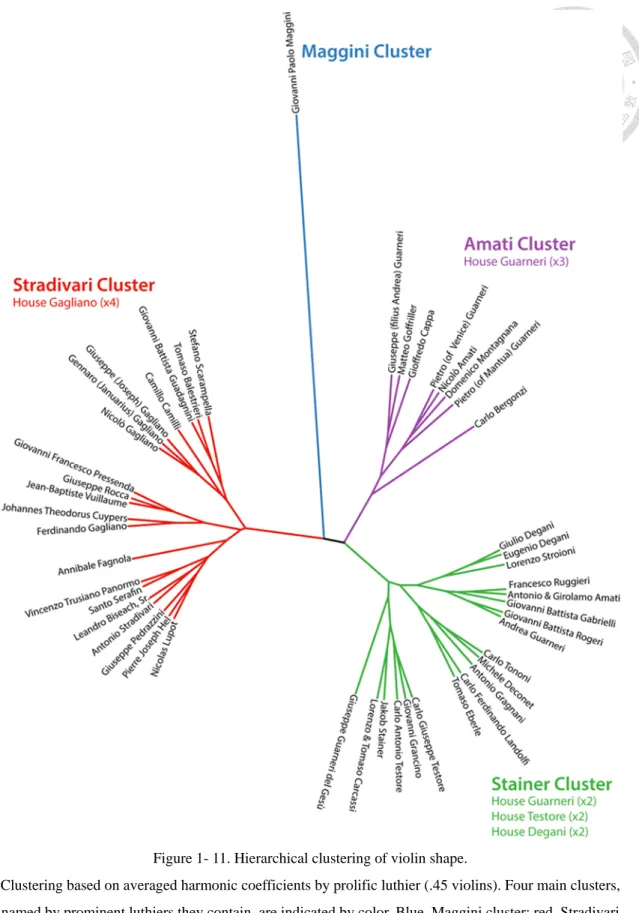
almost fixed. As time went on, the shape had evolved little. Chitwood used linear
discriminant analysis to study more than 7,000 violins. He separated luthiers by the
shape attributes and made hierarchical clustering (Figure 1- 11).25 The four major
groups have been visualized (Figure 1- 12).25 Nevertheless, as the saying of Chitwood,
the acoustics of violins are little influenced by the body shape, compared to other traits,
such as arching patterns, thickness distribution, and wood properties. The body shape
may be more influenced by the personal styles and the customer demands.
Figure 1- 11. Hierarchical clustering of violin shape.
Clustering based on averaged harmonic coefficients by prolific luthier (.45 violins). Four main clusters, named by prominent luthiers they contain, are indicated by color. Blue, Maggini cluster; red, Stradivari
cluster; purple, Amati cluster; green, Stainer cluster.25
Figure 1- 12. Thin plate splines of major violin clusters.
Thin plate splines, deforming grids to transform violins from members of reference clusters (vertical) with those of targets (horizontal), are provided.25
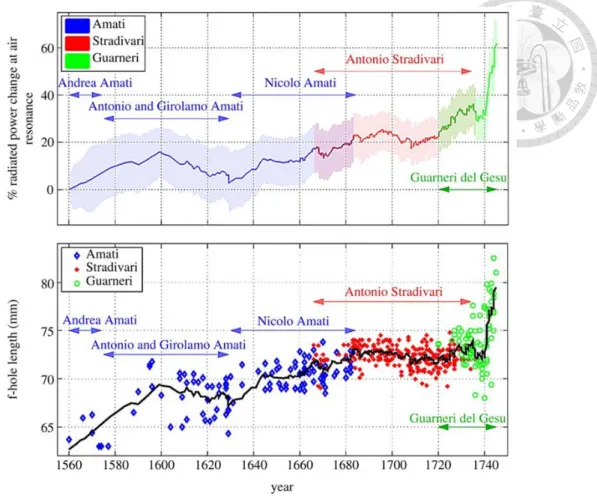
On the other hand, Alam tried to connect the structure evolution to the acoustic
evolution. After measuring the f-holes of 470 Cremonese violins, he found that the
elongation of the f-hole length was correspondent to enhanced radiated power for the
air resonance (Figure 1- 13).26 Interestingly, the violins made by Stradivari have both
longer f-holes and stronger air resonance than the violins made by Amati.
Figure 1- 13. Time series of changes in radiated power and f-hole length.
The upper:The solid line is the total radiated acoustic air-resonance power. Colored shaded patches represents the standard deviations. The lower: The colored markers are the f-holes measured
from 470 Cremonese violins. The black line represents 10-instrument running average.26
However, the acoustic evolution is still not clear and there are still many
unanswered questions. Some of the important questions are why the sound of some
violins are better than the others, and why many soloists prefer to play Stradivari violins.
The answers are hard to be found because the frequency response of the different violins
often look similar to one another. It made us start to think of how to use other methods
to analyze the frequency response and resonance properties, how to see all the peaks
Bissinger suggested in a single experiment, and how to simulate the perception in our
1.5. The acoustics of vocals in comparison with violins
There was an old notion that the violin could sing. Francesco Geminiani, a famous
Italian violinist from the Baroque period, stated that the ideal violin tone should “rival
the most perfect human voice” in 1751.27
In most cases, the vocal range of all the males is from E2 to A4 and all the females
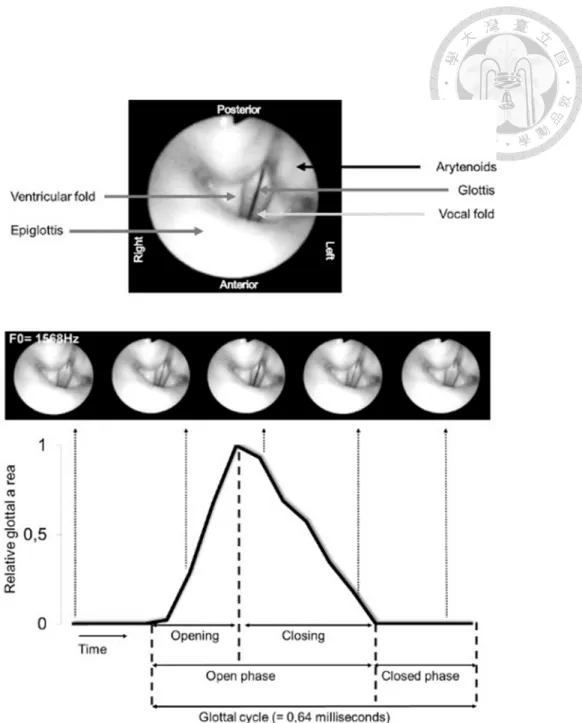
is from F3 to C6. The organs and the tissues used to produce voice could be seen in
Figure 1- 14.28 In the larynx, the muscles controlled by the vagus nerve adjust the
tension of the vocal folds and the opening of the glottis, influencing the fundamental
frequency. To oscillate, the vocal folds are brought near enough together, so the air
pressure builds up beneath the larynx. The folds are then pushed apart by this increased
subglottal pressure.29 It causes an energy transfer from the airflow to the fold tissues.
Under the right condition, the energy transferred to the folds is large enough to
overcome losses by dissipation and the oscillation pattern would sustain itself.30
Figure 1- 14. Representative images of the vocal fold vibration.
The pictures refer to the voice production of soprano at a fundamental frequency of G6 (1568 Hz). The laryngoscopic view represents one glottal cycle in relation to a glottal area waveform.28
After the glottal excitation, the oscillated airflow composed of the fundamental
and related harmonic frequencies goes from the glottis to the vocal tract. The vocal tract
has the similar function to the violin bridge and chamber. Because of the length, size
and shape, the tract would enhance or weaken the intensity of several specific frequency
bands, and it causes the certain peaks in the frequency response called the formants.
The shorter larynx and vocal tract of females cause the higher fundamental frequency
and formants than males.31-33 The size and the shape of tract are influenced by the
tongue position.34 Passing through the tract, the air flow is modified by the lip and the
human voice can be heard of. All the processes involved in voice production can be
seen in Figure 1- 15.35 This phenomenon can be explained by the source-filter theory,
which is similar to the sound production of the violin.36-37
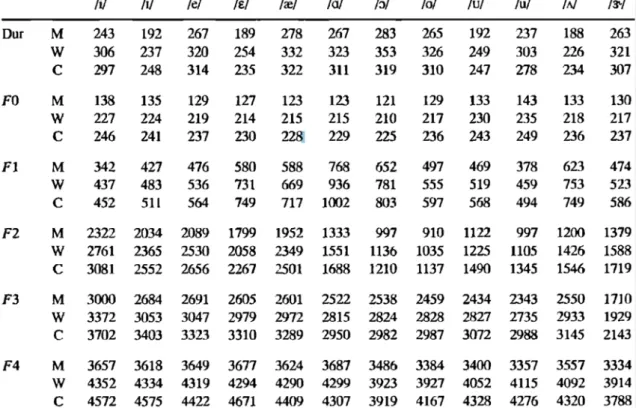
The formant frequencies of English vowels have been studied by Childers in 1991
(Table 1- 1)38 and Hillenbrand in 1995 (Table 1- 2)39. Below 5000 Hz, there are four
formants in the frequency response of vocals.
Table 1- 1 The formants of 10 basic vowels in English from Childers.
Table 1- 2 The formants of 12 basic vowels in English from Hillenbrand.
Among the different vowels, the main differences lie in the first and the second
formant (F1 and F2). Connecting these vowels to International Phonetic Alphabet (IPA)
vowel chart (Figure 1- 16), we can see the relation between the formant and the tongue
position. The lower the tongue, the higher F1. The more forward the tongue, the higher
F2. The third and the fourth formant (F3 and F4) are almost the same except for the
rhotacized vowel.
F1 and F2 of females are a little higher than males, but the formants vary greatly
with different vowels. F3 and F4 were significantly higher than males. Moreover, the
formants of children are more like females. To sum up, F1 and F2 are mostly determined
by vowels, and F3 and F4 are mostly determined by genders.
In 2012, our group used linear predictive coding method (LPC), a common speech
analysis technique, to analyze the sound of violins, finding four formants in violins
(Figure 1- 17).40 However, recalling Figure 1- 6 that Bissinger proposed, there are five
peaks in the frequency response of violins. Comparing the two researches, all the four
formants found by LPC method correspond to the peaks Bissinger proposed. Only A0
mode, the air resonance peak, doesn’t appear in the LPC formant analysis. Hence, LPC
analysis is able to identify four violin formants that resemble voice formants. After our
study, a similar result of LPC method was published by Nagyvary. He also applied a
speech analysis method to map the first and the second violin formants to the IPA vowel
chart (Figure 1- 18),41 connecting the violin sounds to the vocals impressively.
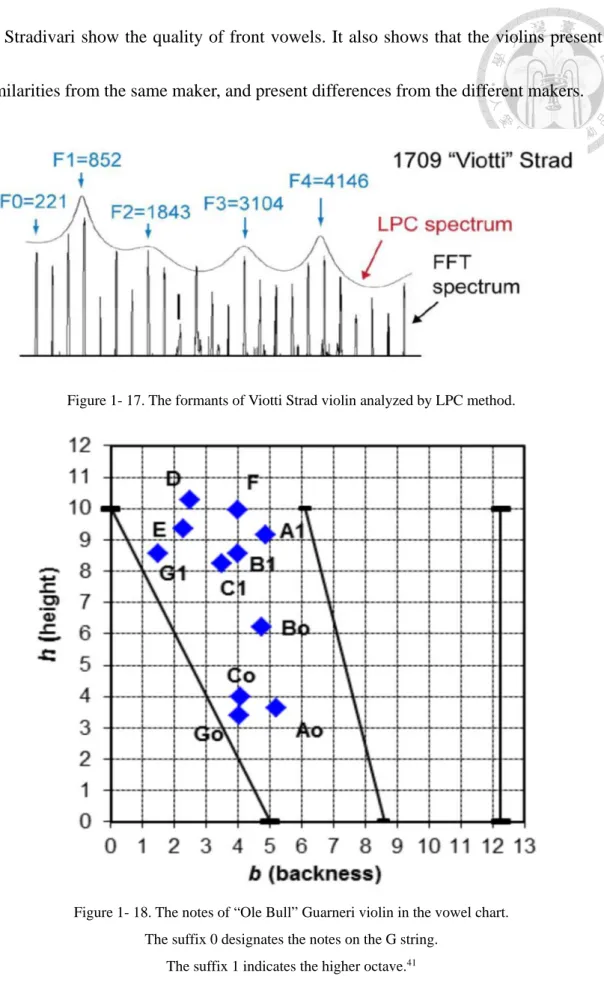
Recently, followed by Nagyvary, Mores modified the LPC formant analysis and
compare the different violins in the aspect of vowel chart. He found that either Guarneri
del Gesù or Antonio Stradivari has his own formant features in the coordinate system
related to the vowel chart (Figure 1- 19).42 This research shows that the violins made
by Stradivari show the quality of front vowels. It also shows that the violins present
similarities from the same maker, and present differences from the different makers.
Figure 1- 17. The formants of Viotti Strad violin analyzed by LPC method.
Figure 1- 19. Vowel quality of Guarneri del Gesù and Stradivari violins.
(a-e) Guarneri del Gesù violins. (f-j) Stradivari violins. Black circles played between G3 and C#4, gray circles played between D4 and G#4, white circles played A4 or above.42
Based on these prior works, the acoustic methods of comparing violins to vocals
have been created and developed. It gives us some clues to finding the secrets in the
1.6. Rationale and research aim
Our group want to prove the old notion that the violins are related to “the most perfect human voice”. We aim to use formant analysis to compare the violin acoustic to vocals. However, in previous literatures, the formants of the vowels were recorded in speech, not singing. This made it difficult to compare the violin formants to the vocals. Hence, we recorded the different vowels in singing. We recorded the notes of both violins and vocals from G#3 to G4 because both males and females can sing in this pitch range which is correspondent to the lowest octave of violins without special training. Within the same pitch range, we aim to compare the violins to the vocals by formant analysis.
To know how the process that the luthiers tried to pursue “the most perfect human voice”, we aim to analyze the evolution of the violin formants. Over the past 500 years, there were two widely recognized acoustic landmarks. The first landmark was the invention of the modern violin in the early 16th century by Amati, and we recorded the 1570 Andrea Amati and 1560 Gasparo da Salo to analyze the origin modern violin. The second landmark was achieved by Antonio Stradivari in the early 18th century, who made some modifications to improve the violin acoustics, and we recorded 6 violins made by Stradivari family to analyze the violin features in this period. Besides, we recorded the other 7 violins which were made between the time of the two landmarks.
By analyzing these 15 violins, we aim to know how the formant evolution is.
In the last part of this research, we discuss the related researches to deduce how
Chapter 2 Experiment Methods
2.1. Sound Recording 2.1.1. Violin recordings
We recorded the scales of 15 old Italian violins (Table 2- 1) during a one-day
session at the recital hall of the old Chi Mei Museum (Tainan, Taiwan) in November,
2011. All instruments were generously loaned by the Chi Mei Museum and set up by
Dai-Ting Chung. Violinist Chu-Hsuan Feng, a graduated of the Paris Conservatory,
used a French bow by Jean Pierre Marie Persoit to play the chromatic scale. Each note
in the scale was played twice consecutively with down bows (~1.5 s) at forte loudness
without vibrato. The fingering chart is showed in Figure 2- 1. The violinist was
informed about the maker before recording each instrument, and was asked to maintain
a consistent bowing style while playing different violins.
Three stereo pairs of microphones were set up on the stage to record the violin
from different angles (Figure 2- 2). Channels 1&2: Avenson STO-2 electret condenser
omnidirectional microphones, in spaced configuration (80 cm apart). Channels 3&4:
Neumann U87 large-diaphragm condenser microphones with cardioid setting, in ORTF
configuration (110°/17 cm). Channels 5&6: Oktava MK-012 with electronics
modifications by Michael Joly, equipped with small-diaphragm cardioid condenser
capsules, in ORTF configuration (110°/17 cm). The microphone preamplifier was a
Sytek MPX-4A for channels 1-4, connected to a Tascam DR-680 digital recorder. The
pre-amplifier/recorder for channels 5&6 was a Tascam HD-P2, with electronics
modifications by Oade Brothers. All channels were digitally recorded at 24 bit/96 kHz
into uncompressed wav files.
Figure 2- 2. The top view of microphone recording setups.
Three stereo microphone pairs were set up in spaced omni-directional (channels 1&2) or Office de Radiodiffusion Television Francaise (ORTF) configurations (channels 3&4, 5&6). Each microphone
was horizontally ~70 cm from the violin bridge, with their heights from the stage floor labeled respectively. All dashed grey lines represent 1 meter.
2.1.2. Vocal recordings
We recorded the scales sung by 16 subjects, including 8 males and 8 females. Their
ages ranged from 16 to 30. They all volunteered to participate in this research, and all
had more than 3 years of music experience in an amateur chorus or an amateur orchestra.
Every subject was asked to read a list containing 8 words, including “had, head, heard,
heed, hod, hoed, hud, who’d”. The vowels in these words were associated with the
symbols “/æ, ɛ, ɝ, i, ɑ, o, ʌ, u/” in International Phonetic Alphabet. Subsequently, the
subjects used their natural voice to sing the chromatic scale (G#3-G4) for each word.
This octave range was chosen because it could be comfortably sung by both male and
female subjects. Before singing each note in the scale, the subjects were made to hear
the sound of the piano which was recorded in advance to ensure they could sing in the
right pitch. In the recording, each note in the scale was sung for 1.0-1.5 sec and was
sung twice consecutively.
An MXL USB.007 stereo cardioid microphone (Segundo, CA), equipped with two
gold diaphragm capsules in X-Y pattern, was placed 20 cm in front of the subject to
make 16 bit/44.1 kHz stereo recordings into uncompressed wav files, recorded by
2.2. Analytical Methods
2.2.1. Frequency response analysis
We imported the violin recordings into Audacity to analyze the frequency response of
each violin and the differences between the Stradivari and the non-Stradivari violins.
In the tool bar of Audacity, there was a built-in function, “Plot Spectrum”, in the column
of “Analyze” (Figure 2- 3). We used this function to run the fast Fourier transform(FFT)
and analyzed the lowest octave which was from G#3 to G4 in each violin. After clicking
in the “Plot Spectrum”, we went into the interface of “Frequency Analysis” (Figure 2-
4). In this interface, there were some parameters that have to be set. We set the algorithm
to the spectrum, set the function to Hamming window and set the axis to the log
frequency. In the analysis of the first formant, the size was set to 2048 (resolution:
46.875 Hz) and the first formant was defined as the strongest frequency between 400
and 900 Hz. In the analysis of the second formant, the size was set to 512 (resolution:
187.5 Hz) and the second formant was defined as the strongest frequency between 900
and 2800 Hz. We could easily define the strongest frequency as the formant because
the software could automatically assign each peak. Then, we exported the data to do
the further analysis.
Figure 2- 3. The interface and the tool bar of Audacity.
We aimed to analyze the difference between the Stradivari and the non-Stradivari
violins, so we were interested in analyzing the frequency response of the two groups
respectively. To normalize each frequency response spectrum, the highest point was set
as 0 dB. The normalized values were exported and connected using the spline method.
We chose this method because we could get the same results as Audacity when finding
the formants of each violin. In this way, we obtained the frequency response of the
Stradivari and the non-Stradivari violin groups.
2.2.2. Formants analysis
Praat is a free software that many researchers use to study human voice. By Praat,
we used the LPC method to identify the formants of vocal and violin recording.
In the voice analysis, we selected a steady-state period of 0.1 sec for each note,
and the formants were computed for this period (Figure 2- 5). Spectrogram, pitch and
formant setting were also important parameters. In spectrogram setting, we used Fourier
method and Hamming window (raised sine-squared) with 0.02 sec time window length.
We set the number of time steps to 1000, the number of frequency steps to 250, the
maximum to 100 dB/Hz, pre-emphasis to 6 dB/oct, and dynamic compression to 0. The
view range was from 50 to 5500 Hz and the dynamic range was 50 dB. In the pitch
setting, we used the autocorrelation method and the range was from 50 to 5500 Hz. We
set the maximum number of candidates to 15, the silence threshold to 0.03, the voicing
threshold to 0.45, the octave cost to 0.01, octave-jump cost to 0.35 and voiced/unvoiced
cost to 0.14. The drawing method was automatic and the view range was from 50 to
5500 Hz. In formant setting, we used Burg method, and set pre-emphasis from 50 Hz.
We set the maximum formant to 5500 Hz, the number of formants to 5, the window
note. Most of the parameters were the same as vocal analysis, except for the pre-
emphasis in the formant setting. We changed the pre-emphasis to 10000 Hz to avoid
interference because violins can project strongly into 7-8 kHz range. After obtaining
the formants from each note, we averaged the formants which were over the same pitch
and the same violin in the six microphones. According to this procedure, we obtained
the first to fourth formants of all the violins that could be compared to the vocals.
Figure 2- 5. The example of the formant analysis of vocals in Praat.
2.2.3. Formants to vowel diagram mapping
To convert our formant data to IPA vowel chart, we used the method which
Pfitzinger developed.43 He measured the pitch (F0), the first formant (F1) and the
second formant (F2) values from the individual vowels. He transformed these values to
an x-y coordinate system where x value was defined as backness (b) and y value was
defined as height (h) by the two empirically derived equations shown below:
𝑏𝑏 = 1.782 × ln(𝐹𝐹1) − 8.617 × ln(𝐹𝐹2) + 58.29 (𝟏𝟏)
ℎ = 3.122 × ln(𝐹𝐹0) − 8.841 × ln(𝐹𝐹1) + 44.16 (𝟐𝟐)
By these two equations, we transformed our vocal data into coordinates which
resemble the IPA vowel chart (Figure 2- 6). In our violin data, after obtaining the
backness and height for each note, we averaged the backness and height which were at
the same pitch and the same violin over the six microphones as before. Hence, we could
connect the violin sounds to the vocals in the aspect of vowel chart.
Chapter 3 Results
3.1. The acoustic features of the origin violins
3.1.1. Frequency response
To compare the violin and the vocal, we record the singing voice by ourselves.
Then, we use FFT methods to check the quality of our records. G4 is the most difficult
to sing for males in our notes because of the high pitch. Hence, we choose this pitch as
our example of the frequency response curves. In all the 16 curves in Figure 3- 1, the
fundamental frequencies are all in around 392 Hz, corresponding to G4, and all the
harmonic frequencies are the multiple of 392 Hz. It proves that the quality of our records
is good enough to do the following analysis.
Figure 3- 1. The example of the frequency response curves of singing.
The curves acquired from the 8 males are in the left column, and the curves acquired from the 8 females are in the right column. All the people were asked to sing [ε], and all the musical note is G4.
Just like the singing voices, we use FFT methods to analyze the frequency response
of the Amati 1570 and the da Salo, which represent the earliest modern violins in our
experiment. Afterward, we try to directly acquire the formants from the frequency
response curves because the formants are some of the most important features that
people use to judge the voice. In Figure 3- 2, it shows the example of how we define
the F1 and the F2. These curves are acquired from the chromatic scales from G#3 to
G4. We find the F1 in the resolution of 46.875 Hz to observe the formant more clearly
below 1000 Hz. On the other hand, we find the F2 in the resolution of 187.5 Hz to
define the formant more easily in the range from 1000 to 3000 Hz. After averaging the
12 notes (6 microphones × 2 times), the F1 and the F2 of Amati is 551 and 1551 Hz,
and the F1 and the F2 of da Salo is 574 and 2214 Hz. However, we find that the
intensities of the different peaks are close to one another, and it is hard to define the
formant, especially the F3 and the F4. Moreover, when the violin is played, we listened
to it in one note at a time. The rationality of analyzing an averaged octave signal should
be questioned. Therefore, we use the LPC method to analyze the formants of the two
violins note by note in the following experiments.
Figure 3- 2. The example of how to define the formant of violins from the frequency response.
3.1.2. Similarities with vocals
The LPC method is used to analyze the formants of both the vocals and violins. In
the bottom half of Figure 3- 3, we show two sets of harmonic series of notes sung by a
male and a female. The amplitude of the two series decrease with rising frequency.
Among the series, some of the frequency bands are attenuated by the vocal tract,
causing the formants. Using the LPC method, we obtain two smooth curves above the
two harmonic series, and we can easily define the position of the first four formant
peaks.
In the top half of Figure 3- 3, there are two sets of harmonic series of violins, the 1570
Amati and 1560 Gasparo da Salo. Interestingly, the shape of the two smooth curves
obtained by LPC method is similar to the vocal curves. The most important feature is
the fact that all the four formant frequencies are close to these of the vocals.
Figure 3- 3. The illustration of the LPC method on vocals and violins.
The musical note is B3. In each frame, there are one sets of harmonic series acquired by the FFT method and one smooth curve acquired by the LPC method.
We find that musical note has limited influence on the frequency of the formants.
In Table 3- 1, each formant of the vocals is the average of the 192 notes (8 people × 12
musical notes × 2 times). Considering all vowels, the frequency of F1 is from 418 to
803 Hz, F2 is from 995 to 2298 Hz, F3 is from 2207 to 3034 Hz and F4 is from 3501
to 4290 Hz. On the other hand, each formant of the violins is the average of the 144
notes (6 microphones × 12 musical notes × 2 times), and all the averages are in the
frequency range of the corresponding vocal formant.
Table 3- 1. The formants of the Amati and the da Salo comparisons with vocals.
3.1.3. Vowel qualities
Studies have previously shown that humans produce different vowels mainly by
altering F1 and F2 frequencies with different mouth shapes and tongue positions.
Besides, both F1 and F2 are affected by F0 in speech and singing.44 To analyze the
recorded sung vowels, we converted them to the IPA vowel chart by Pfitzinger’s method.
In the equation (1) and (2), F1 is the main influence on the vowel height and F2 is the
main influence on the vowel backness. After the transition, all the sung vowels
correspond correctly to the IPA vowel chart (Figure 3- 4 b). Although [ʌ] and [ɑ] are a
little more forward due to the deformation of the tongue position when singing, the
relative relationship of all the vowels is still correct. In the same vowel, the tongue
position of each person is still a little different from each other because of different
pronunciation and singing habits. It causes the tongue positions to show a spread of
distribution. All the values of the average and the standard deviation can be seen in
Appendix- 1. Besides, after the transition, all the formants in Table 1- 1 and Table 1- 2
are also consistent to the vowel chart we recorded (Appendix- 2).
Figure 3- 4. Vowel qualities of the Amati and the da Salo.
(a) Vowel backness and height of each violin note from G#3 to G4. (b) The mean backness and height of each violin are represented by the position of the IPA vowel symbol. The centers of each ellipse are the mean backness and height of the 8 males and the 8 females we recorded. The lengths and widths of each ellipse represent the standard deviations. The average values of each violin are represented by
colored shapes, and the vertical and horizontal whiskers represent the standard deviations.
In Figure 3- 4 a, the individual violin notes are scattered over different positions,
but every note falls in the region of the vowel chart (Appendix- 3). In terms of vowel
backness, the notes concentrate in the central part. Both the Amati and da Salo violin
show similar trends with the rising pitch. From note G to #C, the notes are all lower
than 7.95 in vowel height. From note D to #F, the notes are all higher than 7.95 in vowel
height. Comparison with human singing, the notes of these two violins are similar to some of the vowels. In Amati, the note B is close to [ε], the note C is close to [ɝ] and
the note #D is close to [i]. In da Salo, the note B is close to [æ], the note C is close to
[ɝ], the note #D is close to [u], the note #F is close to [i] and the note #G is close to [ε].
It is apparently that the sounds of the violin are similar to the different vowels in the
different musical notes.
With the average values of F1 and F2 in Figure 3- 4 b, we compare the violins to
the vocals. The two violins are close to each other in the vowel chart. They are in the
central close-mid and corresponded to the vowel [ɘ] that we didn’t record. This vowel
is not used in English, and the position of the vowel is in the center of all the other
vowels. Based on the analysis above, we can suggest that it is why violins are described
3.1.4. Gender qualities
Studies show that people differentiate the gender based on F4.38, 45 In most of case,
because of the shorter vocal tract in females, F4 of females is higher than males. F3 is
the clue that people use to judge what the vowel is, and in the previous research, F3 of
females is still higher than males.31, 34 To make our analysis easier and clearer, we set
F3 and F4 as the two axes and plot the data we recorded onto the plane. In Figure 3- 5
a, the F3 of [ɝ] is lower than the other vowels. Excluding [ɝ], the other vowels cannot
be differentiated because most of the vowels overlap to each other. In spite of that, we
can divide these vowels into two group based on the gender. Both the F3 and F4 of
females are higher than males. Although all our data are recorded in singing, the results
(Appendix- 4) are consistent with the published data from speech measurements (Table
1- 1 and Table 1- 2).
Figure 3- 5. F3 and F4 distributions of the Amati and the da Salo.
(a) F3 and F4 values of each violin note from G#3 to G4. (b) The centers of each ellipse are the mean values of the 8 males and the 8 females we recorded. The lengths and widths of each ellipse represent
In Figure 3- 5 a, the individual violin notes are scattered over different positions,
and all the notes are in the region of the vocals (Appendix- 5). In F3, the notes disperse
in the region from [ɝ] to the other vowels. In F4, most of the notes concentrate in the
region of males and some notes are in the cross of males and females. Unlike the vowel
chart, we cannot find the common trend between the two violins with the rising pitch.
But, the dispersion of the two violins are different. Comparison with the human singing,
half of the Amati notes is in the cross of males and females. On the other hand, most of
the da Salo notes is in the region of males.
With the average values of F3 and F4 in Figure 3- 5 b, we compare the violins to
the vocals. The F3 is 2602 and 2515 Hz for the Amati and the da Salo, and the F4 is
3731 and 3594 Hz. They are close to the overlapping ellipses which belong to males.
Based on the analysis above, we can suggest that the Amati has some female features,
although both the sound of the Amati and the da Salo are similar to the singing of males.
To connect the sound of the violin to the gender qualities more specifically, we use
the violin formants to approximate the vocal tract length (VTL). The origin of vocal
formants can be explained by standing waves in a half-closed cylinder. On average,
males have longer vocal tracts and therefore lower formant frequencies than females.
The mathematical relationship between formant frequencies (F1 to F4) and VTL can be
calculated by the following formula.46-47
VTL = �
4𝐹𝐹𝑐𝑐1
+
4𝐹𝐹3𝑐𝑐2
+
4𝐹𝐹5𝑐𝑐3
+
4𝐹𝐹7𝑐𝑐4
� ÷ 4
(𝟑𝟑) (c represents the speed of sound, 343 m/s at 298K.)Using equation (3), the VTL of males participating in this study is calculated to be
16.4 cm, and the VTL of females is calculated to be 15.7 cm. Compared to the
anatomical VTL measurements of different voice types using X-ray images,33 16.4 cm
is correspondent to baritones/tenors, and 15.7 cm is correspondent to altos/mezzo-
sopranos. The result is in good agreement with the study about the vocal range. In the
study, males that can sing from G#3 to G4 are correspondent to tenors or baritone, and
females that can sing this range are correspondent to altos or mezzo-sopranos.48
Based on LPC analysis, the mean F1 to F4 values of the Amati are 503, 1583 ,2602
and 3731 Hz. The related VTL is 16.7 cm, corresponding to baritones. The mean F1 to
3.2. The acoustic features of the Strad violins
3.2.1. Frequency response
Several studies have reported differences in the frequency response curves of
Stradivari against other violin groups, but there are not consistent results, probably due
to the different measurement methods and focus.49-50 In our frequency response curves
(Figure 3- 6), there are just a few peaks showing significant differences (p < 0.05). The
Stradivari violins have strong formants at 2766 and 3141 Hz, and strong anti-formants
at 1219 and 2344 Hz, which have also been observes by Buen.49 Interestingly, the strong
formant around 2344 Hz for non-Stradivari violins is similar to the singer’s formant
reported for basses.51 In comparison, the strong formants around 2776 and 3141 Hz for
Stradivari are similar to the singer’s formant reported for tenors and female singers
(altos/sopranos), respectively.
Figure 3- 6. Frequency response comparisons between Strad and non-Strad violins.
Peaks with * indicate p < 0.05 by two-way Welch’s t-test.
n = 6 for the Strads and n = 9 for the non-Strads. The resolution is 46.875 Hz.
3.2.2. Similarities with vocals
The LPC method is used to analyze the formants of both the vocals and violins. In
Table 3- 2, each formant of the non-Stradivari is the average of the 1296 notes (6
microphones × 12 musical notes × 9 violins × 2 times), and each formant of the
Stradivari is the average of the 864 notes (6 microphones × 12 musical notes × 6 violins
× 2 times). All the averages are in the frequency range of the corresponding vocal
formant. The amount of the data enhances the reliability that the sound of the violins
can be compared to the vocals.
We find that all the formants of the Stradivari are higher than the non-Stradivari,
especially F1 which is almost 10% higher. The four formants of each violin are in
Appendix- 6.
Table 3- 2. The formants of Strad and non-Strad violins comparisons with vocals.
3.2.3. Formant differences
All the formants shift when the musical note changes, so we analyze whether the
formants of the Stradivari have a significant difference with the non-Stradivari in each
musical note. All the results are showed in Figure 3- 7. In F1, there are significant
difference in the musical note of B3, C4#, D4, D4#, E4 and F4. The notes from C4# to
F4 of the Stradivari are all higher than the non-Stradivari. Interestingly, it proves that
the trend with the rising pitch is different between the Stradivari and the non-Stradivari.
In F3, there are significant difference in the note of A3# and G4. In both F2 and F4,
none of the note has a significant difference between the two violins. To sum up, we
find that the trend of F1 can be a kind of characteristic for the Stradivari.
Without considering the influence on the musical note, there are 72 samples (6
violins × 12 musical notes) in the group of the Stradivari and 108 samples (9 violins ×
12 musical notes) in the group of the non-Stradivari. In Figure 3- 8, the p-values of F1,
F2 and F3 are all below 0.01, and the result shows that the three formants of the
Stradivari have a significant difference with the non-Stradivari. We do not find the
significant difference between these two groups in the fourth formant. Besides, all the
Figure 3- 7. Formant comparisons in each musical note between Strad and non-Strad violins.
The two-tailed Welch’s t-test is used. The symbol * indicates 0.01 < p < 0.05, ** indicates 0.001 < p <
0.01 and *** indicates p < 0.001. n = 6 for the Strads and n = 9 for the non-Strads.
Figure 3- 8. Formant comparisons in an octave between Strad and non-Strad violins.
The two-tailed Welch’s t-test is used. The symbol * indicates 0.01 < p < 0.05, ** indicates 0.001 < p <
0.01 and *** indicates p < 0.001. n = 72 for the Strads (6 violins × 12 musical notes) and n = 108 for the non-Strads (6 violins × 12 musical notes). The box represents the first and third quartiles, the
middle band represents the median, and the whiskers represent the 5th and 95th percentiles.
3.2.4. Vowel qualities
In Figure 3- 9 a, we plot every note one by one (6 Strads and 9 non-Strads over 12
pitches each), and we find almost every note is in the region of the vowel chart again
(Appendix- 7). In the vowel height, 56 % of the Stradivari notes are under 9, and there
are only 46 % for the non-Stradivari notes. In the vowel backness, 75% of the Stradivari
notes are in front of the middle line and there are only 62 % for the non-Stradivari notes.
Both the results in the vowel height and backness explain why the average of the
Stradivari in the vowel chart is lower and more forward than the non-Stradivari in
Figure 3- 9 b. The mean value of the non-Stradivari is similar to the Amati and the da
Salo in Figure 3- 4. On the other hand, the mean value of the Stradivari is closer to [ε]
and [ɝ]. In the research of acoustic phonetics, humans perceive that the front vowels
are brighter than the back vowels,52-55 and the symbolism of open vowels are bigger
than the close vowels.56-58 The brilliant and sparkling sound of the Stradivari violins
may be partly attributed to these reasons.
Figure 3- 9. Vowel quality comparisons between Strad and non-Strad violins.
(a) Vowel backness and height of individual violin notes (6 Strads and 9 non-Strads over 12 pitches
3.2.5. Gender qualities
In Figure 3- 10 a, every note (6 Strads and 9 non-Strads over 12 pitches each) is
also in the region of the vocals (Appendix- 8). In F3, 54% of the Stradivari notes are
above 2700 Hz, and there are only 32 % for the non-Stradivari notes. In F4, 45% of the
Stradivari notes are above 3800 Hz, which is the lower limit of females, and there are
only 33 % for the non-Stradivari notes. Both the results in F3 and F4 explain why the
F3 average of the Stradivari is higher than the non-Stradivari, but the F4 average of the
Stradivari is almost the same as the non-Stradivari in Figure 3- 10 b.
To know the gender qualities more instinctively, we approximate the vocal tract
length of each group in Figure 3- 11. The mean VTL of the Stradivari violins is 16.2
cm, as opposed to 17.0 cm for the non-Stradivari violins. Comparing with the
anatomical VTL of singers,33 the Stradivari violins have the characteristics of tenors or
altos, and the non-Stradivari violins are similar to basses or baritones.
Need to be reminded, when Amati and da Salo invented the modern violin, most of the
singers giving public performances were males. Famous female singers began to appear
on stage in the early 1600s, before the birth of Stradivari.59 Around the end of
Stradivari’s career, the popularity of sopranos had risen, being considered as the most
attractive voice type.60 This evolutionary trend is also consistent with the evolution of
Figure 3- 10. F3 and F4 distribution comparisons between Strad and non-Strad violins.
(a) F3 and F4 values of individual violin notes (6 Strads and 9 non-Strads over 12 pitches
Figure 3- 11. Vocal tract length estimates for males vs. females, and Strad vs. non-Strad violins.
Open colored shapes represent the individual data points, the center band represents the means, and the whiskers represent the standard deviations. The two-tailed Welch’s t-test is used.
The symbol * indicates 0.01 < p < 0.05 and the symbol ** indicates 0.001 < p < 0.01.
For male , female, Strad and non-Strad groups, n = 8, 8, 6 and 9, respectively.