1
國立臺灣大學生命科學院漁業科學研究所 碩士論文
Graduate Institute of Fishery Science College of Life Science
National Taiwan University Master Thesis
鯉魚肌肉型肌酸激酶在低溫下的活性取決於具極性支鏈的第 268位置胺基酸
Activity of the common carp muscle form creatine kinase at low temperature depends on residue 268 with polar side chain
林希潔 Hsi-Chieh Lin
指導教授 : 嚴宏洋博士 Hong-Young Yan, Ph.D.
許祖法博士 Cho-Fat Hui, Ph.D.
中華民國 100 年 7 月
July, 2011
i
摘要
鯉魚屬於廣溫性魚類,在 35 到 5°C 的環境中依然能維持正常的生理與代謝功
能。對於鯉魚來說,如何在此廣泛的溫度下維持細胞的能量是很重要的課題。肌酸 激酶是一個很重要的能量平衡酵素,可以調控並維持細胞內的能量平衡。肌肉型肌
酸激酶可提供ATP 給肌肉細胞以進行收縮。鯉魚具有 3 種同功異構的肌肉型肌酸
激酶(M1-, M2- 和 M3-CK),其中只有 M1-CK 能夠在低溫下維持活性,而恆溫動物 兔子的肌肉型肌酸激酶 (RM-CK)在低溫下則會失去活性。M1-CK 和 RM-CK 的胺
基酸序列有 86%的相似性,比較兩者胺基酸的差異,以定點突變技術將 RM-CK 第
268 位置的glycine 突變成 asparagin,稱為 RM-CK G268N。RM-CK G268N 在 10°C pH 8.0 的情況下,活性是 RM-CK 的 2.5 倍。從這個實驗結果我們推論 asparagin 268
或許是M1-CK 能在低溫下作用的其中一個重要原因。因此我們利用定點突變技術
將M1-CK 和 RM-CK 第 268 位置的胺基酸突變成 aspartic acid, lysine 和 leucine,去
研究是否是因為極性的支鏈影響其在低溫下的功能。從活性的結果來看,當268 的
胺基酸含有極性的支鏈時,其在低溫下的活性會比非極性的突變高,顯示極性的支
鏈的確會影響M-CK 低溫下的活性。從 CD 的實驗確認 268 胺基酸的改變不會影
響整體的二級結構。熱不穩定性實驗則顯示含有極性268 胺基酸的 CK 在結構上呈
現比較穩定的狀態。在低溫時,水分子和水分子容易形成鍵結,造成酵素表面上的 分子間親水性作用力下降,而酵素分子內的疏水性作用也降低,使得酵素的結構處
於較不穩定的狀態。從結構上來看,當 268 胺基酸為親水性時,會和附近的其他親
水性胺基酸在蛋白質表面形成一個連續的親水性區域,這個親水性區域可以增加 對水分子吸引力,使水分子和親水性胺基酸形成氫鍵, 增加表面的親水性作用及
分子內的疏水性作用以穩定CK 的結構,因此我們認為 M1-CK 藉由 268 位置的極
性胺基酸來增加和水分子之間的鍵結來穩定結構,使其可在低溫下維持活性。
ii
Abstract
The common carp (Cyprinus carpio) required to maintain physiologic and metabolic
capabilities when temperature of their habitat varies over a large temperature range 5 °C
to 35 °C. At this broad range of temperature, ATP production in energy demanding cells
is an important criterion to maintain the common carp. Creatine kinase is an important
energy homeostasis enzyme. Muscle-specific creatine kinase (M-CK) catalyses the
reversible reaction that converts phosphocreatine and ADP to creatine and ATP and thus
provides ATP for muscle contraction. Previously, three common carp CK isoforms
(M1-, M2- and M3-CK) were cloned. M1-CK has been suggested to have evolved to
become the only CK that functions over the ranges of intracellular pH and body
temperature variation that occurs in the common carp. The primary structures of
RM-CK (M-CK of homeothermal rabbit) and carp M1-CK share 86% identity. By
comparing the differences between RM-CK and M1-CK, and with RM-CK cDNA as
template, RM-CK G268N show higher specific activity than wild type at pH 8.0 at 10
°C. This result suggests N268 residue plays an important role in conferring the
appropriate 3D structure to M1-CK to function at low temperature. Therefore, we
mutated 268 residues to aspartic acid, lysine or leucine and examined their properties.
iii
The mutants with polar side chain at residue 268 had higher activity and could maintain
their function at low temperature. From the thermal stability, the polar mutants were
more stable than non-polar mutants. Examining the structure surface of these mutants,
when residue 268 was hydrophilic, it could connect nearby hydrophilic residues to form
continuous hydrophilic region. This hydrophilic region could hydrogen bond with water,
which then stabilizes the enzyme and results in maintaining activity at low temperature.
iv
Contents
中文摘要………...…... ……….i
Abstract ………..ii
Contents………...iv
Figure content………....vi
Table content………...viii
Abbreviations………..x
Introduction………1
Materials and Methods………..16
1. Materials………...16
2. Methods………...24
A. Construction of site-directed mutagenesis mutants…………...24
B. Production of protein………26
C. Specific activity assay………...28
D. Kinetic assay……….30
E. Thermal stability assay………..31
F. Circular dichroism……….32
v
G. Structure modeling………33
Results………34
A. Construction of site-directed mutagenesis mutants…………...34
B. Production of protein………...34
C. Specific activity assay………35
D. Kinetic assay………...38
E. Thermal stability assay………...41
F. Circular dichroism………...42
G. Structure modeling………...43
Discussion and conclusion………..47
References………...52
Tables and Figures……….. ………...61
Tables………..61
Figures……….77
vi
Figure Content
Figure 1: Construction of RM-CK and M1-CK mutants with pET28a (+).
Figure 2: Protein extracted products analysis in SDS-PAGE.
Figure 3: Wild type and mutant proteins analysed by SDS-PAGE.
Figure 4: Mean ± S.D specific activities of M1-CK and its mutants at different
temperature and pH.
Figure 5: Mean ± S.D specific activities of RM-CK and its mutants at different
temperature and pH.
Figure 6: Mean ± S.D Km of M1-CK and its mutants at different temperature at pH 7.1 and 8.0.
Figure 7: Mean ± S.D Kcat of M1-CK and its mutants at different temperature at pH 7.1 and 8.0.
Figure 8: Mean ± S.D Km of RM-CK and its mutants at different temperature at pH 7.1 and 8.0.
Figure 9: Mean ± S.D Kcat of RM-CK and its mutants at different temperature at pH 7.1 and 8.0.
Figure 10: Thermal stability of RM-CK and its mutants at pH 7.1 and 8.0
vii
Figure 11: Thermal stability of M1-CK and its mutants at pH 7.1 and 8.0
Figure 12: Spectra of far-UV circular dichroism (CD) spectroscopy of M1-CK and its
mutants at different temperature at pH 7.1 and 8.0 .
Figure 13: Spectra of far-UV circular dichroism (CD) spectroscopy of RM-CK and its
mutants at different temperature at pH 7.1 and 8.0 .
Figure 14: The hydrophilic and hydrophobic surface around residue 268 of RM-CK and
it mutants.
Figure 15: The hydrophilic and hydrophobic surface around residue 268 of M1-CK and
it mutants.
viii
Table Content
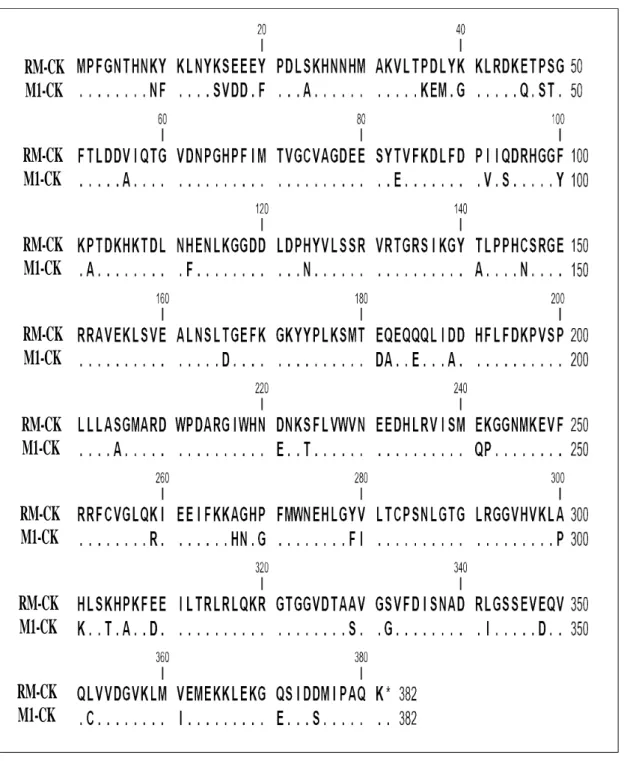
Table 1: The primary structures of RM-CK and carp M1-CK
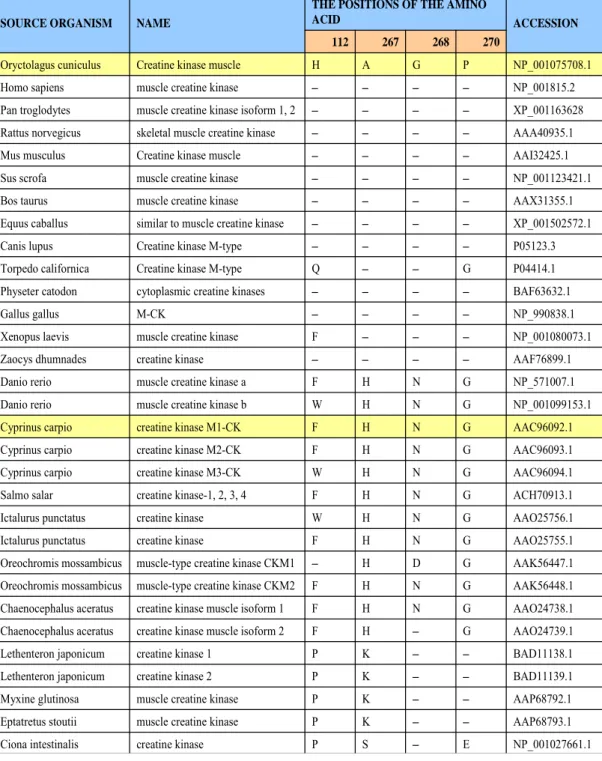
Table 2: Amino acid sequences of muscle-form creatine kinase of different species.
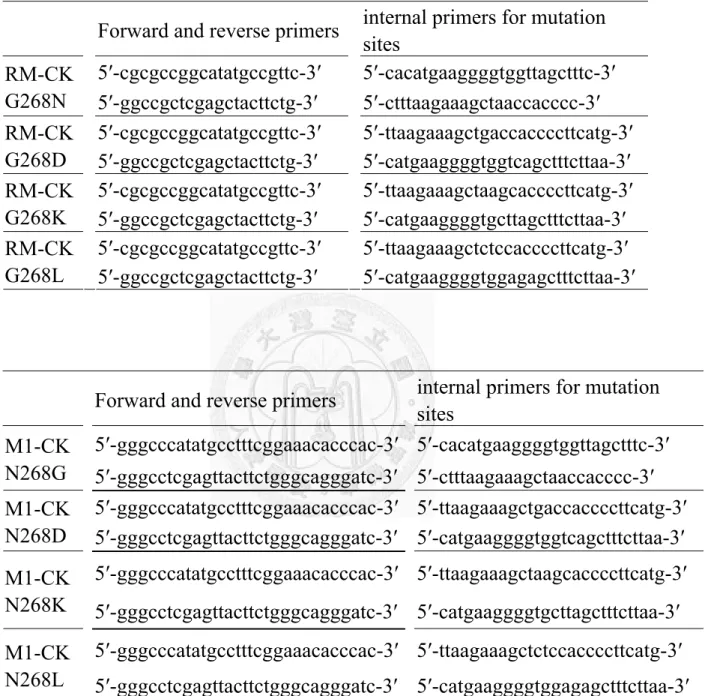
Table 3: The primer sequences used to constructed site-directed mutagenesis on residue
268 of RM-CK and M1-CK mutants.
Table 4: Mean ± S.D specific activities of M1-CK and its mutants at different
temperature and pH.
Table 5: Mean ± S.D specific activities of RM-CK and its mutants at different
temperature and pH.
Table 6: Mean ± S.D Km values of M1-CK and its mutants at different temperature at pH 7.1, 8.0.
Table 7: Mean ± S.D Kcat values of M1-CK and its mutants at different temperature at pH 7.1, 8.0.
Table 8: Mean ± S.D Km values of RM-CK and its mutants at different temperature at pH 7.1, 8.0.
Table 9: Mean ± S.D Kcat values of RM-CK and its mutants at different temperature at pH 7.1, 8.0.
ix
Table 10: The solvent accessible surface of hydrophilic residues nearby residue 268
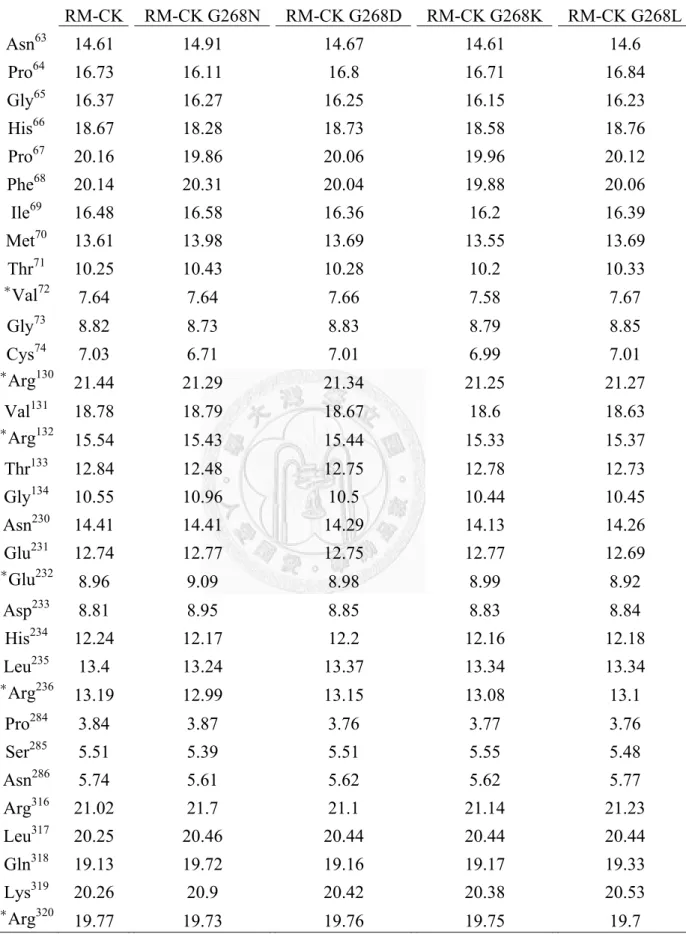
Table 11: Cα distances of residue 268 to nearby hydrophilic residues of RM-CK and its
mutants.
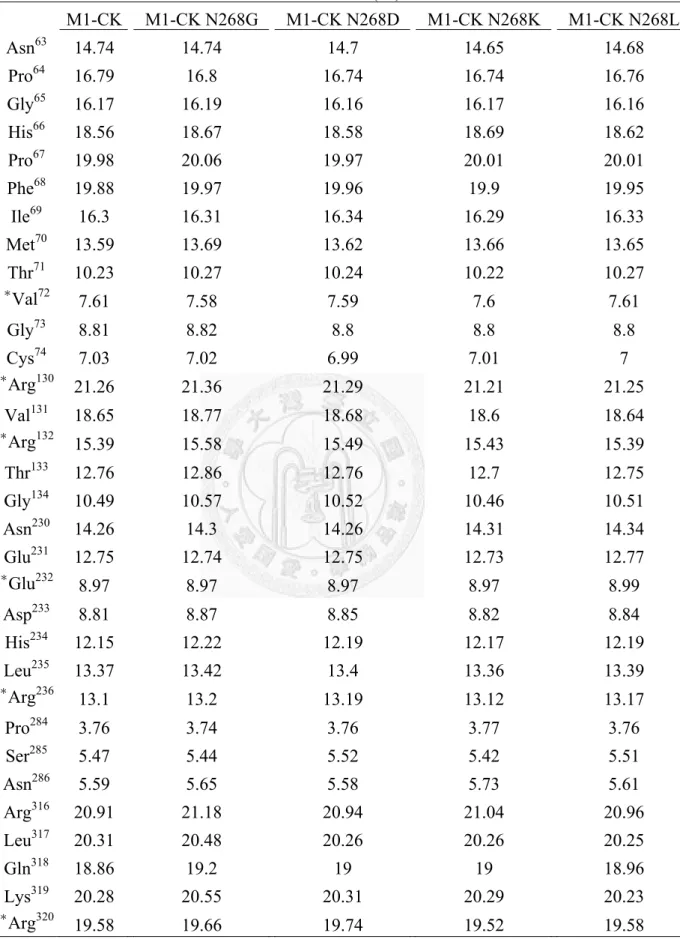
Table 12: Cα distances of residue 268 to nearby hydrophilic residues of M1-CK and its
mutants.
Table 13: Cα distances of residue 283 to active site residues of RM-CK and its mutants.
Table 14: Cα distances of residue 283 to active site residues of M1-CK and its mutants.
x
Abbreviations
ADP: adenosine diphosphate
ATP: adenosine triphosphate
Cr: creatine
PCr: phosphocreatine
DTT: 1, 4-dithiothreitol
LB: Luria-Bertani medium
CK: creatine kinase
M1-CK: M1 subisoform of muscle specific creatine kinase of common carp
RM-CK: muscle form creatine kinase of rabbit
TSAC: transition state analog complex, including creatine kinase, creatine, Mg-ADP
and nitrate
CD : circular dichroism spectroscopy
RM-CK mutants: RM-CK G268N, RM-CK G268D, RM-CK G268K and RM-CK
G268L
M1-CK mutants: M1-CK N268G, M1-CK N268D, M1-CK N268K and M1-CK
N268L
xi
Polar mutants: RM-CK G268N, RM-CK G268D, RM-CK G268K, M1-CK, M1-CK
N268D and M1-CK N268K
Non-polar mutants: RM-CK, RM-CK G268L, M1-CK N268G and M1-CK N268L
1
Introduction
Influence of water temperature on fish, and common carp has a well-developed capacity to modify muscle properties in response to low temperature
Water temperature is a major factor that influences fish physiology. In fish, heat generated by metabolism is carried via blood to the gills, where it is lost to the environment (Stevens and Sutterlin, 1976). Consequently, body temperatures of fish depart little from ambient water temperature (Carey, 1973; Reynolds et al., 1976).
Cultivating fishes are impacted when ambient water temperature change. Cold stress is a severe challenge to aquaculture industry in many countries including Taiwan. There is a big loss in aquaculture from the drastic drop of water temperature to below 15℃
during winter (Johnston and Temple, 2002). The cold damages aquaculture fishes, including tilapia (Oreochromis mossambicus), milkfish (Chanos chanos), grouper (Epinephelus coioides) and cobia (Rachycentron canadum). When surrounding temperature goes below 15℃, these species lose their swimming ability and become
imbalance, and finally die (Johnston and Temple, 2002). This cold-induced economic fishery losses in Taiwan amount up to US$10 million annually. Similarly in southern
United States and Israel, water temperature during winter may drop to levels that cause severe growth inhibition and mortality to aquaculture tropical fishes (Snodgrass, 1991).
2
Variations in body temperature impact fish physiology in two ways: (1) temperature determines the rate of chemical reactions, and even modest reductions in temperature markedly depress reaction rates; (2) temperature dictates the point of equilibrium between the formation and disruption of non-covalent forces which stabilize both macromolecular and molecular structures of physiological importance, and the binding of ligands to proteins (Wood, 1993).
Structural flexibility is necessary for both protein function and well-being of biological membranes. But cold temperature can constrain this flexibility, thereby stabilizing less active conformations. Conversely, high temperatures promote conformational plasticity that biological structure can no longer be maintained (Ciardiello et al., 2000).
The significant changes in body temperature bring a serious challenge to the maintenance of integrated physiological function. Among fishes, this challenge is met and the effects of acute temperature change obviated in various ways: (1) some fish (endothermy) have evolved specialized mechanisms for the production and retention of metabolic heat: (2) most fish are essentially isothermal with their environment and cope with the problems of poikilothermy (i.e., variable body temperatures) by a diversity of mechanisms (Rome et al., 1985).
Fish deal with thermal stress by a variety of mechanisms, including: behavioral
3
adjustments, physiological responses to temperature change (shock, within one day), and acclimatory or adaptational adjustments to persistently altered temperatures (acclimation, during weeks to months or adaptation, a much longer period) (Bernal et al., 2001; Wood, 1993).
Although many fish can thermoregulate behaviorally, microhabitat selection is not effective in dealing with long-term fluctuations in environmental temperature.
Consequently, fish possess a variety of alternate mechanisms for coping with the extremes of environmental temperature (Wood, 1993).
In thermal acclimation, thermal compensation is more evident in eurythermal fishes that must acclimatize to seasonal or daily fluctuations in temperature. Individual fish can survive because of their physiology and biochemistry is altered in response to temperature change (Gamperl et al., 2002). Such environmentally induced phenotypic plasticity generally requires a period of adjustment that may last from days to weeks.
Acclimation to temperature extremes both improves performance at the acclimation temperature and extends the range over which normal activity can be maintained.
In thermal adaptation, polar teleosts exhibit higher rates of metabolism than their tropical counterpart, they display higher rates of oxygen consumption when acclimated to cold than warm temperatures (Kanungo and Prosser, 1959). At the cellular level, the capacity for ATP production by aerobic means is commonly elevated at cold
4
temperatures (Hazel and Prosser, 1974). Although pathways of carbohydrate (Stone and Sidell, 1981), lipid (Sellner and Hazel, 1982), RNA/DNA (Das, 1967), and protein metabolism all acclimate to temperature change, the nature of these compensations is frequently highly specific. Thus, temperature acclimation involves a total reorganization of cellular metabolism rather than a simple up- or down regulation of general metabolic rates. The adaptive significance of acclamatory adjustments in membrane fluidity must be judged by temperature compensated on membrane function. Modulation of fluidity has also been implicated in the elevated activities of succinate dehydrogenase (Hazel, 1972), cytochrome oxidase (Wodtke, 1981), and Na+/K+-ATPase (Raynard and Cossins, 1991) typical of cold-acclimated fish, as well as the compensation of membrane permeability (Hazel and Schuster, 1976) and neural function.
The eurythermic common carp (Cyprinus carpio) distributes from Europe to Asia, and lives at temperature range from 10 to 35℃ (Hwang and Lin, 2002; Stecyk and
Farrell, 2006). They are hardy and tolerant to a wide variety of conditions. It has been known that the pH of extracellular and intracellular fluids of poikilothermic animals varies inversely with body temperature (Yancey and Somero, 1978). In the common carp, blood and intracellular pHs rise from 7.6 to 8.0 when water temperature decreases from 20 to 10 ℃, and it could change 0.4 pH units within a day (Reeves, 1977; Rothe
and Heisler, 1979; Albers et al., 1983; Moyes et al., 1988). Thus, there is interest in
5
many aspects of their physiological responses such as metabolism (Wodtke, 1981;
Guderley, 1990), neuron response (Ven der Linden et al., 2004), endocrine release (Flik et al., 2006) and behavior (Rome et al.,1990; Johnston & Temple, 2002; Guderley, 2004;
Ven der Burg et al., 2006). At this broad range of temperatures, ATP production in energy demanding cells is an important criterion to maintain the common carp.
The common carp can survive well at temperature as low as 10 ℃ without showing
impaired swimming ability (Watabe, 2002). The swimming ability of fish at low temperature was fueled by muscle contraction and the efficiency of the acquisition to closely regulate the energy metabolism (Rome, et al., 1985). The common carp has a well-developed capacity to modify muscle properties in response to changes in temperature, which allows it to maintain physiological and mechanical homeostasis under severe thermal stress (Johnston et al., 1990; Wakeling et al., 2000). In most muscle tissues, the ATP regeneration capacity of creatine kinase (CK, EC 2.7.3.2), the key energy metabolic enzyme (Wallimann, 1994), is highly effective, considerably exceeding both ATP utilization as awell as ATP replenishment by oxidative phosphorylation and glycolysis (Wallimann et al., 1992). Therefore, we investigate the common carp muscle-form creatine kinase to find out how CK functions in order for eurythermic fishes to adapt to different ambient temperatures.
6
Creatine kinase is an important energy homeostasis enzyme, and M1-CK subisoform of common carp still functions well at low temperature
Creatine kinase (CK) is a member of the phosphagen (guanidino) kinase family. This family of enzymes is highly conserved and is found throughout the animal kingdom.
Other members of the family include arginine kinase (AK), glycocyamine kinase (GK), taurocyamine kinase (TK), and lombricine kinase (LK) (McLeish and Kenyon, 2005).
Creatine kinase is the only phosphagen kinase found in vertebrates, but it is also found in many invertebrates, including sponges, polychaetes, and echinoderms (Robin, 1964;
Watts, 1968, 1971, 1975; Ellington, 2001).
CK catalyzes the reversible transfer of a phosphoryl group from ATP to creatine (Feng et al., 2007).
ADP + Phosphocreatine ↔ ATP + Creatine
The most important physiological function of CK is the regeneration of ATP from phosphocreatine (PCr) when high energy is demanded (Wallimann and Hemmer, 1994;
Wallimann et al., 1992).
There are four different CK isoforms known in vertebrates; two are found in cytosol, and two are found in mitochondria. The cytosolic forms are called MM-CK (muscle)
7
and BB-CK (brain), which exist as dimers under physiological conditions (Eppenberger et al., 1967; Wallimann et al., 1992). Under some circumstances, cytosolic CK can exist
as the MB heterodimer (Eppenberger et al., 1967; Rosenberg et al., 1981; Quest et al., 1990). The muscle form CK (M-CK) is specific for differentiated muscle, whereas the brain form CK (B-CK) is found in brain and a variety of other tissues, and these cytosolic forms are used mostly in providing ATP for muscle contraction (Schlegel et al., 1988; Qin et al., 1998). The mitochondrial forms are called ubiquitous (Miu-CK) and the sarcomeric (Mis-CK). MiCK also forms dimers, which can readily associate to an octameric form depending on the pH and the concentration of MiCK (Kaldis et al., 1994; McLeish and Kenyon, 2005; Wallimann et al., 1992).
The regulatory function of CK is particularly important in cells that have large and variable energy demands, such as in the brain, heart, muscle, neurons, photoreceptor, retina, spermatozoa and electrocytes. This important regulatory network has come under scrutiny from a number of recent studies suggesting that improper regulation of the CK/PCr system is associated with a variety of disease states, including cardiovascular, neurological, muscle and renal diseases as well as cancer (Schlattner et al., 2006; Wyss and Kaddurah-Daouk, 2000).
MM creatine kinase has different isoforms in different species. In dogs, the hydrolytic cleavage of a basic amino acid, presumably by carboxypeptidase N, is
8
responsible for conversion of muscle tissue MM1 to MM2 and MM3 (George et al., 1984). In humans, MM-CK isoforms are formed by the successive removal of the COOH-terminal lysine residue from one M subunit at a time, resulting in the conversion of MM-A to isoforms MM-B and MM-C ( Billadello et al., 1985). In mammals, there is just one isoform of B-CK, and the two B-CK isoforms of chicken are derived from a single gene by alternative splicing of the second exon (Hossle et al., 1986; Wirz et al., 1990). Additional heterogeneity of B-CK has been shown to be due to alternative initiation of translation or post-translation phosphorylation (Soldati et al., 1990; Quest et al., 1990; Chida et al., 1990; Hemmer et al., 1993).
In teleost fishes, there are four CK isoenzymes termed CK-A to CK-D and are all of cytoplasmic origin. CK-A, CK-C, and CK-D are expressed predominantly in striated muscle, stomach, and testis, respectively, while CK-B is expressed ubiquitously or is confined to neural tissue (Fisher et al., 1978). In trout, a cDNA encoding for a CK named TCK-1 has been demonstrated to show enhanced testicular expression, and an s-CK protein has been purified from sperm (Saudrais et al., 1996). Since Torpedo electrocytes have been shown by isoenzyme and two-dimensional electrophoresis to contain the same major CK isoforms as muscle, the two Torpedo CKs very likely represent the CK-A isoenzyme (Barrantes et al., 1983; Giraudat et al., 1984; West et al., 1984). Based on a comparison of the tissue specificity of expression of the various
9
isoenzymes, it has been hypothesized that CK-II of frogs and CK-A of fish correspond to M-CK of mammals and birds, while CK-IV and CK-C correspond to B-CK (Wolff et al., 1985; Mühlebach et al., 1994).
Previously, three common carp M-CK subisoforms, M1-, M2- and M3-CK, have been cloned (Sun et al., 1998). Immunoblot and immunohistochemical analyses show that all three M-CKs were detected in red and white muscle of different temperature (30–10° C) acclimatized common carp (Sun et al., 2002).
Biochemical analysis of serum CK activity has been developed since 1965, and most of these methods involve the assay of coupled enzymes or measurement of proton formation (Holliday et al., 1965). Under variable temperature and pH conditions, these methods would not be suitable to determinate the specific activities of the common carp M-CK (Tanzer and Gilvarg, 1959; Mahowald et al., 1962; Rosalki, 1967). In this study, using a modified M-CK activity assay method originally designed by Hughes, (1962), the specific activities at temperatures from 5 to 40 ° C, and at pH that resemble the changes in the common carp intracellular pH (7.1–8.0) were studied (Hughes, 1962).
In comparison of the specific activities of M1-, M2- and M3-CK, M1-CK exhibited highest activity, M2-CK, however, was very low at all pH and temperatures, M3-CK was between M1- and M2-CK. M3-CK increased from 30 to 20°C then decreased when below 20° C, yet M1-CK activity remained stable from 30 to 20° C, then increased
10
significantly at 15° C. At pH 8.0, 15° C, only M1-CK was able to maintain its specific activity at > 50% (156U) its highest specific activity, while specific activity of M3-CK decreased to 25 U. Therefore, it seems that M1-CK can function well in the common carp muscle from 35 to 5° C (Wu et al., 2008).
Comparisons of thermal stability showed that M3-CK was least thermal stable (Wu et al., 2008). A study using 2-D gel on cold acclimation and expression of soluble proteins in the common carp skeletal muscle revealed a downregulation of expression of M2- and M3-CK, and an increased accumulation of their fragments (McLean et al., 2007).
M2-CK and M3-CK were both found to be thermal unstable as well as subject to ubiquitination and proteolytic fragmentation at low temperature (McLean et al., 2007).
M1-CK subisoform seems to be the only one that has evolved to become adaptive to the synchronized changes in body temperature and intracellular pH that occur in the common carp (Wu et al., 2008).
11
The difference between RM-CK and M1-CK at low temperature, and residue 268 may play an important role for M1-CK maintains its activity at low temperature.
The M-CK of endothermic rabbit Oryctolagus cuniculus (RM-CK) has been cloned and its crystal structure resolved (Putney et al., 1984; Rao et al., 1998). The specific activity of RM-CK is highest at around 35 °C to 40 °C, and then decreases as temperature decreases. At temperatures < 15 °C and at pH >7.7, specific activities of M1-CK were three to eight-fold higher than specific activities of RM-CK (Wu et al., 2008).
The primary structures of RM-CK and carp M1-CK share 86% identity (Table 1).
Well conserved residues have been studied by site directed mutagenesis and chemical modification (Chen et al., 1996). Arginine and histidine are thought to be important in stabilizing ADP or ATP as well as involved in acid/base catalyst generation (Cantwell et al., 2001). Tertiary and domain structures of CK have been studied on crystals of phosphagen kinases, mitochondria CK and muscle form CKs (Zhou et al., 1998;
Fritz-Wolf et al., 1996; Rao et al., 1998). The N-terminal domain of CK has been shown to be the dimerization domain and the C-terminal domain is the catalytic domain that contains symmetric β-sheets (Fritz-Wolf et al., 1996; Eder et al., 1999; Rao et al., 1998).
Arg96, arg130, arg132, arg236, arg292, arg320, and arg341 have been reported to be transition-state analog complex (TSAC) binding residues, and his61, his92, his186, and
12
his295 participate in catalysis (Uda et al., 2009; Jourden et al., 2005; Edmiston et al., 2001; Wood et al., 1998; Forstner et al., 1997; Chen et al., 1996; Fritz-Wolf et al., 1996).
Negative charged residues, glu226, glu227, and asp228, located within the active site of mitochondria CK are important for catalytic activity (Eder et al., 2000). Two flexible loops, residues 60-65 and 316-326, control the entrance of creatine or phosphocreatine, and creatine interacts with val71, asp231 and glu326, and cys283 is important but not essential for catalysis (Cantwell et al., 2001; Furter et al., 1993; Forstner et al., 1996;
Ohren et al., 2007; Reddy et al., 2000; Tanaka and Suzuki, 2004).
In M-CK, cys283 forms part of a conserved cysteine–proline–serine motif and its pKa
has been found to be 5.6±0.1, about 3 pH units below that of a regular cysteine residue.
Employing computational and UV difference spectroscopy studies of wild-type human M-CK and the P284A (pro284 to ala284), S285A (ser285 to ala285) and C283S/S285C (cys283 to ser283/ ser283 to cys283) mutants, results suggested that ser285 lowers the pKa
about 1 pH unit and pro284 lowers it a further 1 pH unit (Wang et al., 2006; Cook et al., 1981). Taken together, the change in ambient temperature affects carp body temperature and intracellular pH which in turn affects the pKa of carp M1-CK (Albers et al., 1983).
By comparing the differences between RM-CK and M1-CK, and with RM-CK cDNA as template, selected site direct mutagenesis were carried out. In order not to affect the enzyme activity, residues that are different between RM-CK and M1-CK but located in
13
secondary structures were avoided. Thus, most mutations were made in the random coil regions and the hinge region between the N- and C-terminals. Three RM-CK mutants, designated as RM-CK A267H (ala267 to his267), RM-CK G268N (gly268 to asn268) and RM-CK P270G (pro270 to gly270), that still retained significant enzyme activity were generated and their enzymatic and physiochemical properties examined (Wu et al., 2011).
RM-CK G268N show higher specific activity than wild type at pH 8.0 at 10 °C.
Comparing the amino acid sequences of muscle-form creatine kinase of endothermal animals (mammal) and ectothermal animals (fish), at residue 268, endothermal animals are always glycine and ectothermal animals are always asparagines (Table 2). This result suggests that asn268 residue may plays an important role in conferring a appropriate 3D structure to M1-CK to function at low temperature.
Analysis the crystal structure of RM-CK G268N, the Cα group of cys283 in RM-CK G268N was 0.2 Å shorter than in wild-type RM-CK. The model structure of RM-CK was consistent with previous CK structure studies in which val72, arg130, arg132, glu232, arg236 and arg320 set the boundary of the active site (Uda et al., 2009; Jourden et al., 2005; Edmiston et al., 2001).The distances between the creatine binding residues (val72 and glu232) and the nucleotide binding residues (arg132, arg236, arg292 and arg320) were shorter in RM-CK G268N than in wild-type RM-CK. The distances from val72 to arg292
14
and glu232 to arg236 were shorter by 0.4 Å and 0.2 Å, respectively, in RM-CK G268N than in wild-type RMCK. Therefore, a smaller active site might be the reason for improvement in activity at low temperature (Wu et al., 2011).
The difference between glycine and asparagine is the side chain, and the side chain of residue 268 of RM-CK located on the surface of the protein molecule and points out to the solvent. The two polar atom, oxygen and nitrogen of the side chain of asparagine are hydrophilic. A hydrophilic side chains located at molecular surface, where a polar atom can easily form hydrogen bonding with the solvent owing to the flexibility of water molecules (Xu et al., 1997) and hydrophilic side chain may reduce the hydrophobicity on the interface of protein and water (Fersht, 1985; Timasheff, 1993).
The water molecular that located at hydrophobic region of the enzyme is at a high energy state because it is at an interface and not in bulk water (Fersht, 1985). Bulk water is where it can fulfill readily all its hydrogen bonding and can stable the molecular that interaction with it (Fersht, 1985).
Cold-induced change in a protein based on the very unusual feature of hydrophobic interaction. At low temperature, protein may be in a cold denatured state, and hydrophobic interaction decreases as a result of the increase in hydration contribution (Privalov, 1990). Polar groups rather than non-polar surfaces promote the formation of hydrogen bonding network at low temperatures (Robinson and Cho, 1999).The
15
hydrogen bond formation by bulk water and protein may stabilize it at low temperature (Tsai et al., 2002). Therefore, the hydrophilicity of residue 268 may be one of the important reasons for M1-CK maintains activity at low temperature. We mutated 268 residue of M1-CK and RM-CK to glycine, asparagines, aspartic acid, lysine or leucine and examined their specific activities, kinetic properties, thermal inactivation and circular dichroism to find out how residue 268 affect muscle-form CK at low temperature.
16
Materials and Methods
1. Materials
A. Competent cells:
ECOSTM 101 (Yeastern Biotech, Taipei)
endA1 recA1 relA1 gyrA96 hsdR17(rk-, mk+) phoA supE44 thi-1 Δ(lacZYA-argF)U169 Φ80 Δ(lacZ)M15 F-
ECOSTM 21 (Yeastern Biotech, Taipei) F- ompT hsdSβ(rβ-mβ-) dcm gal λ(DE3)
B. Plasmid:
pET-28a(+) (Novagen, Cat. NO. 69864-3)
C. Chemicals:
NaCl (Merck), NaOH (Merck), MgCl2 (Merck), HCl (Merck, 37%), Tris (aMRESCO), KCl (Merck), NiSO4 (Merck), imidazole (Merck), glucose (Merck), EDTA (Merck), DTT (1,4-dithiothreitol, aMRESCO), kanamycin sulfate (GIBCOTMInvitrogen), 1-anphthol (Sigma-Aldrich), sodium
17
p-hydroxymercuriobenzoate (Fluka), 2,3-butanedione (diacetyl, Fluka), ADP (potassium salt, Merck), phosphocreatine (PCr, disodium salt, Merck), dNTP (PROTECH), IPTG (aMRESCO), Creatine (anhydrous, Sigma), dithioerythreitol (DTE, BDH), ammonium bicarbonate (Sigma), iodoacetamide (IAA, Fluka), acetonitrile (Mallinckrodt CHEMICALS), TFA (SIGMA-ALDRICH), sinapinic acid (SA, Bruker), 25mM ATP solution ( EPICENTRE)
D. Enzyme:
NdeΙ (FastDigest, Fermentas), XhoΙ (FastDigest, Fermentas), T4 DNA ligase
(Promege), Taq DNA polymerase (Fermentas), Pfu DNA polymerase (Fermentas), trypsin (SIGMA)
E. Commercial kit:
QIAquick PCR Purification kit (QIAGEN) Mini-plasmid extraction kit (VIOGENE) QIAquick Gel Extraction Kit (QIAGEN) Coomassie plus protein assay reagent (Thermo)
18
F. DNA agarose gel:
1% : 100ml 1x TBE buffer(aMRESCO) 1g SeakemR LE Agarose (Lonza)
1.5% : 100ml 1x TBE buffer(aMRESCO) 1.5 g SeakemR LE Agarose (Lonza)
G. LB(1L):
10 g BactoTM trypton (BD) 5 g BactoTM yeast extract (BD) 5 g NaCl
pH7.5
H. SOB , SOC:
SOB(1L) : 20 g BactoTM trypton (BD) 5 g BactoTM yeast extract (BD) 0.5 g NaCl
10 ml 250mM KCl pH7.0
19
SOC(100ml) : 100 ml SOB 0.5 ml 2M MgCl2
2 ml 1M glucose
I. Protein purification buffer:
Charge buffer (8x) : 105.14 g NiSO4
add distilled water to 1000 ml
Binding buffer (8x) : 2.72 g imidazole 233.76 g NaCl 19.38 g Tris
Add distilled water to 1000 ml pH 7.9
Wash buffer (8x) : 32.68g imidazole 233.76 g NaCl 19.38 g Tris
Add distilled water to 1000 ml pH 7.9
20
Elute buffer (4x) : 272.32g imidazole 116.88 g NaCl 9.69 g Tris
Add distilled water to 1000 ml pH 7.9
Strip buffer (4x) : 400g EDTA (Merck) 116.88 g NaCl
9.69g Tris
Add distilled water to 1000 ml pH 7.9
J. Dialysis buffer:
30 mM Tris 10 mM MgCl2
1 mM DTT pH 7.1
21
K. Protein storage buffer:
Glycerol : 6x buffer = 5:1 v/v 6x buffer: 180 mM Tris
60 mM MgCl2
6 mM DTT pH 7.1
L. Activity assay reagent:
3x activity assay buffer : 90 mM Tris 30 mM MgCl2
3 mM DTT
1x activity assay buffer: 1.8 ml glycerol (Merck) 4.2 ml d.d.H2O
3 ml 3x activity assay buffer
Stop solution (200 ml ): 3.607g sodium p-hydroxymercuriobenzoate Add distilled water to 200 ml
5N NaOH 5~10 drops
22
Colorimetric reaction solution:
0.2g 1-anphthol +10 ml alkaline solution 2,3-butanedione (diacetyl) 1:200, v/v
Alkaline solution(400ml): 24g NaOH 48g Na2CO3
Add distilled water to 400 ml
M. 10% SDS-PAGE:
Resolving gel : 25 ml d.d.H2O
20 ml 30% acrylamide mix (37.5:1, BIO-RAD) 15 ml 4x Tris/SDS (pH8.8)
200 μl 10% AP (Merck) 40 μl TEMED (Merck)
Stacking gel : 12.2 ml d.d.H2O
2.6 ml 30% acrylamide mix (37.5:1, BIO-RAD) 5 ml 4x Tris/SDS (pH6.8)
100 μl 10% AP (Merck) 20 μl TEMED (Merck)
23
4x Tris/SDS (pH8.8) : 182g Tris
20 ml 20% SDS (Merck) Adjust to pH8.8 with 1N HCl d.d.H2O add to 1000 ml
4x Tris/SDS (pH6.8) : 12.1g Tris
4ml 20% SDS (Merck)
Adjust to pH6.8 with 1N HCl d.d.H2O add to 200 ml
N. SDS-PAGE stain solution (coomassie brilliant blue G-250):
Solution Ⅰ: 25 % isopropanol (Merck)
10 % acetic acid (Merck)
1.5mg/100ml coomassie brilliant blue G-250 (Merck) Solution Ⅱ: 10 % isopropanol (Merck)
10 % acetic acid (Merck)
1.5mg/100ml coomassie brilliant blue G-250 (Merck) SolutionⅢ : 10 % isopropanol (Merck)
3mg/100ml coomassie brilliant blue G-250 (Merck)
24
2. Methods
A. Construction of site-directed mutagenesis of RM-CK and M1-CK mutants
A rabbit muscle cDNA library was purchased from Merck, and RM-CK was cloned with primer pairs 5′-atcccatatgccgttcggcaac-3′ and 5′- aaaactcgagctacttctgggc-3′. The PCR product was digested with NdeI and XhoI, and then ligated into pET 28a (Wu et al., 2011). M1-CK was constructed previously (Sun et al., 1998), it is also digested with NdeI and XhoI, and then ligated into pET28a.
To mutate glycine to asparagine, aspartic acid, lysine or leucine at residue 268 of RM-CK, bridge PCR method was used in site directed mutagenesis on RM-CK-pET28a clone. The primers were displayed in Table 2.
Similarly, mutated asparagines to glycine, aspartic acid, lysine or leucine at residue 268 of M1-CK, bridge PCR method was also used in site directed mutagenesis on M1-CK-pET28a clone, the primers were displayed in Table 2.
5 μl Taq DNA polymerase 10x buffer, 4 μl dNTP, 32.5μl d.d.H2O , 1 μl primer (100 μM) twice, 1 μl template (RM-CK-pET28a or M1-CK-pET28a), 5 μl MgCl2 (25 mM) and 0.5 μl Taq DNA polymerase are used in the first PCR. The PCR program was one cycle of 94 oC for 5 min, 35 cycles of denature 94 oC for 20 sec, annealing 50 oC for 20 sec and extension 70 oC for 90 sec, and final extension of one cycle at 70 oC for 5 min.
25
The first PCR products were separated by 1.5 % DNA agarose gel and purified by QIAquick Gel Extraction Kit (QIAGEN). For second PCR, 5 μl the purified DNA fragment twice, 5 μl Pfu DNA polymerase 10x buffer, 4 μl dNTP, 25 μl d.d.H2O, 5 μl MgCl2 (25 mM) and 1 μl Pfu DNA polymerase were added. The PCR program was one cycle of 94 oC for 5 min, 15 cycles of denature 94 oC for 20 sec, annealing 52 oC for 20 sec and extension 70 oC for 90 sec, and final extension of one cycle at 70 oC for 5 min.
When second PCR finished, 2 μl forward and reverse primers were added directly for the third PCR. The PCR program was one cycle of 94 oC for 5 min, 25 cycles of denature 94 oC for 20 sec, annealing 52 oC for 20 sec and extension 70 oC for 90 sec, and final extension of one cycle at 70 oC for 5 min. The third PCR products were purified by QIAquick PCR Purification kit (QIAGEN).
Subsequently, NdeI and XhoI were used to double digest the third PCR purification products and pET28a vector. 4 μl d.d.H2O, 2 μl 10x Fastdigest buffer, 10 μl third PCR purification products or pET28a vector, 2 μl FastDigest NdeI and 2 μl FastDigest XhoI were added to the 1.5 ml microcentrifuge tube, then incubated at 37 oC for 20 minutes for digestion. These digested products were subjected to 1 % DNA agarose gel electrophoresis then used QIAquick Gel Extraction Kit (QIAGEN) to purify the sticky-end DNA fragment and pET28a. 3.9 μl sticky-end DNA fragment, 8 μl sticky-end pET28a, 1.5 μl 10x T4 DNA ligase buffer, 1 μl T4 DNA ligase and 0.6 μl ATP (25 mM )
26
are used in ligation at 4 oC overnight.
2 μl ligation product was added to the 100 μl ECOSTM 101 competent cells (storage at -80 oC, Yeastern Biotech, Taipei). Placed on ice for 30 minutes, heat-shocked for 45 seconds at 42 oC water bath then replaced on ice for 2 minutes. 1 ml SOC medium was added to the tubes containing transformed cells, and then incubated at 37 oC for 1 hour with shaking. The transformation cultures were plated on LB/kanamycin plates (LB Agar/Kanamycin 50, RH: 60% ± 15, CMP) and incubated at 37 oC overnight. A single colony was picked and cultured in LB medium with kanamycin overnight (LB : 10 mg/ml kanamycin = 1000:1). Mini-plasmid extraction kit (VIOGENE) was used to purify the recombinant plasmid DNA, then the size of plasmid was confirmed by 1 % DNA agarose gel electrophoresis. After confirming the sequences by commercial company, the recombinant plasmid DNAs were stored at -20 oC.
B. Production of protein of RM-CK and M1-CK mutants
2μl recombinant plasmid DNA was added to 100 μl ECOSTM21 competent cells (storage at -80 oC, Yeastern Biotech, Taipei). Placed on ice for 30 minutes, heat-shocked for 45 seconds at 42 oC water bath then replaced on ice for 2 minutes. 1 ml SOC medium was added to the tubes containing transformed cells, and then incubated at 37
oC for 1 hour with shaking. The transformation cultures were plate on LB/kanamycin
27
plates (LB Agar/Kanamycin 50, RH: 60% ± 15, CMP) and incubated at 37 oC overnight.
A single colony was picked and cultured in 100 ml LB medium with 100 μl kanamycin (10 mg/ml) at 37 oC overnight. Next day, it was added to 900 ml LB with 1000 μl kanamycin (10 mg/ml), incubated at 37 oC for 4 hour with shaking, and then 1000 μl IPTG (0.4M) was added, incubated at 37 oC for 1.5 hour with shaking. The culture medium was centrifuged for 30 minutes, supernatant discarded and pellet resuspended in 20 ml binding buffer (5 mM imidazole, 0.5 M NaCl, 20 mM Tris, pH 7.9). After sonication (Time: 5 minutes, Pulse: 10, 05, Amp: 1, 30%, SONICS) and centrifuged at 30 minutes at 4 oC, supernatant was filtrated using a 0.2 μm filter (Sartolab B/T, 150, 0.2 PES, R/FST, Sartorius, made in USA) and applied in to a nickel column.
The nickel column was prepared previous day. The histag binding agarose was purchased from Bioman (Cat No: PBP001.100), and filled with 1x charge buffer overnight. Before protein purification, charge buffer was replaced by 1x binding buffer.
The target protein was eluted with elution buffer (0.2 M imidazole, 0.5 M NaCl, 20 mM Tris, pH 7.9), and it was eluted between 200 mM to 300 mM imidazole. The experiment was conducted at 4 oC.
Elution product was dialysed in 30 mM Tris, 10 mM MgCl2, 1 mM DTT, pH 7.1 at 4
28
oC for at least 36 hours. The dialysis membrane was purchased from Spectrum
Laboratories, Inc. (MWCO:6-8000, reorder no:132 660). After dialysis, the protein was concentrated with an Amicon Ultra 15 filtration tube (MWCO: 10000, Millipore Corp., Billerica, MA, USA). The concentrated protein solution was mixed with protein storage buffer in the ratio of 2/3 (v/v), and storage at -30 oC. The final protein storage condition was 30 mM Tris, 10 mM MgCl2, 1 mM DTT and 50% glycerol. Protein concentration was estimated by Coomassie plus protein assay reagent (Thermo, standard source:
bovine serum albumin, concentration: 2.0 mg/ml in a 0.9 % aqueous). The spectrophotometric absorption was measured at 595 nm (Synergy HT ELISA Reader, BIO-TEK).
C. Specific activity assay
M-CK specific activity assay was based on the method described by Hughes and modified to fit different assay conditions (Hughes, 1962). Since the Sigma M-CK activity assay kit (SIGMA Diagnostic, No. 520; Sigma-Aldrich. St Louis, MO, USA), which was used in our previous studies, was no longer available. Therefore, we prepared all chemicals and all stock solution as mention in the Sigma M-CK activity assay kit.
The basal reaction buffer of M-CK activity assay was 30 mM Tris, 10 mM MgCl2,
29
and 1 mM DTT (1,4-Dithio-DL-threitol). Assay buffer pHs were adjusted to 7.1, 7.4, 7.7 or 8.0 at either 40 °C, 35 °C, 30 °C, 25 °C, 20 °C, 15 °C, 10 °C or 5 °C. The pH of the assay buffers were adjusted by titration with HCl, at the assay temperatures.
25 μl 3x activity assay buffer (90 mM Tris, 30 mM MgCl2, and 3 mM DTT), 25 μl 40mM PCr and 25 μl 3.2 mM ADP were added to 1.5 ml microcentrifuge tube (Axygen, MCT-175-C). After preincubated 15 minutes in water bath, 5 μl enzyme (2.5 μg/ml, dilute with 1x activity assay buffer) was added to the tube, but blank was added 5 μl 1x activity assay buffer. The final reaction condition was 12.5 mM PCr, 1 mM ADP and 0.0125 ng enzyme in the reaction solution of 80 μl. After 15 minutes, the reaction was terminated with 20 μl stop solution (50 Mm p-hydroxyl-mercuribenzoate), then 100 μl α-naphthol (2%, w/v) and 100 μl diacetyl (1:200, v/v) were added for the colorimetric reaction. Finally, 700 μl d.d.H2O was added and mixed, then incubated at 37°C for 15 minutes. Centrifugation for 5 minutes, 300 μl supernatant added to 96 microwell (Thermo, nuncTM) and spectrophotometric absorption was measured at 520 nm (Synergy HT ELISA Reader, BIO-TEK). Creatine produced in each reaction was quantified using a creatine standard curve (0.08, 0.064, 0.048, 0.032, 0.016, 0, μ mole) and specific activity U was defined as 1 μmole of creatine formed per min per mg of enzyme. All the reactions were repeated at least 3 times and with more than 1 batch of recombinant proteins.
30
D. Kinetic assay and data analysis
Kinetic analyses of CKs were carried out as described in Cleland (1979) (Cleland, 1979). The enzyme specific activity assays for biochemical kinetic analysis of CKs were carried out only at pH 7.1 and 8.0, and at either 35 °C, 25 °C, 15 °C or 5 °C. ADP concentration range was from 0.1 to 2 mM and PCr was at 120 mM when determining the KmADP. PCr concentration range was from 0.5 to 120 mM and ADP was at 2 mM when determining the KmPCr. In each reaction, 6 ng of enzyme was added, and the reaction time was 7 minutes for the 35 °C reaction, 15 minutes for the 25 °C and 15 °C reactions and 45 minutes for the 5°C with volume of 40 μl each. Kcat, KmADP and KmPCr
were calculated using the double reciprocal plot of Michaelis–Menten equation (Marangoni, 2003).
v = Vmax (S) (Km + (S) )-1,
where v was reaction rate obtained from Cr formation rate, (S) was the initial
concentration of one of the substrates, while the other substrate concentration was fixed, Vmax is defined as the maximum reaction velocity.
Vmax = kcat (Etotal),
where Etotal = total enzyme concentration.
In the steady-state case, v-1=Km(S)-1Kcat-1 (Etotal)-1+kcat-1 (Etotal)-1, and the graph v-1v.
(S)-1 was plotted.
31
On the graph, when (S)-1 = 0, v-1 = kcat (Etotal)-1, and when v-1 = 0, (S)-1 = -Km-1
All the reactions were repeated at least 3 times and with more than 1 batch of recombinant proteins. Molecular weights were calculated using the ExPASy Proteomics Server website (Swiss Institute of Bioinformatics), and concentrations of enzymes were calculated using these data.
E. Thermal stability assay
Thermal stability experiments were carried out in the activity assay buffer (30 mM Tris, 10 mM MgCl2, and 1 mM DTT) at pH 7.1 or 8.0. Enzyme was diluted with 1x activity assay buffer to 2.5 μg/ml, and then preincubated at 10, 20, 30, 40, 50, 60 or 70°
C for 30 min, then, cooled on ice.
25 μl 3x activity assay buffer (90 mM Tris, 30 mM MgCl2, and 3 mM DTT), 25μl 40mM PCr and 25μl 3.2 mM ADP were added to 1.5 ml microcentrifuge tube (Axygen, MCT-175-C). After preincubated 15 minutes at 35°C at water bath, 5 μl enzyme was added to the tube, but blank was added 5 μl 1x activity assay buffer. The final reaction condition was 12.5 mM PCr, 1 mM ADP and 0.0125 ng enzyme in the reaction solution of 80 μl. After 15 minutes reaction at 35° C, the reaction was terminated with 20 μl stop solution (50 Mm p-hydroxyl-mercuribenzoate), then 100 μl α-naphthol (2%, w/v) and
32
100 μl diacetyl (1:200, v/v) were added for the colorimetric reaction. Finally, 700μl d.d.H2O was added and well mixed, then incubated at 37°C for 15 minutes.
Centrifugation for 5 minutes, 300 μl supernatant added to 96 microwell (Thermo, nuncTM) and spectrophotometric absorption was measured at 520 nm (Synergy HT ELISA Reader, BIO-TEK). Creatine produced in each reaction was quantified using a creatine standard curve (0.08, 0.064, 0.048, 0.032, 0.016, 0, μ mole)
At least three repeats were carried out, and the highest specific activity was taken as 100% (Zhao et al., 2006a). The specific activities of all the M-CKs in each condition were assayed from three different batches of recombinant protein preparation and each preparation assayed for more than three times.
F. Circular dichroism
Circular dichroism (CD) spectra were recorded on a Jasco J715 spectropolarimeter (Jasco International, Tokyo, Japan) at temperatures 35 °C, 25 °C, 15 °C or 5 °C (Kelly et al., 2005). For far-UV spectrum, a 1 mm path length quartz cuvette (Hellma Analytics, order number: 165-1-40, type: 165-QS) was used at a scan speed of 20 nm.min−1 from 200 nm to 250 nm. The solution for CD contained 2.32 μM of M-CK protein in activity assay buffer at pH 7.1 or 8.0, in the absence of ADP and PCr. Data were collected per 0.1 nm and an average of 8 spectra were corrected by subtraction of
33
spectra recorded on the activity assay buffer in the absence of enzyme.
G. Structure modeling
Since the crystal structure of RM-CK and RM-CK G268N had been resolved (Rao et al., 1998; Wu et al., 2011), and the primary sequences of RM-CK and M1-CK share 86% identity, therefore, we could use RM-CK as template to modeling the 3D structure of RM-CK mutants, M1-CK and M1-CK mutants.
Since M-CK is highly conserved enzyme, the homology modeling methods was used to model the structure of our target proteins (Marti-Renom et al., 2000), and the MODELLER is the free program to carry out homology modeling for model building (Eswar et al., 2007; http://salilab.org/modeller/). The template for build structure was the PDB 2CRK (Rao et al., 1998). The output 3D structures were displayed by the free program included PyMol (DeLano, W.L. The PyMOL Molecular Graphics System (2002) DeLano Scientific, San Carlos, CA, USA; http://www.pymol.org.), Swiss-PdbViewer (Guex and Peitsch, 1997; http://www.expasy.org/spdbv/). The solvent accessible surface of each residue was calculated by free program MolMol (Koradi et al., 1996), and the Cα distances were calculated by Swiss-PdbViewer.
34
Results
A. Construction of site-directed mutagenesis of RM-CK and M1-CK mutants
Using RM-CK-pET28a or M1-CK-pET28a as template, the 268 residue mutants were constructed by overlap-extension technique. The PCR product and pET28a were double digestion with NdeI and XhoI. After purified by gel extraction, the DNA fragment was ligated to the pET28a vector (Fig. 1). These resulting plasmids were designated as RM-CK G268N, RM-CK G268D, RM-CK G268K, RM-CK G268L, M1-CK N268G, M1-CK N268D, M1-CK N268K, M1-CK N268L. The inserted DNA fragment was 1146 base pairs; pET28a was 5369 base pairs and the total size of recombinant plasmid was 6834 base pairs(Fig 1). The plasmids were storage at -20 oC.
B. Production of protein of RM-CK and M1-CK mutants
The recombinant plasmids were transformed in to ECOSTM21 competent cells to express the recombinant protein. The protein were applied in to a nickel column and eluted with elution buffer (0.2 M imidazole, 0.5 M NaCl, 20 mM Tris, pH 7.9). The recombinant protein appeared at 200 mM and 300 mM imidazole (Fig. 2). All the mutant proteins are the same size as the wild-type protein, about 45 kDa (Fig. 3). After
35
dialysis in 30 mM Tris, 10 mM MgCl2, 1 mM DTT, pH 7.1 at 4 oC, the proteins were concentrated with Amicon Ultra 15 filtration tubes. The concentrated protein solution was mixed with protein storage buffer and storage at -30 oC. The final protein storage condition was 30 mM Tris, 10 mM MgCl2, 1 mM DTT and 50% glycerol.
C. Specific activity assay
Polar side chain of residue 268 of muscle form creatine kinase show higher activity
at low temperature
The residue 268 of M1-CK and RM-CK were mutated to glycine, asparagine, aspartic acid, lysine or leucine, individually. M-CK specific activity assay was based on the method described by Hughes and modified to fit different assay conditions (Hughes, 1962). The specific activities were assayed at pHs 7.1, 7.4, 7.7 or 8.0 at either 40 °C, 35
°C, 30 °C, 25 °C, 20 °C, 15 °C, 10 °C or 5 °C.
The four M1-CK mutants showed different pH-temperature specific activity patterns compared to wild-type M1-CK (Fig 4). M1-CK, M1-CK N268D, M1-CK N268G, M1-CK N268K and M1-CK N268L showed their highest specific activity of 445 ± 42.44 U, 446 ± 40.75 U, 385 ± 41.48 U, 364 ± 22.27 and U 305± 32.2 (mean ± S.D.), respectively, at pH 7.1 and 30 °C (Table 4).
At pH 7.1 and 7.4, M1-CK had highest activity at 30 °C, and started to decrease at
36
temperature > 30 and <30 °C, but still remain >100 U activity at 15 and 10 °C. At pH 7.7, M1-CK had highest activity of 151 ± 4.82 at 30 °C and 143 ± 7.4 U at 15 °C, and still remain 95.5± 5.54 U at 10 °C. At pH 8.0, M1-CK was able to maintain its activity around 70 U at 15 and 10 °C. Activity trend of M1-CK N268G was similar to M1-CK at pHs 7.1, 7.4 and 7.7, but lower at all temperature. At pH 8.0, compared to M1-CK, M1-CK N268G was 22% and 34% less active at 15 and 10 °C, respectively. M1-CK N268D was the mutant enzyme of highest activity at 35 and 30°C at all pHs, and maintained activity of 127± 3.2 and 90.6 ± 3.87 at 15 and 10 °C, respectively at pH 7.7.
At pH 8.0, compared to M1-CK, M1-CK N268D was 11.5 % and 13 % less active at 15 and 10 °C, respectively. The activity of M1-CK N268K was lower than M1-CK N268D and almost the same as M1-CK N268G at 15 °C at either pH 7.7 or 8.0 and at pH 8.0, at 10 °C. At pH 8.0, at 10 °C, activity of M1-CK N268K was lower than M1-CK N268D and higher than M1-CK N268G, and it was 24% less activity compared to M1-CK.
M1-CK N268K and M1-CK N268D could recover activities at 15 °C of all pHs and at 10 °C, pH 8.0. M1-CK N268L showed the same activity pattern as M1-CK N268G at low temperature. M1-CK N268L showed the lowest activity and was 62.8 %, 39.7 %, 55 % and 67 % less activity compared to M1-CK at 15 and 10 °C at either pH 7.7 or 8.0, respectively.
The four RM-CK mutants also showed different pH-temperature specific activity
37
patterns compared to the wild-type (Fig 5). RM-CK, RM-CK G268N, RM-CK G268K, RM-CK G268D, and RM-CK G268L showed their highest specific activity of 352.76 ± 24 U, 436.5 ± 7.1 U, 407.6 ± 1.1 U, 401.2 ± 3.7 U, and 314.5 ± 4.6 U (mean ± S.D.), respectively, at pH 7.1 at 35 °C (Table 5).
RM-CK had higher activity around 35 to 25°C and decreases as temperature decreased. At pH 8.0 at 10°C, RM-CK lost 92% of its activity (29 ± 3.1 U). RM-CK G268N showed the similar activity pattern as RM-CK at high temperature (40 to 25 °C), but had higher activity than RM-CK at low temperature (15 and 10°C) at pHs 7.7 and 8.0. At pH 7.7, RM-CK G268N showed 50% higher activity compared to RM-CK at 10°C. RM-CK G268N, as M1-CK, maintained its activity of 66.2± 7.6 U and showed 56% higher activity compared to RM-CK at pH 8.0, at 10°C. RM-CK G268D and RM-CK G268K had higher activities than RM-CK and RM-CK G268L at all pHs and temperatures, and their activities were similar to RM-CK G268N excepted at 10°C, at pHs 7.7 and 8.0. The activity of RM-CK G268L was the same as RM-CK at pH 7.7, at low temperature (15 to 5°C). At pH 8.0 at 10°C, RM-CK G268L showed lowest activity than other.
A polar side chain of residue 268 of muscle-form creatine kinase showed higher activity than non-polar residue at low temperature (15 and 10 °C), at high pHs (7.7 and 8.0).
38
D. Kinetic assay
Polar side chain of residue 268 could maintain stable Km and Kcat or increased Kcat..
The kinetic parameters, KmADP, KmPCr, KcatADP, KcatPCr, of each enzyme were assay at 35, 25, 15 and 5°C at either pH 7.1 or 8.0.
The KmADP trend of M1-CK N268G resembled that of M1-CK N268K at pH 7.1, but lowers all temperature (Fig 6). At pH 7.1, M1-CK, M1-CK N268D and M1-CK N268L had similar KmADP pattern. At pH 8.0, M1-CK N268G, M1-CK N268K and M1-CK N268L showed similar KmADP pattern and M1-CK N268L was the lowest. M1-CK kept its KmADP at different temperatures but rose slightly at 5°C at pH 8.0. M1-CK N268D had similar KmADP to others except at 15°C, at pH 8.0.
At pH 7.1, the KmADP of RM-CK and its mutants were not significantly different at all temperatures expect RM-CK G268D was lower than RM-CK and other mutants at 35°C (Fig 8). At pH 8.0, RM-CK G268K resembled that of RM-CK G268L and higher at all temperatures, both of these two mutants maintained their KmADP at 35, 25 and 15°C but decreased at 5°C. The KmADP of RM-CK and RM-CK G268D decreased at 25°C then maintained it as temperature decreased. RM-CK G268N maintained its KmADP at pH 8.0 at all temperatures.
At pH 7.1, the KmPCr of M1-CK and its mutants increased as temperature decreased (Fig 6). At pH 7.1, from 25 to 5°C, M1-CK N268G had highest KmPCr and M1-CK had
39
lowest KmPCr. M1-CK N268D, M1-CK N268K and M1-CK N268L were not significantly different at pH 7.1 from 25 to 5°C. At pH 8.0, M1-CK N268G showed no significantly difference with M1-CK N268D at all temperatures, and M1-CK N268L was higher than them at 25 and 15°C. At pH 8.0, M1-CK was slightly decreased as temperature decreased, but generally speaking, maintained its KmPCr at all temperatures.
M1-CK N268K showed highest KmPCr at 35 and 25°C but decreased at 15 °C at pH 8.0.
At pH 7.1, the KmPCr of RM-CK and its mutants increased as temperature decreased except RM-CK G268N (Fig 8). At pH 7.1, RM-CK G268N maintained its KmPCr at 15 and 5°C. At pH 8.0, the KmPCr of RM-CK and RM-CK G268N decreased slightly as temperature decreased, on the other hand, those of RM-CK G268K and RM-CK G268L also decreased slightly as temperature decreased but increased at 5°C. At pH 8.0, KmPCr
of RM-CK G268D decreased more significantly than other mutants when temperature decreased. KmPCr of RM-CK and mutants were no significantly different at 15°C, pH 8.0.
At pH 7.1, the KcatADP of M1-CK and mutants decreased as temperature decreased, but, unlike other four mutants decreased sharply, M1-CK decreased gently (Fig 7). At pH 8.0, M1-CK could maintain its KcatADP when temperature changed; KcatADP of M1-CK N268G decreased slightly as temperature decreased. The KcatADP of M1-CK N268D, M1-CK N268K and M1-CK N268L undulated at pH 8.0.
40
At pH 7.1, KcatADP of RM-CK and mutants decreased as temperature decreased, and there was no significantly difference at 25, 15 and 5°C (Fig 9). At pH 8.0, KcatADP of RM-CK and mutants also decreased as temperature decreased, and there was not significantly difference at 35 and 5°C. At pH 8.0, at 25 and 15 °C, they also showed the same KcatADP except that of RM-CK G268K was higher than other.
The KcatPCr of M1-CK and mutants decreased as temperature decreased, at pH 7.1, and compared to other mutants, M1-CK decreased more gently (Fig 7). The KcatPCr of M1-CK N268D resembled that of M1-CK N268K at pH 7.1. At pH 8.0, M1-CK could maintain its KcatPCr as temperature decreased; M1-CK N268G also could maintain its KcatPCr at 35, 25 and 15°C, but decreased at 5°C. At pH 8.0, KcatPCr of M1-CK N268D, M1-CK N268K and M1-CK N268L were decreased as temperature decreased, but at 25°C, KcatPCr of M1-CK N268K and M1-CK N268L increased significantly.
The KcatPCr of RM-CK and mutants decreased as temperature decreased, at pH 7.1, and RM-CK G268K was not significantly different with RM-CK G268L at all temperature (Fig 9). At pH 8.0, KcatPCr of RM-CK and mutants also decreased as temperature decreased.
At pHs 7.1 and 8.0, M1-CK and RM-CK G268N could maintain relatively stable Km
and Kcat at all temperature. The Km and Kcat of M1-CK N268D, RM-CK G268D, M1-CK N268K and RM-CK G268K varied at pH 8.0, but, M1-CK N268K and RM-CK
41
G268K, showed higher values of Kcat at pH 7.1 and 8.0. RM-CK and M1-CK N268G also had relative low variation of Km and Kcat, but compared to M1-CK and RM-CK G268N, their variations were more significantly. The Km and Kcat of M1-CK N268L and RM-CK G268L were more similar to M1-CK N268K and RM-CK G268K at most conditions, but always lower. Generally speaking, polar side chain of residue 268 could maintain stable Km and Kcat as temperature change or with increased Kcat..
E. Thermal stability assay
Polar side chain of residue 268 of M-CK were more stable than non-polar mutants
Thermal stability experiments were carried out at pHs 7.1 or 8.0. Enzyme was incubated at 10, 20, 30, 40, 50, 60 or 70 °C for 30 minutes before assay at 35°C. The highest specific activity was taken as 100%, and when the activity decreased to 50%, the temperature was called denatured temperature (Zhao et al., 2006a).
At pH 7.1, RM-CK G268N and all other mutants exhibited denatured temperatures between 37 to 40 °C, while that of the wild type was 42 °C (Fig 10). At pH 8.0, the thermal stability of polar side chain of residue 268 improved. RM-CK G268N, RM-CK G268D and RM-CK G268K exhibited denatured temperatures between 32 to 37 °C at pH 8.0, whereas those of RM-CK and RM-CK G268Lwere between 23 to 28 °C at pH 8.0.
42
M1-CK and its mutants, except M1-CK N268L, exhibited denatured temperatures between 40 to 45°C at pH 7.1 and between 32 to 37 °C at pH 8.0 (Fig 11). M1-CK N268L exhibited denatured temperatures between 32 to 37 °C at pH 7.1 and between 25 to 30°C at pH 8.0.
F. Circular dichroism
Secondary structures were no significant change between wild type and mutant
proteins
Circular dichroism (CD) spectra were recorded at pH 7.1 or 8.0 at temperatures 35 °C, 25 °C, 15 °C or 5 °C (Kelly et al., 2005).
M1-CK and its mutants could maintain their secondary structures at 7.1 or 8.0 at all
temperature (Fig 12). At pH 7.1, M1-CK and M1-CK N268L showed different CD pattern than other mutants at 25 and 5 °C. At pH 8.0 at 25 °C, M1-CK showed different CD pattern than other mutants. RM-CK and its mutants could maintain their secondary structures during temperature change expect RM-CK G268K. RM-CK G268K could not maintain its secondary structures as temperature decreased (Fig 13).