國立陽明交通大學 數據科學與工程研究所
碩士論文
Institute of Data Science and Engineering National Yang Ming Chiao Tung University
Master Thesis Dissertation
MapTalk2.0:物聯網應用的整合行動中心
MapTalk2.0: Integrated Operation Center for IoT Applications
研究生:童柏勛 (Tung, Po-Hsun) 指導教授:林一平 (Lin, Yi-Bing)
張明峰 (Chang, Ming-Feng)
中華民國 一一○ 年 七 月
July 2021
MapTalk2.0:物聯網應用的整合行動中心
MapTalk2.0: Integrated Operation Center for IoT Applications
研 究 生:童柏勛 Student : Po-Hsun Tung
指導教授:林一平 教授 張明峰 教授
Advisors : Yi-Bing Lin Ming-Feng Chang
國立陽明交通大學 數據科學與工程研究所
碩士論文
A Thesis
Submitted to Institute of Data Science and Engineering College of Computer Science
National Yang Ming Chiao Tung University in partial Fulfillment of the Requirements
for the Degree of Master
in
Computer Science
July 2021
Hsinchu, Taiwan, Republic of China
中華民國 一一○年七月
i
MapTalk2.0:物聯網應用的整合行動中心
學生:童柏勛 指導教授:林一平 教授
張明峰 教授
國立陽明交通大學數據科學與工程研究所碩士班
摘 要
在新型冠狀病毒的傳播下,零接觸產業的需求帶動起物聯網應用的蓬勃發展。然而 大部分的物聯網應用面臨數據呈現繁雜、零散且對使用者不友善的或是不同應用之間難 以合併的問題。針對此問題本論文提出 MapTalk2.0 物聯網應用的整合行動平台。
MapTalk2.0 結合 Google Map 的智慧地圖平台,旨在整合數據進而利用數據採取行 動,並可以快速佈建個人化的聯網數位地圖。MapTalk2.0 整合的應用包含即時車速與事 故警告、追蹤定位、路徑規劃、電子圍籬等多種應用,涵蓋了交通、校園、農業、安防 領域。MapTalk2.0 具有高度擴充性與易用性,使用者可以輕鬆的建造自己的物聯網戰情 中心,透過電腦或是行動裝置就可以操作 MapTalk2.0。此論文說明 MapTalk2.0 的功能 和相關的應用。
關鍵字:物聯網、整合行動中心、感測器、Google Map、物聯網裝置應用、電子圍籬
ii
MapTalk2.0: Integrated Operation Center for IoT Applications Student : Po-Hsun Tung Advisors : Yi-Bing Lin Ming-Feng Chang
Institute of Data Science and Engineering National Yang Ming Chiao Tung University
Abstract
With the spread of the new coronavirus, the zero-touch industry demand has strongly driven the vigorous development of Internet of Things (IoT) applications. However, most of the IoT applications face the problems of complex, fragmented and unfriendly data for users, which result in difficulties for merging different applications. To solve this problem, this thesis proposes MapTalk2.0, an Integrated Operation Center (IOC).
MapTalk2.0 is a smart map platform developed based on Google Map. It aims to quickly deploy a personalized digital map to integrate different data and then use the data to take actions. Current version of MapTalk2.0 has integrated applications include real-time highway speed and accident, tracking and positioning, route planning service, electronic fence and other applications covering transportation, campus, agriculture, and security. MapTalk2.0 is highly expandable, flexible and easy to use. Users can easily build their own IOC and operate it through PCs or mobile devices. This thesis explains the functions and related applications of MapTalk2.0.
Keywords: Internet of Things (IoT), Integrated Operation Center (IOC), Sensors, Google Map, IoT device application, Electronic Fence
iii
誌 謝
首先感謝我的指導老師林一平教授,在研究所的兩年期間,教導了我研究的正確方 式與態度。在研究和論文的撰寫過程中,老師會仔細的檢閱內容並引導我往正確的方向 前進。同時,老師鼓勵我參加與研究相關的比賽,讓我的研究能和業界交流並學習到如 何介紹自己的作品及增廣視野。
接者,我想感謝張明峰教授和林勻蔚教授。感謝張教授在我剛進碩一的時候給了我 很多建議,讓我能更快適應研究所的步調。感謝林教授在研究過程中提供許多想法,在 遇到問題的時候,也很樂意的和我一起思考解決的方法。
最後感謝實驗室的同學們,感謝泰翔和峻頤學長的照顧,除了協助我熟悉實驗室的 系統之外,他們也幫助我解決了在程式開發上遇到的問題。感謝俊凱和大賢學長,謝謝 俊凱學長帶我加入 PCS Lab 大家庭,讓我剛進研究所的徬徨少了很多。謝謝大賢學長告 訴我很多實驗室注意要點和幫助我解決每次開會前的擔憂。感謝薪雅學姊,在我還沒進 實驗室的時候,願意花時間教我實驗室的系統。感謝我的同屆實驗室夥伴們昀諠、彧豪、
尹睿、子翔、柏妍,非常開心能和你們一起成長與研究,大家能一起玩樂也能一起認真,
很幸運能在研究所期間遇到志同道合的朋友。
人生就是不停地做決定,而研究所的這兩年,是個不悔的決定。
童柏勛 於 國立陽明交通大學數據科學與工程研究所 中華民國 一一零年七
iv
Contents
摘 要 ... i
Abstract ... ii
誌 謝 ... iii
Contents ... iv
List of Figures ... vi
Chapter 1. Introduction ... 1
Chapter 2. MapTalk2.0 Architecture ... 4
Section 2.1. The IoTtalk Overview ... 4
Section 2.2. Integrating IoT Applications into MapTalk2.0 ... 6
Section 2.3. The MapTalk2.0 Architecture ... 8
Chapter 3. Function Extension of MapTalk2.0 ... 13
Section 3.1. The Cyber Objects ... 13
3.1.1. Enhancing the Attributes of a Cyber Object ... 15
3.1.2. The Warning Mechanism ... 22
3.1.3. Implementation of “Show All” Item ... 25
Section 3.2. The Route Planning Service ... 28
3.2.1. The Rerouting Service ... 28
Chapter 4. The Freeway No. 5 Information ... 31
Section 4.1. The Real-time Speed Application ... 31
4.1.1. Application Setup on MapTalk2.0 ... 31
4.1.2. Project Setup on IoTtalk ... 33
Section 4.2. The Real-time Accident Application ... 37
4.2.1. Application Setup on MapTalk2.0 ... 37
v
4.2.2. Project Setup on IoTtalk ... 39
Chapter 5. Electronic Fence Service ... 42
Section 5.1. Administrator Setup ... 43
Section 5.2. User Operation ... 45
5.2.1. Tracking Mobile App ... 45
5.2.2. Website Registration ... 48
Section 5.3. Features of the Electronic Fence Service ... 50
5.3.1. Entry and Leaving Detection ... 50
5.3.2. Emergency Notification ... 51
5.3.3. Historical Trajectory Record ... 52
Chapter 6. Conclusion ... 54
Reference ... 57
vi
List of Figures
Figure 2.1 IoTtalk project GUI. ... 5
Figure 2.2 The join function interface in IoTtalk. ... 5
Figure 2.3 IDF/ODF setting page in IoTtalk. ... 6
Figure 2.4 Map device’s five attributes in IoTtalk IDF monitor. ... 7
Figure 2.5 The number of Covid-19 deaths on MapTalk2.0. ... 8
Figure 2.6 Covid-19 application configured in the IoTtalk project GUI... 8
Figure 2.7 The architecture of MapTalk2.0. ... 9
Figure 2.8 The circular geographic object and its info window on MapTalk2.0. ... 10
Figure 2.9 Route planning service on MapTalk2.0. ... 11
Figure 3.1 Science Park IoT applications on MapTalk2.0... 14
Figure 3.2 The structure of cyber object. ... 15
Figure 3.3 Different layouts of cyber objects. ... 16
Figure 3.4 The polygonal objects. ... 16
Figure 3.5 The southbound speed of freeway No.5 on MapTalk2.0. ... 18
Figure 3.6 Offline time-out setting on MapTalk2.0. ... 19
Figure 3.7 Offline cyber objects with black edges on MapTalk2.0. ... 19
Figure 3.8 The admin page of pm2.5 application and the status of cyber objects... 19
Figure 3.9 The trajectory of a tracked object on MapTalk2.0. ... 20
Figure 3.10 The warning mechanism field on admin webpage. ... 20
Figure 3.11 The pm2.5 application on admin webpage. ... 22
Figure 3.12 The stationary object creation and setup. ... 23
vii
Figure 3.13 The five attributes of the accident application in IoTtalk IDF. ... 24
Figure 3.14 The warning icon on the map. ... 25
Figure 3.15 The “Show All” item in drop-down list. ... 26
Figure 3.16 The “Show All” item cannot set the viewport on MapTalk. ... 26
Figure 3.17 The JavaScript code for the “Show All” function. . ... 27
Figure 3.18 The “Show All” item sets the viewport on MapTalk2.0. ... 28
Figure 3.19 The user deviates from the planned route. ... 29
Figure 3.20 The rerouting service provides a new route for the deviated user. ... 30
Figure 4.1 The setting of the speed application. ... 32
Figure 4.2 The color range dialog box. ... 32
Figure 4.3 The setting of the cyber object. ... 33
Figure 4.4 The real-time video on Freeway No.5. ... 33
Figure 4.5 The device model window. ... 34
Figure 4.6 The device feature window. ... 35
Figure 4.7 The project configuration. ... 36
Figure 4.8 The speed data in the IDF monitor. ... 36
Figure 4.9 The “Freeway5S” application on MapTalk2.0. . ... 37
Figure 4.10 The setting of the accident application. ... 38
Figure 4.11 The picture URL dialog box. ... 38
Figure 4.12 The device model window. ... 39
Figure 4.13 The device feature window. ... 40
Figure 4.14 The project configuration. ... 40
Figure 4.15 The real-time accident application on MapTalk2.0. ... 41
viii
Figure 5.1 The electronic fence service on MapTalk2.0. ... 42
Figure 5.2 The fence creation. . ... 43
Figure 5.3 The setting of the fence. ... 44
Figure 5.4 The intersection alert box. ... 45
Figure 5.5 The homepage of the tracking app. ... 46
Figure 5.6 The tracking application on MapTalk2.0. ... 47
Figure 5.7 The function of the tracking app. ... 48
Figure 5.8 The registration dialog box on the tracking website. ... 49
Figure 5.9 The tracking application on MapTalk2.0. ... 50
Figure 5.10 The detailed LINE message information. ... 51
Figure 5.11 The fence application on MapTalk2.0. ... 52
Figure 5.12 The history dialog box. ... 53
1
Chapter 1. Introduction
In the recent years, IoT technology has impact on several aspects of ours everyday-life [1]. For example, HVAC (Heating, Ventilation, and Air Conditioning) monitoring and control system play a remarkable role in smart home application [2]. In [3], the authors present smart community paradigm which is multihop network of smart homes that are interconnected through communication protocols. Therefore, IoT enables physical objects in real world to be converted into cyber objects in network, which can communicate and cooperate with each other. According to [4], the number of Internet connected devices had surpassed the total human’s population in 2010. Therefore, in this “Everything as a Service” world, how to manage and display these tens of thousands of interconnected devices and diverse IoT applications will be important issue and challenge [5].
Many studies proposed various approaches to resolve this issue, and digital map is one of them. In [6], the authors used NodeMCU equipped with GPS modules to receive the location of different devices and displayed them on the Google Map. At the same time, adding the Arduino library made it easier for NodeMCU to connect to the IoT platform which was proposed by the authors. The work in [7] developed an IoT based parking system to solve problems that may be caused by drivers looking for parking spaces, including air pollution, accident and increased commuting time. Supriya Shinde, et al. [7] proposed to use wireless sensor nodes to detect whether there was a vehicle in the parking space, and then used the Android application and Google Map API to present the result. In [8], Michal and Wojciech took driver application for example to illustrate that it was not difficult to build a web
2
application in .NET technology based on Google Map services. In [9], the authors used IoT technology to locate patient with dementia through Google Map, which not only allowed the patient’s family members to know the location accurately, but also displayed the historical record of the patient’s position. This method was to reduce the risk of missing a person with disease.
The above studies show the power of the digital map application and its role in the IoT.
In particular, the geographic information of interconnected device is very important for management and presentation. We also find that most digital map use Google Map as a platform. Thanks to the diversified services and convenient JavaScript API provided by Google Map, the developers have rich resources and a friendly development environment.
However, developing a new map application including the data transmission system and the user interface based on above approaches requires a lot of effort in programming. In order to solve this challenge, we proposed the MapTalk solution [10] in the past. From the perspective of the IoT, MapTalk regarded digital map as a cyber world, where users can quickly add their own applications and different interconnected objects. With the rapid development of IoT, we propose enhanced version MapTalk2.0 to focus on developing different applications on the platform, expanding platform functions, and enhancing platform execution capabilities. MapTalk2.0 provides a friendly user interface where user can quickly add IoT and geographic information management applications, such as all-Taiwan weather observatories, helping farmers manage different farms at the same time. The diversified cyber objects also allow users to use this platform more flexibly. MapTalk2.0 carries the advantages of the past version and has been practically applied in various fields, integrating diversified
3
applications, allowing the platform not only to present data but to become an Integrated Operation Center (IOC), serving as a command center for users.
MapTalk2.0 provides a fast and convenient way to build IoT applications and take action on the digital map. This thesis describes the design and implementation for IoT applications on MapTalk2.0. This thesis is organized as follows. Chapter 2 elaborates the architecture of MapTalk2.0. Chapter 3 describes the extended functions from MapTalk to MapTalk2.0.
Chapter 4 elaborates on the implementation of integrated highway applications. Chapter 5 elaborates on the implementation electronic fence service on MapTalk2.0. Chapter 6 concludes the work.
4
Chapter 2. MapTalk2.0 Architecture
This chapter provides an overview of the IoTtalk architecture [11], and describes how MapTalk2.0 is developed based on IoTtalk. Then we propose the architecture of MapTalk2.0.
Section 2.1. The IoTtalk Overview
MapTalk2.0 uses the IoTtalk system to communicate with IoT devices [12] where the users can quickly create applications with graphical user interface (GUI) in IoTtalk project page (Figure 2.1). For an application project, one or more input and output devices can be added (Figure 2.1 (1)) by creating the corresponding device model icons. Single point connection (Figure 2.1 (2)) or multi-point connection (Figure 2.1 (3)) between the devices can be established by connecting the icons through the “Join” links. After the user has registered the input and output devices on the IoTtalk platform, the data are delivered from the input devices to the output devices through the Join links. If necessary, users can add Python pre-processing or post-processing functions called join functions (Figure 2.2) by clicking the circle of a Join connection (e.g., Figure 2.1 (2)). If it is a multi-point connection (e.g., Figure 2.1 (3)), users can even write more complex functions.
5
Figure 2.1 IoTtalk project GUI.
Figure 2.2 The join function interface in IoTtalk.
MapTalk2.0 is considered as an output device in IoTtalk, and all IoT applications integrated on MapTalk2.0 are considered as input devices. Therefore, based on the above concepts, MapTalk2.0 makes it easier for developers to develop new applications on the
6
digital map through the IoTtalk system.
Section 2.2. Integrating IoT Applications into MapTalk2.0
The physical objects with the input data of the same type are considered as Input Device Features (IDFs), and applications on MapTalk2.0 are considered as Output Device Features (ODFs) through the concept of Device Feature (DF) [13] in IoTtalk. The IDF/ODF format can be set in the IoTtalk system (Figure 2.3 (2) - (6)). The input device models used for MapTalk2.0 have different attributes, so all IDF names will be tagged with ‘-TI’ (e.g., Figure 2.3 (1)) and all ODF names will be tagged with ‘-TO’ (e.g., Figure 2.6 (6)).
Figure 2.3 IDF/ODF setting page in IoTtalk.
To deploy applications on MapTalk2.0 through IoTtalk, the IDF input data must have the following five attributes: Latitude (float), Longitude (float), Name (string), Value (float), Updated Time (string), corresponding respectively x1 to x5 (Figure 2.4 (1) - (5)). According
7
to these five attributes, we can quickly build IoT applications on MapTalk2.0.
Figure 2.4 Map device’s five attributes in IoTtalk IDF monitor.
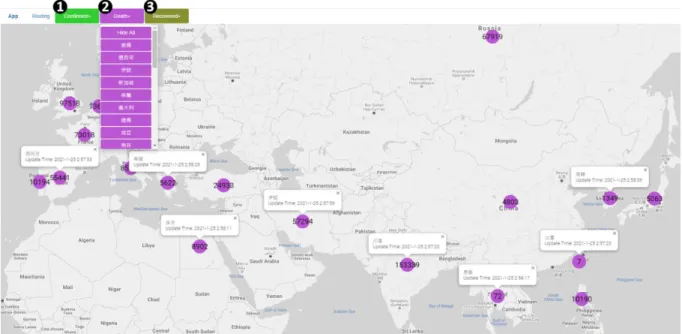
For example, MapTalk2.0 presents the number of confirmed cases, deaths (Figure 2.5), and the recovery of the coronavirus disease in thirty countries. Different types of information are considered as Confirmed-TI, Death-TI, and Recovered-TI (Figure 2.6 (2) – (4)) on IoTtalk, which means that the number of people diagnosed in thirty countries will be represented by Confirmed-TI (Figure 2.6 (2)) in the Covid-19 input device model (Figure 2.6 (1)). The administrator adds Covid-19 applications on the MapTalk2.0 webpage (Figure 2.5 (1) – (3)), and the new applications will generate the corresponding ODFs (Figure 2.6 (6) - (8)) under the Map output device model (Figure 2.6 (5)) in IoTtalk. User only needs to connect the corresponding IDFs and ODFs through the IoTtalk project GUI, and then different types of Covid-19 information can be sent to MapTalk2.0 and display on map simultaneously.
8
Figure 2.5 The number of Covid-19 deaths on MapTalk2.0.
Figure 2.6 Covid-19 application configured in the IoTtalk project GUI.
Section 2.3. The MapTalk2.0 Architecture
Figure 2.7 illustrates the functional blocks of MapTalk2.0. This section describes the function of each functional block and the process of data transmission. The overall
9
architecture of the MapTalk2.0 is an IoT device, which includes two graphical interfaces, a user interface and an administrator interface. MapTalk2.0 mainly communicates with IoTtalk in the IoT Device Application (IDA) (Figure 2.7 (1)). The IDA performs registration, transfers data, and imports Google Map to map devices via Google Map JavaScript API. Different components in IDA communicate with each other and transfer data to complete the operation of the map equipment.
Figure 2.7 The architecture of MapTalk2.0.
The MapTalk2.0 consists of following components.
The IDA Message Handler (Figure 2.7 (2)) is a core component of MapTalk2.0, and
10
its main tasks is to parse the message from IoTtalk, send HTTP requests and receive data. The IDA Message Handler functions include register Map devices to Map server, update the information on MapTalk2.0 according to the administrator operation or data coming from IDFs, and pull the new data from Map’s ODFs.
The Graphic Render (Figure 2.7 (3)) is to change the MapTalk2.0 webpage graphical interface according to different tasks.
The User Event Handler (Figure 2.7 (4)) handles all events triggered by user clicks on MapTalk2.0 webpage. For example, when the user clicks on the circular geographic shape object (Figure 2.8 (1)) in the webpage, the info window (Figure 2.8 (2)) will appear. This execution path is through “User -> (4) -> (3) -> User” in Figure 2.7.
Figure 2.8 The circular geographic object and its info window on MapTalk2.0.
The Google Maps Platform (Figure 2.7 (5)) is provided by Google to support different Map services such as the latitude and longitude of the marker on the MapTalk2.0, the route planning, the marker customization and so on.
11
The Google Message Handler (Figure 2.7 (6)) is to process services provided by Google Map and send HTTP requests to Google server and get the response result.
For example, Route planning service is provided by MapTalk2.0, the user selects the starting point (Figure 2.9 (1)) and the ending point (Figure 2.9 (2)) on the webpage. After clicking “Start Routing” button, MapTalk2.0 will call the destination service provided by the Google Maps Platform, calculate the shortest path, and draw the best route by JavaScript API (Figure 2.9 (3)) on MapTalk2.0 in the end. The above execution path is “User -> (4) -> (6) -> (5) -> (6) -> (3) -> User”
in Figure 2.7.
Figure 2.9 Route planning service on MapTalk2.0.
The Streaming Server (Figure 2.7 (7)) is responsible for providing the monitor
12
streaming. For example, if the user clicks the camera object on MapTalk2.0, the IDA Message Handler will send RTSP request to the streaming server, and the real-time video of the monitor can be displayed on the MapTalk2.0 webpage. The execution path is “User -> (4) -> (2) -> (7) -> (2) -> (3) -> User” in Figure 2.7.
The IoTtalk Server (Figure 2.7 (8)) and the Device Application (DA) (Figure 2.7 (9)) will describe together. In section 2.2, we have introduced implementation of the application in IoTtalk, so IoT applications can establish a connection with MapTalk2.0 through the IoTtalk Server. Each application can be considered as a DA, and then the IDA Message Handler will provide registering, updating, and pulling data.
The Map Server (Figure 2.7 (10)) and the Database (DB) (Figure 2.7 (11)) use ORM API to communicate each other. The Map Server is implemented with Flask, and the DB is used to store the data received from IoTtalk such as five attributes from IDFs (Figure 2.4 (1) – (5)) or the data created by the administrator from MapTalk2.0 webpage.
13
Chapter 3. Function Extension of MapTalk2.0
By extending the basic functions of MapTalk, this chapter introduces the new functions and operations of MapTalk2.0.
Section 3.1. The Cyber Objects
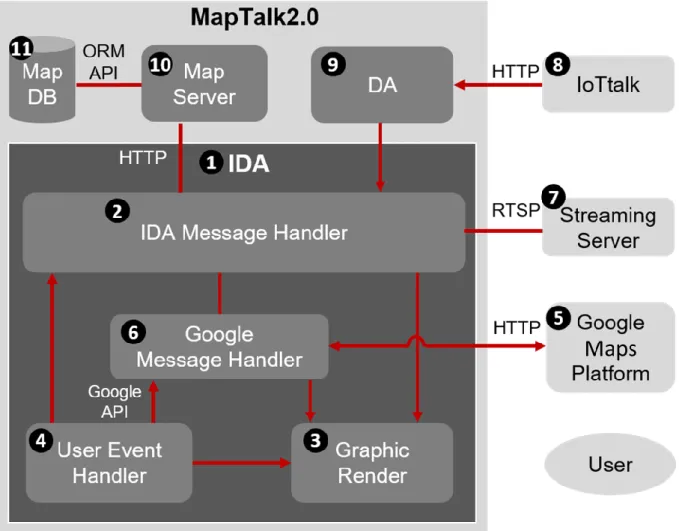
MapTalk is a simple version of Integrated Operation Center (IOC) for efficient administration on intelligent environments. For example, in the Science Parks of Taiwan, the physical objects to be monitored can be water sensors such as chemical oxygen demand (COD) sensor (Figure 3.1 (1)), electrical conductivity (EC) sensor (Figure 3.1 (2)), suspended solids (SS) sensor (Figure 3.1 (3)), and pH sensor (Figure 3.1 (4)). These physical objects are managed by the Science Park technical staff using MapTalk web-based GUI.
In MapTalk, an IoT application (e.g., electrical conductivity map) is represented by a colored button (e.g., EC monitoring application in Figure 3.1 (2)) in the menu bar (Figure 3.1 (5)) of the MapTalk webpage. The menu bar consists three types of buttons: the App button (Figure 3.1 (6)), the routing button (Figure 3.1 (7)), and a colored button (e.g., Figure 3.1 (1)).
One manipulates an application by clicking the corresponding App button in the GUI (Figure 3.1 (6)). The routing button (Figure 3.1 (7)) provides travel route planning service by allowing the user to specify the start and destination locations. The details of the travel route planning service are given in Section 3.2.
The menu bar also provides a colored button (e.g., Figure 3.1 (1) – (4)) for a frequently accessed application. After clicking the colored button, the names of all physical objects
14
belonging to this IoT application will show in drop-down list (Figure 3.1 (8)). For example, when the user clicks the colored button of the sewage plant pH value monitoring application (Figure 3.1 (4)), the names of all sewage plants will appear in the drop-down list (Figure 3.1(8)). When the user selects the item for a sewage plant (Figure 3.1 (9)) in the drop-down list, the pH value of the sewage plant will be shown in the icon placed at the sewage plant location in the map (Figure 3.1 (10)). This icon is called a cyber object, which is a visual representation of physical object.
Through cyber representations of physical objects, users can interact with physical objects in the cyber world (web-based GUI of MapTalk). Therefore, MapTalk2.0 strengthens cyber representation to make the IOC more comprehensive than the one in MapTalk. The details will be described in the following sections.
Figure 3.1 Science Park IoT applications on MapTalk2.0.
15
3.1.1. Enhancing the Attributes of a Cyber Object
Figure 3.2 The structure of cyber object.
Figure 3.2 illustrates the structure of a cyber object. The rectangles without black background are attributes provided in MapTalk [10]. The black background rectangles (Figure 3.2 (1), (3), (7), (15)) represent new attributes provided by MapTalk2.0. A cyber object consists of the following attributes:
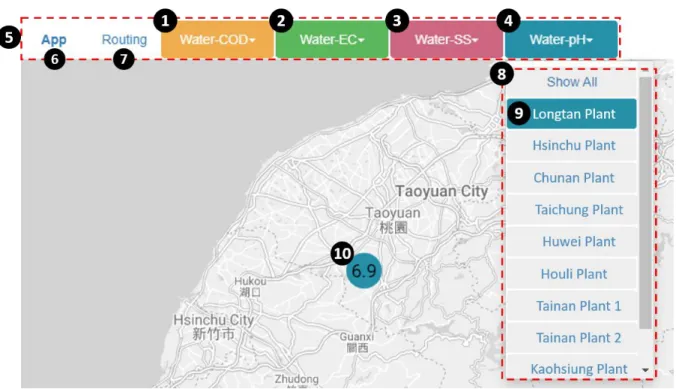
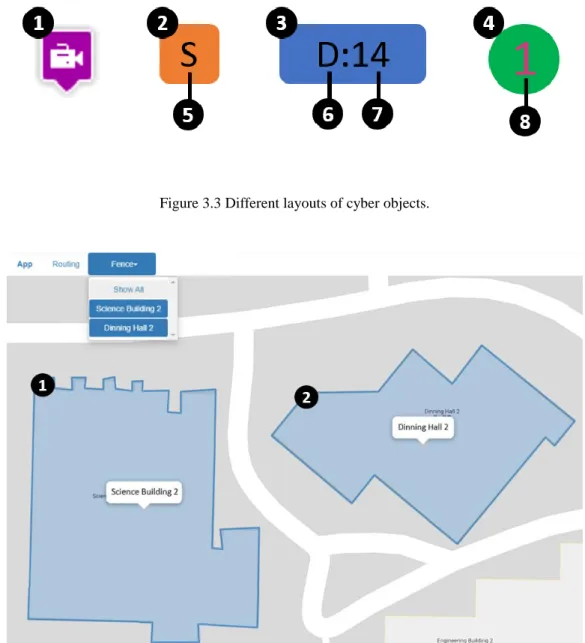
Layout (Figure 3.2 (1)): A cyber object can be a picture object (Figure 3.2 (2)) such as camera picture in Figure 3.3 (1) or a geometric shape object (Figure 3.2 (3)). A geometric shape object can be a rounded square (Figure 3.3 (2)), a rounded rectangle (Figure 3.3 (3)) or a circle (Figure 3.3 (4)). In MapTalk2.0, we add polygon (e.g., Science Building 2 in Figure 3.4 (1)) as a new geometric shape object. Users can click on the map and draw a polygon by themselves to represent the shape of a cyber object (e.g., Dining Hall 2 in
16
Figure 3.4 (2)). A geometric shape object is created with following features.
Figure 3.3 Different layouts of cyber objects.
Figure 3.4 The polygonal objects.
Name (Figure 3.2 (4)): The developer can use a letter to specify the abbreviated object name. For example, “D” for the dryers in a laundry room (Figure 3.3 (6)) and
“S” for southbound traffic on a freeway (Figure 3.3 (5)). The shape of an object with abbreviated letter is either rounded square (Figure 3.3 (2)) or rounded rectangle (Figure 3.3 (3)). An object without abbreviated letter is a circle (Figure 3.3
17
(4)).
Color (Figure 3.2 (5)): The background color of a rounded rectangle, a polygon, or a circle object is the same as that of its application drop-down list button. Therefore, different applications are automatically assigned different colors. For example, the color for dryers in a laundry room is azure blue (Figure 3.3 (3)), and the color for tracked school bus is grass green (Figure 3.3 (4)).
Value (Figure 3.2 (6)): A text (Figure 3.2 (8)) value can be shown in a circle or a rounded rectangle object. For example, the value 1 (Figure 3.3 (8)) is the identity of a tracked school bus, and the value 14 (Figure 3.3 (7)) represents the number of idle dryers in a laundry room. The color (Figure 3.2 (9)) fills inside space of a rounded square represents the status of the object. The colors are mapped to a range [Min, Max] (Figure 3.2 (10) and (11)) of float numbers. For example, in the southbound speed of the freeway No.5 application, the value range [0,20] is mapped to color purple, [21,40] to red, [41,60] to orange, [61,80] to yellow and any value larger than 81 is mapped to green. The color spectrum is shown in Figure 3.5 (3).
18
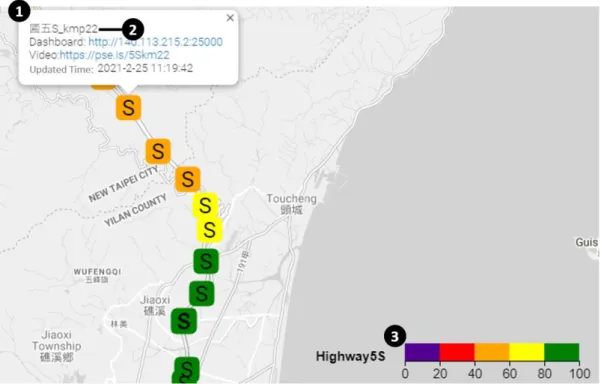
Figure 3.5 The southbound speed of freeway No.5 on MapTalk2.0.
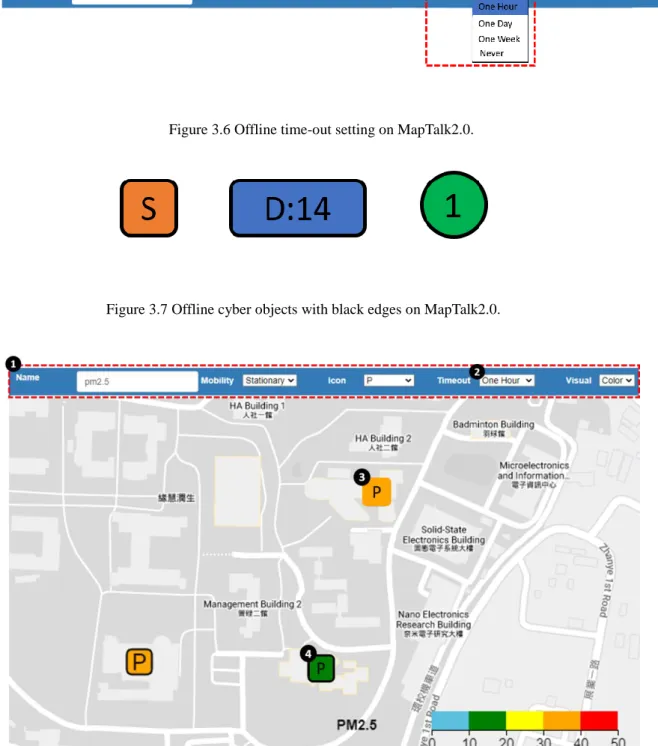
Offline Time-out (Figure 3.2 (7)): MapTalk2.0 adds this new attribute to ensure that the information presented on the map is up-to-date. Developers can set this attribute (Figure 3.6 (1)) according to the data update frequency of sensors such as one hour or one day. If the latest update time has not been updated after the set time, then the layout of the cyber object is added a black edge to represent offline sensor (Figure 3.7). Take the application of pm2.5 as an example. The settings of this application in MapTalk2.0 are illustrated in Figure 3.8 (1), in which the offline time-out attribute is set to one hour (Figure 3.8 (2)). Therefore, when the value of pm2.5 sensor is not updated for more than one hour, the offline mechanism will be triggered. Figure 3.8 (3) describes that the pm2.5 sensor in student activity center is regularly updated. In Figure 3.8 (4), the cyber object displays with an additional black edge, which means that the pm2.5 sensor in female dormitory 2 is offline due
19
to abnormal factors such as disconnection, hardware defeat, etc. Through the offline time-out attribute, developers can find problems more quickly and ensure the correctness of information for users.
Figure 3.6 Offline time-out setting on MapTalk2.0.
Figure 3.7 Offline cyber objects with black edges on MapTalk2.0.
Figure 3.8 The admin page of pm2.5 application and the status of cyber objects.
20
Location (Figure 3.2 (12)): A non-tracked object is stationary (Figure 3.2 (13)), and its location is fixed on the map. A tracked object is movable (Figure 3.2 (14)) and its location is dynamically updated in the map. The tracked objects are used in tracking cars, people, animals, and so on. The trajectory (Figure 3.2 (16)) of a tracked object can be shown with the same color as the letter in the object (e.g., the trajectory (Figure 3.9 (2)) and object letter 1 (Figure 3.9 (1)) are both displayed in the same color pastel red).
Figure 3.9 The trajectory of a tracked object on MapTalk2.0.
Warning Mechanism (Figure 3.2 (15)): The warning mechanism (Figure 3.10 (1)) can automatically add and delete the stationary object and this mechanism is generalized from the offline mechanism of MapTalk. The details of the warning mechanism are given in Section 3.1.2.
Figure 3.10 The warning mechanism field on admin webpage.
21
Description (Figure 3.2 (17)): When the user clicks the left button of the mouse on a cyber object, a dialog pops up (Figure 3.5 (1)), which contains a hyperlink leading to a historical chart (Figure 3.2 (18)), a text (Figure 3.5 (2)) to describe the object or action buttons (Figure 3.2 (19)) allowing user to interact with the physical objects.
22
3.1.2. The Warning Mechanism
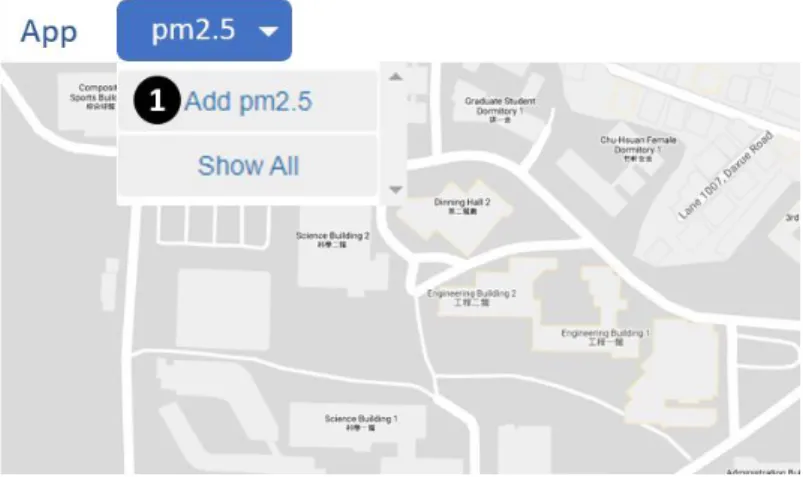
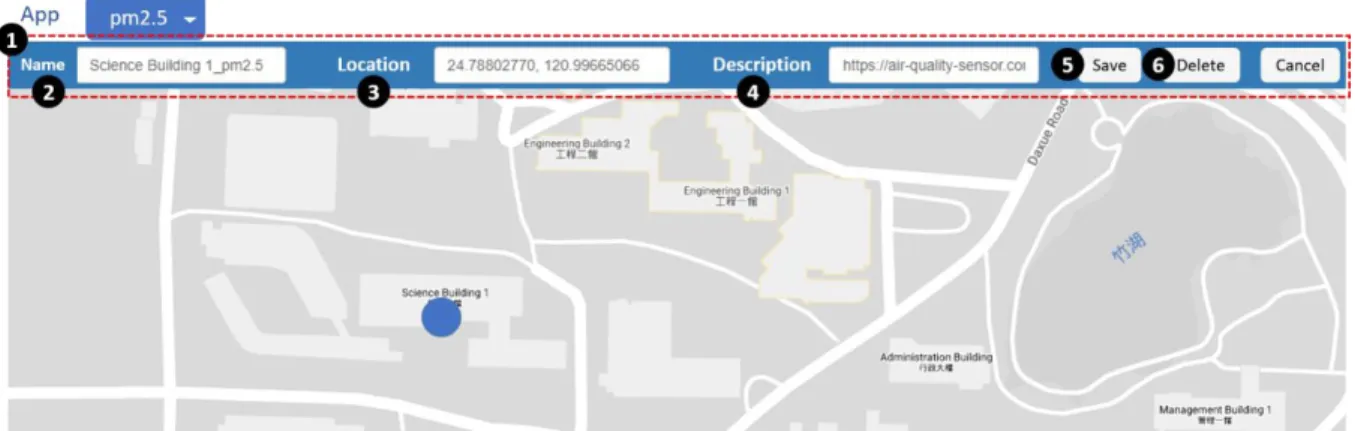
A stationary object (Figure 3.2 (13)) has a fixed location on the map. An administrator can manually add and delete a stationary object on the admin webpage of the MapTalk. For example, to add a new stationary object in the application, the administrator clicks the “Add pm2.5” item (Figure 3.11 (1)), and the object setup bar (Figure 3.12 (1)) is shown below the menu bar. The setup bar consists of three fields: Name (Figure 3.12 (2)), Location (Figure 3.12 (3)), and Description (Figure 3.12 (4)). The Name field specifies the object name. The Location field can be filled by either clicking the mouse at the location on the map or manually inputting the latitude and longitude. The Description field provides the information related to the stationary object, which can be a hyperlink to other websites or a text description. After the stationary object setup is complete, the administrator clicks the “Save”
button (Figure 3.12 (5)) to create the stationary object. To delete a stationary object, the administrator first selects the stationary object, and clicks the “Delete” button (Figure 3.12 (6)) in the setup bar.
Figure 3.11 The pm2.5 application on admin webpage.
23
Figure 3.12 The stationary object creation and setup.
Sometimes manually adding and deleting is too late to reflect the real-time situation.
Consider the accident application that displays real-time traffic accidents of the freeway No.5 on the map. A stationary object in the accident application is a warning icon (Figure 3.14 (3)) that represents an accident. When an accident occurs, the warning icon is immediately placed on the MapTalk at the location of the accident. After the accident is handled, the warning icon is immediately removed so that the users will not be confused. In the accident application, manually adding and deleting warning icons may not meet the real-time requirements.
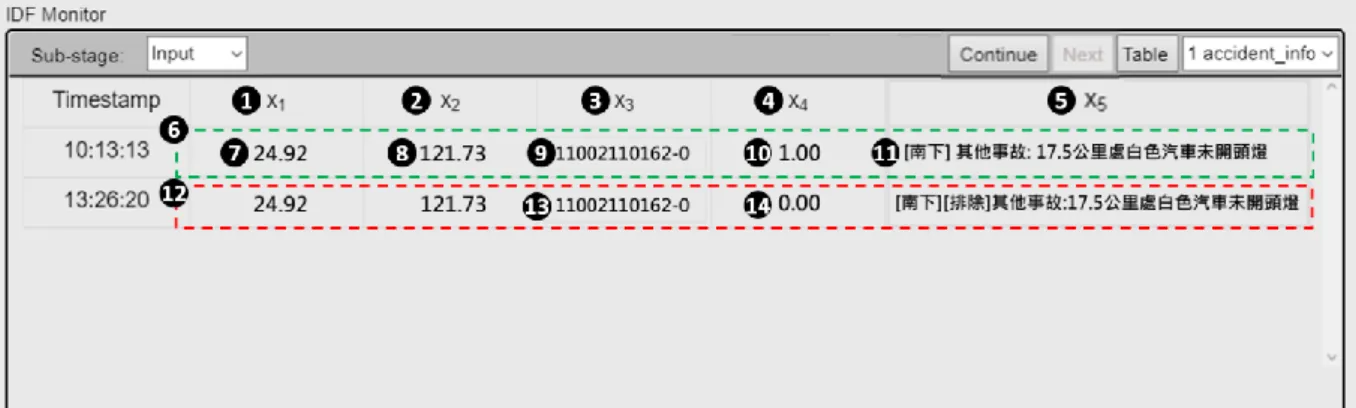
To resolve this issue, MapTalk2.0 provides a warning mechanism to automatically add and delete a stationary object. The IDF of the warning mechanism has five attributes: Latitude (float), Longitude (float), Name (string), Status (float), and Description (string) (see Figure 3.13 (1) - (5)).
In the accident application (Figure 3.14 (1)), when an accident occurs, the values of five IDF attributes are shown in Figure 3.13 (6). The values of x1 and x2 are the location of the warning icon (the latitude and the longitude in Figure 3.13 (7) - (8)). The x3 attribute is the
24
identity of the warning icon (Figure 3.13 (9)) and will be displayed in the drop-down list of the accident application (Figure 3.14 (2)). The x4 attribute is 1 (Figure 3.13 (10)), which requests MapTalk2.0 to add the warning icon (Figure 3.14 (3)) on the map. The x5 attribute is the description of the warning icon (Figure 3.13 (11)) and will be shown in the info window (Figure 3.14 (4)). After the accident is dealt with, the five attributes of the IDF are shown in Figure 3.13 (12). The value of the x4 attribute is 0 (Figure 3.13 (14)), which requests MapTalk2.0 to delete the warning icon on the map according to its name in x3 attribute (Figure 3.13 (13)). Then two red dotted rectangular areas in Figure 3.14 (5) – (6) will be removed. The results of automatically adding and deleting stationary objects can render on the webpage of the MapTalk2.0 in real time.
Figure 3.13 The five attributes of the accident application in IoTtalk IDF.
25
Figure 3.14 The warning icon on the map.
3.1.3. Implementation of “Show All” Item
The “Show All” item (Figure 3.15 (2)) is the button in an application drop-down list (Figure 3.15 (1)). When the user clicks the “Show All” item, all cyber objects belong to this application will be displayed on the map. Then the “Show All” item will change to the “Hide All” item (Figure 3.16 (1)) which is used to hide cyber objects. However, the viewport of the map will not be adjusted, so the user may not be able to see all cyber objects at first glance (see Figure 3.16 (2)). Users need manually zoom the map after clicking the “Show All” button, which greatly affects the user's experience on MapTalk.
26
Figure 3.15 The “Show All” item in drop-down list.
Figure 3.16 The “Show All” item cannot set the viewport on MapTalk.
Therefore, MapTalk2.0 uses the google.maps.LatLngBounds class and the fitBounds() method provided by Google Map JavaScript API v3.4.3 [14] to automatically adjust the viewport of the map. A LatLngBounds instance represents a rectangle in geographical coordinates, including one that crosses the 180 degrees longitudinal meridian. The fitBounds
27
method sets the viewport to contain the given bounds.
The JavaScript code for the “Show All” function is listed in Figure 3.17. This program will be triggered when the user clicks the “Show All” item (Figure 3.15 (2)) in the drop-down list. In Figure 3.17, Line 1 constructs the new instance called bounds to represent a rectangle area in geographical coordinates. Lines 2-3 iterate over all cyber objects in all_icon_list, and find out which ones to display on the map. Lines 4-7 get the location of each cyber object, including latitude and longitude information. Line 8 extends the bounds instance according to the position of each cyber object. Line 9 sets the specified cyber objects on the map to be visible. Line 12 sets the viewport on the map to contain the given bounds instance. Through the program in Figure 3.17, the “Show All” item can set the suitable viewport of the map for users to contain all cyber objects at the same time on MapTalk2.0 (Figure 3.18).
Line 1 var bounds = new google.maps.LatLngBounds();
Line 2 for (var j = 0; j < all_icon_list.length; j++) {
Line 3 if (all_app_list[all_icon_list[j].app_num].app == all_app_list[app_num].app) { Line 4 var location = {
Line 5 lat: all_icon_list[j].lat, Line 6 lng: all_icon_list[j].lng Line 7 };
Line 8 bounds.extend(location);
Line 9 all_icon_list[j].marker.setVisible(true);
Line 10 } Line 11 }
Line 12 map.fitBounds(bounds);
Figure 3.17 The JavaScript code for the “Show All” function.
28
Figure 3.18 The “Show All” item sets the viewport on MapTalk2.0.
Section 3.2. The Route Planning Service
MapTalk provides the route planning service by clicking the routing button (Figure 3.1 (7)) in the menu bar. This service is the same as the route planning provided by Google Map. Users can specify the starting point and destination by clicking on the map. MapTalk2.0 adds the rerouting service which can help users adjust the route immediately when they deviate from the original route.
3.2.1. The Rerouting Service
MapTalk combines the tracking application and the route planning service to implement a navigation system. The tracking application can track the user and display the user’s
29
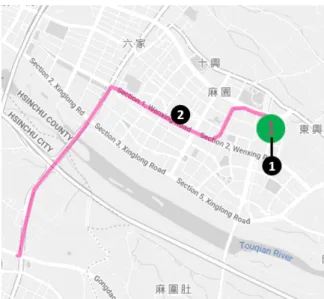
location on the map (Figure 3.19 (2)). The route planning service can provide the route (Figure 3.19 (5)) from the starting point (Figure 3.19 (3)) to the destination (Figure 3.19 (4)) specified by the user.
However, when deviating from the original route, users put themselves in danger of setting a new starting point and destination during driving. Therefore, MapTalk2.0 provides the rerouting service to help users update the new route in real time. By clicking the rerouting button (Figure 3.20 (1)) in the menu bar during the route planning service, a new route to the destination will be re-planned based on the user’s current location.
For example, the user in Figure 3.19 (2) deviates from the original route (Figure 3.19 (5)).
After clicking the rerouting button (Figure 3.20 (1)), the new route to the destination (Figure 3.20 (3)) from the user’s current location will be shown on the map.
Figure 3.19 The user deviates from the planned route.
30
Figure 3.20 The rerouting service provides a new route for the deviated user.
31
Chapter 4. The Freeway No. 5 Information
This chapter describes how to integrate the Freeway No.5 information into MapTalk2.0.
The Freeway No.5 application provides real-time information for traffic speed and accident events.
Section 4.1. The Real-time Speed Application
We obtain the real-time speed and the location information for every kilometer on Freeway No.5 from the Traffic Information Service (TISV) of MOTC, Taiwan. We take southbound speed calculation as an example to demonstrate the real-time speed application.
The speed integration method for northbound is the same, and the details are omitted.
4.1.1. Application Setup on MapTalk2.0
To create the application, we click the “Add App” item (Figure 4.1 (1)) on the MapTalk2.0 admin webpage, and the application setup bar (Figure 4.1 (2)) is shown below the menu bar. This bar consists of seven fields (Figure 4.1 (3) – (9)). The Name field (Figure 4.1 (3)) is the application name (e.g., Freeway5S). The Mobility field (Figure 4.1 (4)) specifies the location attribute of the cyber object, which is “Stationary” in this case. The Icon field (Figure 4.1 (5)) specifies the layout attribute, which is “S” representing southbound. The Timeout field (Figure 4.1 (6)) specifies the offline time-out attribute, where “One Hour” is chosen to provide a notification if the data has not been updated for more than one hour. The Visual field (Figure 4.1 (7)) specifies the value attribute of the cyber object. If we select
“color” for this field, then the color range dialog box (Figure 4.2) will pop up. This dialog box
32
is used to fill the Min value (Figure 4.2 (1)) and the Max value (Figure 4.2 (2)) to set the color spectrum. The Warning field (Figure 4.1 (8)) allows the administrator to select the warning mechanism. The real-time speed application does not need to activate this mechanism. The Quick Access field (Figure 4.1 (9)) allows the administrator to place the created application in the menu bar for quick access. After the setup process is finished, we click the “Save” button (Figure 4.1 (10)) to save the setup values.
Figure 4.1 illustrates the settings (Figure 4.1 (3) – (9)) of the southbound speed application on the MapTalk2.0 admin webpage.
Figure 4.1 The setting of the speed application.
Figure 4.2 The color range dialog box.
We then create cyber objects according to the location information from TISV to represent the speed of each kilometer. Figure 4.3 shows the settings of the cyber object. The Name field (Figure 4.3 (1)) specifies the object name. (e.g., Freeway5S_0km). In the Location field (Figure 4.3 (2)), we input the latitude and the longitude of each kilometer obtained from
33
TISV. The Description field (Figure 4.3 (3)) is set the real-time video hyperlink provided by Freeway Bureau. The hyperlink is shown in the info window of the cyber object (Figure 4.9 (6)). When the users click the real-time video hyperlink, they are directed to the real-time videos webpage (Figure 4.4).
Figure 4.3 The setting of the cyber object.
Figure 4.4 The real-time video on Freeway No.5.
4.1.2. Project Setup on IoTtalk
IoTtalk is an IoT application development platform based on the concept of “device
34
model” and “device feature” [16]. Each device model is composed of one or more device features (DFs). There are two types of DFs: input device feature (IDF) and output device feature (ODF).
The southbound Freeway No.5 application is considered as an input device in IoTtalk. To create this application, we use the device model window (Figure 4.5) to add a device model called “Freeway5S” (Figure 4.5 (1)). The Freeway5S device is composed of the one input device feature (Figure 4.5 (2)).
Figure 4.5 The device model window.
Then we use device feature window to add a new device feature that belongs to IDF (Figure 4.6 (1)) in the category “Other” (Figure 4.6 (2)) called “Speed-TI” (Figure 4.6 (3)).
This device feature has five parameters (Figure 4.6 (4)) respectively represent latitude, longitude, name, value, and timestamp with the types shown in Figure 4.6 (5). We follow some naming rules to name device features, first, we use camel case, then the suffix –I, -O respectively represent IDF and ODF, and finally, if there are more than one device features of the same name, we will append numbers at the end. It’s worth noting that if IDF and ODF with multiple tags [17], the suffix –I, -O will change to –TI, -TO.
35
Figure 4.6 The device feature window.
After setting up the device models and device features, we can create a project through the IoTtalk project GUI. To establish a project, we first give it a unique project name called
“Freeway5” (Figure 4.7 (1)). Then through the “Model” button (Figure 4.7 (2)), we select the input device model called “Freeway5S” (Figure 4.7 (3)) and the output device model called
“Map” (Figure 4.7 (5)). The ODFs of “Map” are automatically created after the administrator has set up the applications on the MapTalk2.0 admin webpage and clicks the “Save” button (Figure 4.1 (10)). In other words, when we create the “Freeway5S” application on the MapTalk2.0 admin webpage in Section 4.1.1, the ODF (Freeway5S-TO; see Figure 4.7 (6)) is automatically added to the device model (Map; see Figure 4.7 (5)). Finally, we link the IDF (Speed-TI; see Figure 4.7 (4)) to the ODF (Freeway5S-TO; see Figure 4.7 (6)) by two line segments through a “join” circle (Figure 4.7 (7)) which defined in Section 2.2.
36
Figure 4.7 The project configuration.
Through the link between IDF and ODF, the latest southbound speed for every kilometer on Freeway No.5 can transmit to the MapTalk2.0. The IDF monitor (Figure 4.8 (1)) in IoTtalk shows every data from IDF to ODF. We can find that the southbound 18 kilometers on the Freeway No.5 is named “Freeway5S_18km” (Figure 4.8 (2)) and the speed is 82.0 (Figure 4.8 (3)). Therefore, the value of the cyber object on the MapTalk2.0 with the same name (Figure 4.9 (2)) in the “Freeway5S” application (Figure 4.9 (1)) will be updated to green (Figure 4.9 (3)) because 82.0 corresponds to the green region in the color spectrum (Figure 4.9 (7)).
Similarity, the speed at 20 kilometers (Figure 4.8 (4)) is 78.0 (Figure 4.8 (5)), so the color of cyber object (Figure 4.9 (4)) is updated to yellow (Figure 4.9 (5)).
Figure 4.8 The speed data in the IDF monitor.
37
Figure 4.9 The “Freeway5S” application on MapTalk2.0.
Section 4.2. The Real-time Accident Application
This section provides the implementation of the real-time accident application and illustrates how to set up a project on the IoTtalk GUI.
We obtain the real-time accident information on Freeway No.5 from the Open Government Data Platform. Each accident in the dataset has a unique identity (UID). By querying the UID of the accident, we can know whether the accident has been handled or not.
4.2.1. Application Setup on MapTalk2.0
The accident application is created as follows. First, we input “Accident” in the Name field (Figure 4.10 (1)) and select the “Stationary” item in the Mobility field (Figure 4.10 (2)).
38
In the Icon field (Figure 4.10 (3)), we choose the “Picture” item, then the window will pop up a dialog box (Figure 4.11 (1)) that allows us to fill the Picture URL linking to the picture to be shown in the MapTalk2.0 GUI. Figure 4.11 (2) is the hyperlink of a warning icon (Figure 4.15 (3)) provided by Google Map. Then we tick the warning field (Figure 4.10 (4)) to activate the warning mechanism which can automatically add and delete a cyber object. Finally, we select the Quick Access field (Figure 4.10 (5)) to place the application in the menu bar so that users can quickly access it.
Figure 4.10 The setting of the accident application.
Figure 4.11 The picture URL dialog box.
Because the accident application activates the warning mechanism illustrated in Section 3.1.2, we do not need to manually add a cyber object. The cyber object will be automatically added and deleted through the data from IoTtalk.
39
4.2.2. Project Setup on IoTtalk
To create the accident application, we first create the device model and device feature in IoTtalk. We use the device model window to add a new device model called “Freeway5”
(Figure 4.12 (1)). The accident application includes northbound and southbound accidents on Freeway No.5, so we do not have to create separate device models. The device model
“Freeway5” consists of one input device feature (Figure 4.12 (2)).
Figure 4.12 The device model window.
Then we use the device feature window to create a new device feature that belongs to IDF (Figure 4.13 (1)) in the category “Other” (Figure 4.13 (2)) called “Accident-TI” (Figure 4.13 (3)). This device feature has five parameters (Figure 4.13 (4)). Owing to the warning mechanism, the five parameters respectively represent latitude, longitude, name, status, description with the types described in Figure 4.13 (5).
40
Figure 4.13 The device feature window.
After completing the above settings, we can add the device models required by the real-time accident application to the IoTtalk project. We select the input device model called
“Freeway5” (Figure 4.14 (1)) and the output device model called “Map” (Figure 4.14 (3)).
Then we link the IDF (Accident-TI; see Figure 4.14 (2)) to the ODF (Accident-TO; see Figure 4.14 (4)) so that the accident information can be sent to the MapTalk2.0.
Figure 4.14 The project configuration.
41
When an accident occurs on Freeway No.5, the new cyber object (Figure 4.15 (2)) with UID will be automatically added to the “Accident” application (Figure 4.15 (1)) on the MapTalk2.0. Since we selected the “Picture” item in the Icon field (Figure 4.10 (3)), the layout of the cyber object is a warning icon (Figure 4.15 (3)) in the accident application. The detailed accident information is shown in the info window of the cyber object (Figure 4.15 (4)). After the accident is dealt with, the cyber object with the same UID will be automatically deleted. In other words, the two red dotted rectangular areas (Figure 4.15 (5) – (6)) will be removed.
Figure 4.15 The real-time accident application on MapTalk2.0.
42
Chapter 5. Electronic Fence Service
The electronic fence service consists of the tracking application (Figure 5.1 (1)) and the fence application (Figure 5.1 (2)). The tracking application can not only track the user (Figure 5.1 (3)) but also provide the user with the ability to send the LINE message to the administrator by shaking the cellphone vigorously when encountering a dangerous situation.
The fence application can record the user (Figure 5.1 (5)) who has entered the fence (Figure 5.1 (4)) and the trajectory (Figure 5.1 (6)) within the fence. If the user enters or leaves the fence while using the tracking application, the electronic fence service will automatically send the LINE message to inform the administrator.
Figure 5.1 The electronic fence service on MapTalk2.0.
43
The electronic fence service can be implemented on campus to enhance campus safety.
Fences can be set up in places off the beaten track by the administrator and students can use the tracking application when they enter these areas to ensure their own safety.
This chapter provides the details of how to implement the electronic fence service, including three parts: administrator setup, user operation and the features of the service.
Section 5.1. Administrator Setup
To create a new fence, we first select the “Add Fence” item (Figure 5.2 (2)) to create a cyber object in the fence application (Figure 5.2 (1)). The cyber object represents the fence in the fence application and the layout (Figure 3.2 (1)) of the cyber object is a polygon.
Figure 5.2 The fence creation.
We click on the map and draw a polygon (Figure 5.3 (1)) to represent a fence. After the fence is drawn, the latitude and longitude of each vertex of the polygon will be automatically
44
filled in the Location field (Figure 5.3 (2)). Then we input the fence name in the Name field (e.g., Student Dormitory 8; see Figure 5.3 (3)) and the description of the fence in the Description field (Figure 5.3 (4)). Finally, we click the “Save” button (Figure 5.3 (5)) to add this polygon to the fence application.
Figure 5.3 The setting of the fence.
It is worth noting that it is not allowed to have intersecting line segments in the polygon.
When the user finishes drawing the polygon, if there are intersecting line segments (Figure 5.4 (1)), the window will pop up an alert box (Figure 5.4 (2)) that asks the user to redraw the polygon.
45
Figure 5.4 The intersection alert box.
Section 5.2. User Operation
After the fence is created, the users can use the tracking application to access the electronic fence service. We have implemented two versions of the tracking application: the mobile App and the web browser.
5.2.1. Tracking Mobile App
In the current version, the tracking mobile app is only supported for Android smartphone.
We provide the android application package (APK) for users to download the tracking app.
There are four fields (Figure 5.5 (1) – (3) and (6)) on the homepage of the tracking app.
The Name field (Figure 5.5 (1)) is the username (e.g., Steven). The Phone field (Figure 5.5 (2)) specifies the user’s cellphone number (e.g., 0912345678). The Time field (Figure 5.5 (3))
46
specifies the tracking duration. After we click the spinner button (Figure 5.5 (4)) in the Time field, a drop-down menu (Figure 5.5 (5)) will appear, and then we can select the duration to be tracked by tracking application. The checkbox field (Figure 5.5 (6)) allows the user to decide whether to allow the electronic fence to access location information when using tracking application. If the user checks this field, the administrator will know that the user enters or leaves the fence. The “Open Map” button (Figure 5.5 (8)) is to open the user page of the MapTalk2.0. When the setup process is finished, then we click the “Start” button (Figure 5.5 (7)) to register and continuously send our location information to the tracking application within the set time interval in the Time field.
Figure 5.5 The homepage of the tracking app.
After clicking the “Start” button (Figure 5.5 (7)), the tracking app will direct to the
47
webpage of the MapTalk2.0 and the cyber object (Figure 5.6 (1)) representing the user will be added to the tracking application (Figure 5.6 (2)) and displayed on the map (Figure 5.6 (3)).
The tracking application will concatenate the last three digits of the cellphone number after the user’s name (e.g., Steven678; see Figure 5.6 (1)) as the cyber object’s name to avoid confusion for users with the same name. Each cyber object has a unique number and represents a different user on the map. For example, the user Steven678 is shown in Figure 5.6 (3) and has a unique number 0 (Figure 5.6 (4)). The location of the cyber object on the map will be continuously updated based on the user’s latest location.
Figure 5.6 The tracking application on MapTalk2.0.
When being tracked, the tracking app will display the remaining tracking time (Figure 5.7 (1)) in the notification field of the cellphone. The “Start” button on the tracking app
48
homepage will turn into the “Stop” button (Figure 5.7 (2)) so that the user can click the “Stop”
button to stop being tracked at any time.
Figure 5.7 The function of the tracking app.
5.2.2. Website Registration
In addition to registering with the tracking app, users can also register for the tracking application via the website. The URL of the tracking website is the URL of the MapTalk2.0 append with “#Tracking”. The website will pop up the registration dialog box (Figure 5.8 (1)) and ask the user to fill in name (e.g., Joseph; see Figure 5.8 (2)) and cellphone number (e.g., 0987654321; see Figure 5.8 (3)). The checkbox in the Figure 5.8 (4) can decide whether to
49
allow the electronic fence to access location information. The function of the checkbox (Figure 5.8 (4)) is the same as the checkbox field (Figure 5.5 (6)) in the tracking app.
We implement cookie technology on the tracking website, so the name (Figure 5.8 (2)) and the cellphone number (Figure 5.8 (3)) entered by the user will be recorded. In other words, the user does not need to re-enter each field in the registration dialog box (Figure 5.8 (1)) every time they register through the website.
Figure 5.8 The registration dialog box on the tracking website.
After we complete the registration dialog box, we click the “Enter” button (Figure 5.8 (5)) to register. Then the cyber object representing Joseph (Figure 5.9 (1)) will be added to the tracking application (Figure 5.9 (2)) and shown on the map (Figure 5.9 (3)). As we mentioned in the Section 5.2.1, the name of the cyber object is the username appending the last three digits of the cellphone number (e.g., Joseph321; see Figure 5.9 (1)).
50
Figure 5.9 The tracking application on MapTalk2.0.
Section 5.3. Features of the Electronic Fence Service
When the user successfully registered in the tracking application and also checked the
“Tracking for the electronic fence” in the checkbox field (e.g., Figure 5.5 (6) and Figure 5.8 (4)), then the user can use the electronic fence service. The electronic fence service consists of the fence application and tracking application. Therefore, the electronic fence service has three features: entry and leaving detection, emergency notification and historical trajectory record.
5.3.1. Entry and Leaving Detection
If the user enters or leaves the fence created by the administrator, the electronic fence service will send the LINE message to notify the administrator. For example, when the user
51
Joseph321 (Figure 5.10 (1)) enters the management building 1 (Figure 5.10 (2)) fence, the electronic fence service will send the LINE message (Figure 5.10 (3)) to the administrator.
The LINE message includes the username (Figure 5.10 (4)), the name of the fence (Figure 5.10 (5)) that the user enters or leaves, and also the MapTalk2.0 webpage hyperlink (Figure 5.10 (6)) so that the administrator can quickly direct to the MapTalk2.0 webpage.
Figure 5.10 The detailed LINE message information.
5.3.2. Emergency Notification
If users encounter a dangerous situation when using the tracking application, they can send the LINE message (Figure 5.10 (7)) to the administrator for help by shaking the cellphone vigorously. The LINE message includes username (Figure 5.10 (8)) and the user’s cellphone number (Figure 5.10 (9)), so that the administrator can contact the user immediately.
52
5.3.3. Historical Trajectory Record
We can click the fence in the fence application, then the fenced area and the users who have entered the fence will be shown on the map. For example, when we click the
“Management Building 1” item (Figure 5.11 (1)) in the fence application, we can see that Steven678, Joseph321 and Candy051 (Figure 5.11 (2) – (4)) have entered this fence. Then we can select the “History” button (Figure 5.11 (5)) in the info window of the cyber object to view the user’s historical trajectory in the fence. The “History” button provides four options (Figure 5.12 (1) – (4)): Current, Last Minute, Last Hour, and Last 30 Records. Different options represent historical trajectories at different times. For example, Figure 5.11 (6) shows the trajectory of the user Joseph321 in the last hour.
Figure 5.11 The fence application on MapTalk2.0.
53
Figure 5.12 The history dialog box.
54
Chapter 6. Conclusion
In this thesis, we proposed MapTalk2.0, an integrated operation center for IoT applications. MapTalk2.0 is a web-based smart map platform that allows users to quickly deploy personalized digital maps and integrate different data to create IoT applications.
MapTalk2.0 allows users to interact with physical objects through their cyber representations in a map and administrators can add new applications to MapTalk2.0 without extra programming effort.
MapTalk2.0 is built on top of the IoTtalk platform, which has a friendly GUI to help us easily establish a data transmission between IoT applications and MapTalk2.0. In the current version of the MapTalk2.0, we enhance the attributes of a cyber object, including the geometric shape of the cyber object, the offline time-out setting, and the implementation of the “Show All” function. For the route planning service, we have added a rerouting function to make this service more comprehensive. We used the freeway No.5 information to show how to integrate different data such as speed, accidents, and real-time videos into MapTalk2.0.
We also implemented the electronic fence service, which combines the tracking application and Line Notify to detect the tracked users and send alert messages to the administrator. The electronic fence service has been applied on campus to ensure the safety of students in specific areas. Also, the tracking application can be used for more purposes. For example, we can let members of the cycling team know the location of their partners through the tracking application. Members of the cycling team can register the tracking application by scanning a specific QR code. Without this QR code, other users can not register on this application, so that only the specific users can view each other’s location information.
55
In the future, we will focus on the following issues:
For the mobile tracking application:
Develop the iOS version of the tracking application: The main differences in the development of Android and iOS applications includes the programming language changed from Java to Objective-C or Swift, and the development environment for iOS applications must be on a device with macOS.
Provide dynamically changing the frequency of accessing the GPS based on the user’s travel distance to save power on the mobile device: We use the
setCurrentLocation() function in the TrackingService.java to get the user’s location
information. The frequency of GPS access is related to the power of the mobile device and is set via the
gps_permission()
function in the TrackingMainViewActivity.java. The gps_permission() function will create aLocationRequest, and then store the parameters in the request. The parameters are
used to determine the level of accuracy for location requests, including update
interval, fastest update interval, and priority. The details of parameter setting
method are described in [18]. Therefore, we can save power on the mobile device by dynamically adjusting the above parameters based on the user’s travel distance.
For the route planning service:
Provide the function of setting relay points to have more flexibility to use this service.
For the electronic fence service:
Implement load testing to calculate the maximum number of people that the server
56
can afford.
Move the entry and leaving fence detection method from the server to the mobile device to reduce the burden on the server: The entry and leaving detection method is determined by the Boolean function called Polygon.contains() provided by Python Shapely package. In the electronicfence.py, we get fence information from the static_icon_table in the MapTalk2.0 database and use the vertices of the fence to form a Polygon object, and then pass in the user’s location to contains() function to determine whether the point is within the Polygon object. Then, we also need to use the project_trans() function in the electronicfence.py to project the latitude and longitude values to the Projection Coordination System (PCS). Therefore, we will move the above-mentioned functions to the TrackingMainViewActivity.java of the mobile tracking application for execution and then send the detection result back to the server to reduce the server’s computational load.
In the current version, we use Google Map as a map resource, but with the increase of network traffic in the MapTalk2.0, the fees charged by Google Map will also increase.
Therefore, we will port the platform to open-source maps (e.g., Leaflet [19]). Finally, we will continue to promote MapTalk2.0 and cooperate with different organizations and take user feedback as the direction for future improvements of MapTalk2.0.