影響台灣地區國際觀光旅館成本效率之因素:隨機邊界法之應用
52
0
0
全文
(2) 影響台灣地區國際觀光旅館成本效率之因素:隨機邊界法之應用. Efficiency Analysis of International Tourist Hotels in Taiwan: An Application of the Stochastic Frontier Approach. 研 究 生︰裘家寧 指導教授︰胡均立教授. Student: Chia-Ning Chiu Advisor: Dr. Jin-Li Hu. 國立交通大學 經營管理研究所 碩士論文. A Thesis Submitted to Institute of Business and Management College of Management National Chiao Tung University in Partial Fulfillment of the Requirements for the Degree of Master Of Business Administration. June 2008 Taipei, Taiwan, Republic of China 中華民國 九十七 年 六 月.
(3) 影響台灣地區國際觀光旅館成本效率之因素: 隨機邊界法之應用. 學生:裘家寧. 指導教授:胡均立教授. 國立交通大學經營管理研究所碩士班. 摘要. 本論文採用一階段隨機邊界分析法(Battese and Coelli, 1995)衡量 1997-2006 年間台灣地區 66 家國際觀光旅館之成本效率,同時探討造成無效率之因素。本模 型中使用三產出項,分別為觀光旅館客房收入、餐飲部收入和其他營運收入,而 三投入價格則是勞動價格、其他營運價格和餐飲部價格,同時也納入五項環境變 數:位處風景區之虛擬變數、加入連鎖飯店系統之虛擬變數、導遊人數、到桃園 國際機場的最短距離、及到高雄國際機場的最短距離。由實證結果顯示,台灣地 區國際觀光旅館平均營運的成本效率值為 91.15%。加入連鎖飯店系統、增加導遊 人數、鄰近國際機場,皆與國際觀光旅館之成本效率具有顯著正向影響,而有助 於觀光產業之發展。. 關鍵詞:國際觀光旅館、成本效率、隨機邊界、橫縱面資料、時間變動效率. i.
(4) Efficiency Analysis of International Tourist Hotels in Taiwan: An Application of the Stochastic Frontier Approach. Student: Chia-Ning Chiu. Advisor: Dr. Jin-Li Hu. Department Institute of Business and Management College of Management National Chiao Tung University. ABSTRACT A one-stage stochastic frontier approach (SFA) is used in this study to simultaneously estimate cost efficiency scores and factors of cost inefficiency for 66 international tourist hotels in Taiwan during 1997-2006. An SFA model with three outputs and three inputs is defined.. The three outputs are room revenue, food and. beverage revenue, and other operation revenue while the three inputs are price of labor, price of other operation, and price of food and beverage. This model also takes into account five environmental variables, including dummy variable of the hotels located in non-metropolitan area, dummy variable of chain hotels, the number of tourist guides, the minimum distance from each hotel to Taoyuan international airport and the minimum distance from each hotel to Kaohsiung international airport.. Empirical. results show that international tourist hotels in Taiwan are on average operating at 91.15% cost efficiency. All nominal variables are transformed into real variables in 1997 prices by GDP deflators.. Chain systems, tourist guides, and international. transportation can significantly improve the cost efficiency of international tourist hotels in Taiwan.. Keywords:. International Tourist Hotel; Cost Efficiency; Stochastic Frontier; Panel Data; Time-varying Efficiency ii.
(5) 誌謝 師恩浩瀚,感恩我的指導教授-胡均立博士,在學術上教導我研究方法,為 我觀念澄清,在在傾曩相授,就如同每個園丁都想培育出最好的樹苗;在生涯規 劃上,老師也常就實務面提出想法,讓學生增廣視野與方向。 這篇論文蒙老師悉心指導,從研究主題的確定,架構的建立,一個階段一個 階段的細節督導我、鼓勵我,再不斷的為我修正,老師功不可沒。 也感謝口試委員-丁承教授、李揚教授、柯慈儀教授,犧牲了假期撥冗配合 口試,給予寶貴的建議與指教,使論文內容更完備。感謝我的親密 partner 佳惠、 阿立家族成員們、研究所同學,小美、大姐、依涵、佩琳,當學習碰到瓶頸時, 總有人適時捎來加油和打氣,他們都是我的貴人。也要感謝母校台大農推的死黨、 書法社的同好們,在轉換跑道辛苦的歷程,不斷鼓勵我,不管快樂、難過都有你 們的陪伴,這份友誼是我人生最美的記憶! 更感謝我的父母,對我無止境的包容與支持,包括我的妹妹常常是我睡前倒 垃圾的對象,還有遠在美國的小阿姨、小姨爹,十分關心我,並在英文寫作上給 我很大的幫忙,鵬鵬表弟對我的幫忙也是有求必應,這些都讓我點滴在心頭! 研究所的課業告一段落,但是在學問的研究學習上,還有許多地方需向各位 教授請教,更有許多不足之處,需要師長先進們不吝指正。 祈許自己成為一個品格端正而富文化教養,懂得尊重、感恩與回饋的人。. 裘家寧 謹誌 國立交通大學經營管理研究所 民國九十七年六月 iii.
(6) Contents 摘要 ............................................................................................................. i ABSTRACT .............................................................................................. ii 誌謝 ........................................................................................................... iii Contents.................................................................................................... iv Contents of Tables and Figures ............................................................... v 1. Introduction .......................................................................................... 1 2. Background of the hotel industry in Taiwan ..................................... 3 3. Review of the literature ....................................................................... 6 3.1 Papers based on SFA ..................................................................................... 6 3.2 Papers based on DEA ................................................................................... 8 3.3 Tabular Summary ....................................................................................... 10. 4. The stochastic frontier approach ...................................................... 12 5. Data and empirical model ................................................................. 15 5.1 Sample and data sources ............................................................................ 15 5.2 Variables ....................................................................................................... 15 5.3 Empirical model .......................................................................................... 16. 6. Empirical results ................................................................................ 21 7. Conclusions ......................................................................................... 41 References ............................................................................................... 43. iv.
(7) Contents of Tables and Figures. Table 1. Numbers of international hotels and rooms in Taiwan from 1997 to 2006 ......5 Table 2. Recapitulation of studies on the hotel frontier efficiency .............................. 11 Table 3. Descriptive statistics of variables ...................................................................19 Table 4. Parameter estimates of the translog cost frontier function .............................23 Table 5. Average cost efficiency rankings of Taiwanese international tourist hotels ...26 Table 6. The efficiency scores of international tourist hotels in Taiwan (1997) ..........27 Table 7. The efficiency scores of international tourist hotels in Taiwan (1998) ..........28 Table 8. The efficiency scores of international tourist hotels in Taiwan (1999) ..........29 Table 9. The efficiency scores of international tourist hotels in Taiwan (2000) ..........30 Table 10. The efficiency scores of international tourist hotels in Taiwan (2001) ........31 Table 11. The efficiency scores of international tourist hotels in Taiwan (2002) ........32 Table 12. The efficiency scores of international tourist hotels in Taiwan (2003) ........33 Table 13. The efficiency scores of international tourist hotels in Taiwan (2004) ........34 Table 14. The efficiency scores of international tourist hotels in Taiwan (2005) ........35 Table 15. The efficiency scores of international tourist hotels in Taiwan (2006) ........36 Table 16. The yearly cost efficiency scores in Taiwan international hotels .................37 Table 17. The cost efficiency scores of international hotels in six areas .....................38 Table 18. The number of tourist guides........................................................................39 Figure 1. Numbers of international hotels and rooms in Taiwan from 1997 to 2006 ....5 Figure 2. The yearly cost efficiency scores for international hotels ............................38 Figure 3. The international hotel’s average cost efficiency in six areas ......................39 Figure 4. The tendency for number of tourist guides in 1997-2006 ............................40. v.
(8) 1. Introduction The demand for recreational traveling has increased as quickly as peoples’ incomes have in Taiwan’s history.. This has caused intensified competition among the. hospitality industry, and in particular the hotel industry.. The tourism industry not only. brings in huge foreign exchange income, but also provides job opportunities in the tourism sector as well as many other industries. In order to promote the hotel industry and attract more international tourists, the government is administering a "Doubling Tourist Arrivals Plan" in an effort to achieve the goal of increasing annual tourists to Taiwan.. Over the past six years, total tourism receipts have risen rather quickly and. the tourism industry has become a major source of foreign exchange earnings for Taiwan.. Up to the year 2006, Taiwan had a total of 89 hotels, of which 60 were. international tourist hotels and 29 were general tourist hotels. As the hotel industry is one of the most important industries in Taiwan, it is worth paying more attention to the evaluation of hotel operation efficiency. The issue of efficiency is gathering momentum in the economics field.. This. study uses the stochastic frontier approach to measure average and firm-specific efficiency levels in the hotel industry.. The process permits a manager to decide if the. optimal amount of resources has been employed given the revenues realized.. Any. resources employed over the optimal quantity indicate a deviation from efficiency or X-inefficiencies as they are termed in finance and economics literature (Leibenstein, 1966). The two main methods that have previously been used in efficiency estimation are data envelopment analysis (DEA) and stochastic frontier approach (SFA).. Although. the SFA has been used in miscellaneous empirical studies in the literature, few papers implement the SFA on Taiwan’s hotel sector.. There is still no study on Taiwan’s hotel. sector using the SFA for panel data. In the past, most researchers applied DEA to 1.
(9) estimate efficiency in the hotel industry, as DEA is a linear programming technique to estimate the efficiency and a non-parametric technique.. DEA assumes that the. efficiency frontier has no random fluctuations. It does not require knowledge in a functional form, and therefore it is prevalent in the literature. In addition, it can readily deal with multiple inputs and outputs.. The advantage of the DEA approach is that it. can easily decompose overall efficiency into multiple allocative and technical components.. Its disadvantage is, due to the no-random-fluctuation assumption, a lack. of statistical analysis foundation.. In most cases, SFA is better than DEA.. The. advantages of SFA are a well-developed statistical test to identify the effectiveness of the model description and its ability to decompose the deviations from efficiency levels into noise and pure inefficiency (Barros, 2004). Only a few previous studies on Taiwan’s hotel industry (e.g., Tsaur 2001; Hwang and Chang 2003; and Chiang et al. 2004) have used the DEA method to estimate hotel efficiency.. Chen (2007) took the stochastic frontier approach to analyze data from a. single year.. This study tries to adopt the panel data, stochastic frontier approach, in. order to estimate and analyze the efficiency of Taiwan’s international tourist hotels.. 2.
(10) 2. Background of the hotel industry in Taiwan According to the latest UNWTO World Tourism Barometer (2008), there were approximately 898 million international tourist arrivals globally in 2006 and the number grew by 6% in 2007.. The World Tourism Organization (WTO, 2008) reported 52. million more international arrivals than in 2006, and of the overall number, Europe received some 19 million and Asia and the Pacific took 17 million.. The Americas. were up by around 6 million, Africa by 3 million and the Middle East by 5 million. All the different regions registered increases above their long-term average, with the Middle East leading the regional growth ranking (+13%), followed by Asia and the Pacific (+10%), Africa (+8%), the Americas (+5%), and Europe (+4%). In Taiwan, the number of foreign visitors has also been increasing continuously.. Therefore, the. tourism industry has been one of the most important sources of foreign exchange earnings for Taiwan.. In fact, since the tourism industry is a non-smokestack industry,. it is deemed environmentally significant and important by countries all over the world. The tourism industry is also considered one of the star industries of the 21st century since it brings along such great benefits as creating jobs and increasing foreign exchange earnings.. The World Travel and Tourism Council (WTTC) reports that over. the next ten years the global tourism industry will enjoy a rise in tourism expenditure from US$4.21 trillion to US$8.61 trillion, an expansion of its share of global GDP (Gross Domestic Product) from 3.6% to 3.8%, and an increase in job opportunities, from 198 million to 250 million positions added.. Therefore, this indicates that the. tourism industry will play an important role in future global economic development. According to the 2006 annual report on tourism, published by the Taiwan Tourism Bureau, there are 89 tourist hotels in Taiwan, with a total of 21,095 suites and rooms. They can be classified into two groups: international-class tourist hotels and domestic, regular hotels.. Of the total number of tourist hotels, 60 are international-class tourist 3.
(11) hotels with a total of 17,830 rooms and 29 are regular hotels with 3265 rooms. hotels employ a total of 19,667 persons.. These. Because of its unique traits in geographic. environment, Taiwan possesses plentiful and diverse cultural and natural resources. Therefore, it has great potential for the development of tourism. In order to achieve the annual visitor goals of the Doubling Tourist Arrivals Plan, Taiwan’s government is targeting to double the number of international tourist arrivals, to improve the tourism environment, and to reach the international standards.. The. government not only wants to attract more foreign tourists, but also to allow people to enjoy their holidays in Taiwan. Table 1 and Figure 1 respectively show the tabular and figurative numbers of the international tourist hotels in Taiwan during the ten-year period from 1997 to 2006.. 4.
(12) Table 1. Numbers of international hotels and rooms in Taiwan from 1997 to 2006 Number of international Year. Number of rooms tourist hotels. 1997. 54. 16845. 1998. 53. 16558. 1999. 56. 17403. 2000. 56. 17057. 2001. 58. 17815. 2002. 62. 18790. 2003. 62. 18776. 2004. 61. 18709. 2005. 60. 18385. 2006. 60. 17830. 64. 19000. 62. 18500. 60. 18000. 58. 17500. 56. 17000. 54. 16500. 52. 16000. 50. 15500. 48. 15000. Number of international tourist hotels Number of rooms. 1997 1998 1999 2000 2001 2002 2003 2004 2005 2006. Figure 1. Numbers of international hotels and rooms in Taiwan from 1997 to 2006. 5.
(13) 3. Review of the literature Farrell (1957) pioneered dividing cost efficiency into technical efficiency and allocative efficiency.. The technical efficiency evaluates the ability of a firm to. obtaining maximal output from a given set of inputs and the allocative efficiency the ability of a firm to use the inputs in optimal proportions, given their respective prices and the production technology.. These two measures are combined to provide a. measure of total economic efficiency.. The theories of efficiency measurement are very. important in economics, and also commonly and extensively used for other industrial applications. For example, studies of hotel efficiency are currently being conducted. In general, the two primary methods that have been used in efficiency estimation are the stochastic frontier approach (SFA) and data envelopment analysis (DEA).. The. literatures reviewed are grouped according to these two methods. 3.1 Papers based on SFA A few papers that used SFA in the hotel industry are summarized as follows: Anderson et al. (1999) employed a stochastic frontier technique to estimate managerial efficiency of 48 hotels in the United States in 1994.. They defined inputs as the. number of full-time equivalent employees, the number of rooms, total gaming related expenses, total food and beverage expenses, and other expenses, while defining output as the total revenue generated from rooms, gaming, food and beverages, and others. The price of labor was calculated as the total hotel revenue per full-time equivalent employee.. The room price was measured by hotel revenues divided by the product of. the number of rooms, the occupancy rate, and days per year.. The price of gaming,. food and beverages, and other expenses were all calculated by measuring each as a percentage of total revenue. efficiency level.. They found the hotel industry to be operating at an 89%. In particular, the average efficiency was estimated at 89.4%, with. the most and least efficient hotels operating at 92.1% and 84.3% efficiency levels, 6.
(14) respectively. Anderson et al. (1999) applied both DEA and SFA to estimate the efficiency of 31 corporate travel management departments.. They defined three inputs:. the total. expense of air, hotel, and car; labor expense, which includes the cost of exempt labor, hourly labor, and part-time labor; and other expenses, which include fee expense, technology costs, and building and occupancy expense.. Their inputs were transformed. into prices by dividing the three input categories by the number of trips.. The output. was the number of trips. Barros (2004) employed a stochastic cost frontier in Portugual’s hotel industry. He used a balanced-panel data during 1999-2001 to estimate a stochastic generalized Cobb-Douglas cost function with three inputs and two outputs.. Those three inputs. were prices of labor, capital and food while the two outputs were sales and nights occupied.. In addition, a dummy variable was used to account for the distinction. between historical Pousadas and regional Pousadas.. The research found that the. results were at best mixed, since the efficiency scores were low and not time-varying. For this reason, the author suggested an alteration of management procedures to enable an increase in efficiency, based on a governance environment framework. Wang et al. (2007) used a one-stage stochastic frontier approach to measure the relative efficiency of 66 international tourist hotels in Taiwan during 1992-2002 and to investigate the determinants of technical efficiency.. They also added the Malmquist. productivity index to estimate the range and the cause of the productivity change. They used the following four inputs, salaries, the area of food and beverage, the number of rooms, and other operating expenses, and the following three outputs, the number of room occupied, food and beverage revenue, and other operating revenue.. Their. empirical results revealed that the government policy increasing weekend vacation time has fostered domestic travel and expanded hotel industry. The local government’s 7.
(15) other expenditures had a significantly positive effect on international tourist hotel’s efficiency. Chen (2007) adopted a stochastic cost frontier to analyze the cost efficiency of 55 international tourist hotels in Taiwan.. He used three inputs (labor, food and beverage,. and materials) and one output (the total revenue) to measure hotel efficiency. In his result, the factor of operation type not only can affect hotel efficiency significantly, but also can be used to analyze whether the efficiency of the chain hotels is higher than that of independent hotels. 3.2 Papers based on DEA DEA has been employed by a good number of studies.. They are summarized as. follows: Bell and Morey (1995) adopted DEA to analyze the efficiency of 31 corporate travel departments.. The inputs used are the actual levels of expenditure for travel, i.e.,. air, hotel and rental cars, nominal levels of other expenditure, the level of environmental factors, i.e., ease of negotiating discounts, percentage of legs with commuter flights required and actual levels of support cost for labor, technology, fees, space, etc.. One. output used is the level of service provided, which is either excellent or average. Morey and Dittman (1995) also used DEA with nine inputs and four outputs to analyze the efficiency of 54 hotels in the United States.. The nine inputs used are room. division expenditure, energy costs, salaries, non-salary expenses for property, salaries and related expenses for variable advertising, non-salary expenses for variable advertising, fixed market expenditures, payroll and related expenses for administrative work, and non-salary expenses for administrative work. The four outputs used are total revenue, level of service delivered, market share, and the rate of growth. Anderson et al. (2000) employed DEA with their input-output data to analyze the efficiency of 48 hotels in the United States and to estimate the allocative, technical, pure 8.
(16) technical levels.. The inputs used are full-time equivalent employees, the number of. rooms, total gaming-related expenses, total food and beverage expenses, and other expenses. One output used is total revenue, which is generated from rooms, gaming, food and beverages, and other revenues. Their results indicated that the hotel industry was inefficient with a mean overall efficiency measure of approximately 42%. Literatures that adopted DEA to analyze the efficiency of the hotel industry in Taiwan included Tsaur (2001), Hwang and Chang (2003), and Chiang et al. (2004). These papers are reviewed as follows: Tsaur (2001) employed DEA with seven inputs and six outputs to analyze 53 international tourist hotels in Taiwan during 1996-1998. The seven inputs used were total operating expenses, the number of employees, the number of guest rooms, the total floor space of the catering division, the number of employees in the room division, the number of employees in the catering division, and catering cost.. The six outputs used. were total operating revenues, the number of rooms occupied, average daily rate, the average production value per employee in the catering division, total operating revenues of the room division, and total operating revenues of the catering division. Their results showed that the average operating efficiency score is 0.8733. However, 71.7% of the international tourist hotels in Taiwan present relative inefficiency. Hwang and Chang (2003) adopted DEA and added the Malmquist productivity index to measure and analyze the managerial performance in 45 Taiwanese hotels in 1998.. They also explored the cause of efficiency change during 1994-1998.. Their. results revealed that the managerial efficiency of Taiwan’s international tourist hotels was related to the level of internationalization of the hotels. The research of Chiang et al. (2004) was aimed at using DEA to measure hotel performance under three operational styles of international tourist hotels commonly seen in Taiwan since 2000:. independently owned and operated, franchise licensed, and 9.
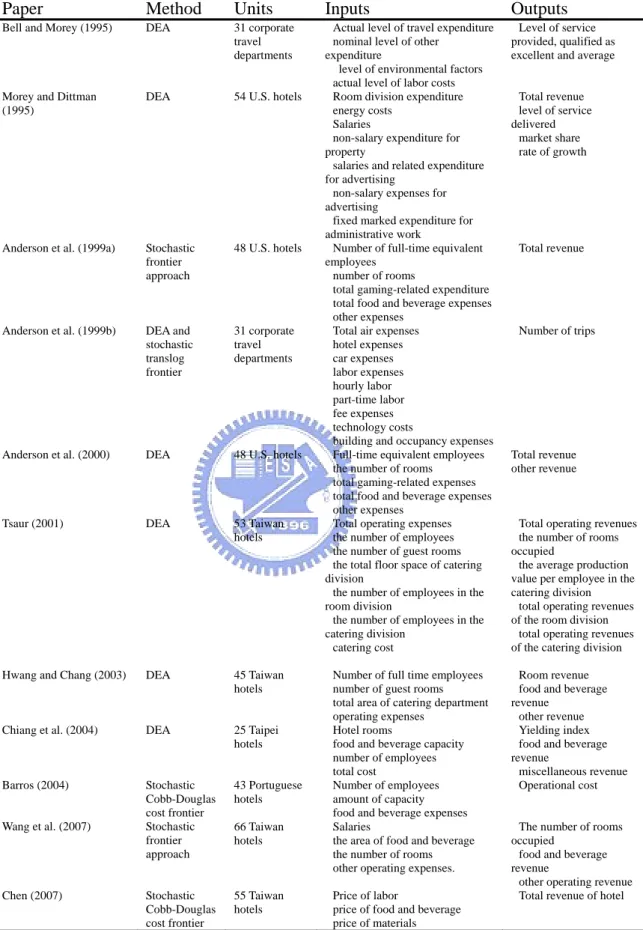
(17) managed by international hotel operators. The four inputs chosen by the hoteliers were hotel rooms, food and beverage capacity, number of employees, and total cost of the hotel. The three outputs were yielding index, food and beverage revenue, and miscellaneous revenue. They expected their results to provide hoteliers with a basis for constructing strategies and promotion plans. In addition, these results illustrated that not all of Taipei’s franchised or managed international tourist hotels performed more efficiently than the independent ones. 3.3 Tabular Summary It is apparent that the above-mentioned bibliography is quite thin for such a major tourism issue.. This paper departs from the previous literature in that it uses panel data. of international tourist hotels in Taiwan, related to the years 1997–2006. summarizes the previous studies on hotel efficiency.. 10. Table 2.
(18) Table 2. Recapitulation of studies on the hotel frontier efficiency Paper Method Units Inputs Bell and Morey (1995). DEA. 31 corporate travel departments. Morey and Dittman (1995). DEA. 54 U.S. hotels. Anderson et al. (1999a). Stochastic frontier approach. 48 U.S. hotels. Anderson et al. (1999b). DEA and stochastic translog frontier. 31 corporate travel departments. Anderson et al. (2000). DEA. 48 U.S. hotels. Tsaur (2001). DEA. 53 Taiwan hotels. Hwang and Chang (2003). DEA. 45 Taiwan hotels. Chiang et al. (2004). DEA. 25 Taipei hotels. Barros (2004). Stochastic Cobb-Douglas cost frontier Stochastic frontier approach. 43 Portuguese hotels. Stochastic Cobb-Douglas cost frontier. 55 Taiwan hotels. Wang et al. (2007). Chen (2007). Actual level of travel expenditure nominal level of other expenditure level of environmental factors actual level of labor costs Room division expenditure energy costs Salaries non-salary expenditure for property salaries and related expenditure for advertising non-salary expenses for advertising fixed marked expenditure for administrative work Number of full-time equivalent employees number of rooms total gaming-related expenditure total food and beverage expenses other expenses Total air expenses hotel expenses car expenses labor expenses hourly labor part-time labor fee expenses technology costs building and occupancy expenses Full-time equivalent employees the number of rooms total gaming-related expenses total food and beverage expenses other expenses Total operating expenses the number of employees the number of guest rooms the total floor space of catering division the number of employees in the room division the number of employees in the catering division catering cost Number of full time employees number of guest rooms total area of catering department operating expenses Hotel rooms food and beverage capacity number of employees total cost Number of employees amount of capacity food and beverage expenses Salaries the area of food and beverage the number of rooms other operating expenses.. 66 Taiwan hotels. Price of labor price of food and beverage price of materials. 11. Outputs Level of service provided, qualified as excellent and average. Total revenue level of service delivered market share rate of growth. Total revenue. Number of trips. Total revenue other revenue. Total operating revenues the number of rooms occupied the average production value per employee in the catering division total operating revenues of the room division total operating revenues of the catering division Room revenue food and beverage revenue other revenue Yielding index food and beverage revenue miscellaneous revenue Operational cost. The number of rooms occupied food and beverage revenue other operating revenue Total revenue of hotel.
(19) 4. The stochastic frontier approach The efficiency measurement begins with Farrell (1957), who drew upon the work of Debreu (1951) and Koopmans (1951) to define a simple measure of firm efficiency that could account for multiple inputs.. He illustrated his ideas using a simple example. involving firms that use two inputs to produce a single output, under the assumption of constant returns to scale.. Given the measure of technical efficiency, the overall cost. efficiency (CE) can be expressed as a product of technical and allocative efficiency measures: TE×AE = CE.. (1). Even though a cost function can be deterministically specified to account for many factors, a stochastic cost function that includes a random error in the formulation is frequently needed.. Because the error reflects both the cost inefficiency and the white. noise, a zero mean error term is theoretically incorrect.. There has been a large amount. of research to extend and apply this model ever since the stochastic frontier production function was taken up by Aigner et al. (1977) and Meeusen and van den Broeck (1977). They proposed models with a composite error structure.. The composite error structure. permits the measurement of efficiency in spite of white noise.. This is created with. seminal contributions to the stochastic frontier approach. The stochastic frontier cost function for panel data, for the i-th hotel (i=1,2, …,N) at the t-th period (t=1,2,…,T), is as follows: ln TCit = C ( X it , Yit , β i ) + Vit + U it .. (2). where TCit is the total cost for the i-th hotel at the t-th period; X it is a 1×k vector containing values of known functions of inputs of cost and other explanatory variables related to the i-th hotel at the t-th period; Yit is a 1×k vector containing values of known functions of output of revenue and other explanatory variables related to the i-th. 12.
(20) hotel at the t-th period; and β i is a k×1 vector of unknown parameters to be estimated. The Vits are assumed to be independent and identically distributed as N(0, σ V2 ).. They. are also independent of the Uits, which are non-negative random variables corresponding to technical inefficiency of cost. Moreover, Uits are assumed to be. (. ). independently distributed and truncated at zero of Half N µ , σ U2 .. In order to assist the maximum likelihood estimation, the variance terms are parameterized as σ U2 and σ V2 , respectively. Several more terms are defined based on them.. σ 2 = σ U2 + σ V2 and γ = σ U2 / σ 2 .. (3). Many scholars in the early empirical literature, such as Pitt and Lee (1981) and Kalirajan (1981), engaged in the illustration of these inefficiency effects. They took a two-stage approach. In the first stage, the stochastic frontier production function is estimated and the technical inefficiency effects are predicted based on the assumption that these inefficiency effects are caused by appropriate distributions. In addition, the models for technical inefficiency effects of the stochastic frontier functions have been proposed by Kumbhakar et al. (2003) and Reifschneider and Stevenson (1991). Battese and Coelli (1995) also proposed a model for technical inefficiency effects in a stochastic frontier production function for panel data. The model assumes that the inefficiency effects are stochastic. It also allows for the measurement of both technical changes in the stochastic frontier and time-varying technical inefficiencies.. In the. stochastic model of the frontier cost function, it is assumed that any deviation of the observed cost from the theoretical microeconomic cost function is simply due to random disturbances and inefficiency. The deviation is accounted for as the composite error term in the stochastic frontier model.. 13. In this case, the model of stochastic.
(21) frontier function for panel data is as follows: Yit = exp ( X it β + Vit − U it ) .. (4). where Yit is the production at the t-th period (t = 1,2,…,T) for the i-th firm (i = 1,2,…,N); xit is a 1×k vector of known values, equal to functions of inputs of product and other. explanatory variables corresponding to the i-th firm at the t-th period; β is a 1×k vector of unknown parameters to be computed; Vits are assumed to be iid N (0, σ V2 ) random errors, independently distributed from Uits; and Uits are non-negative random variables, corresponding to the technical inefficiency of production. Additionally, the technical inefficiency effect, Uit , in the stochastic frontier model (1) can be specified as follows: U it = Z itδ + θit .. (5). where θit is a random variable defined by the truncation of the normal distribution with zero mean and variance of σ 2 , such that the point of truncation is at − Z itδ . This model is a one-stage model that permits the simultaneous estimation by the two-stage procedure. However, the simple random component cannot very accurately model the effect of variables that are farther away from the control of the production unit being analyzed. Decomposition techniques go back to Jondrow et al. (1982) and take advantage of the conditional distribution to provide firm-specific inefficiency estimates, not purely overall averages. The cost efficiency (CE), a value between zero and one, reveals the extent to which a hotel succeeds in minimizing cost given input and output prices.. It can be. formulated as follows: CEit =. C (Yit , X it , β ) exp (Vit ) C min = = exp ( −U it ) . C C (Yit , X it , β ) exp (U it + Vit ). 14. (6).
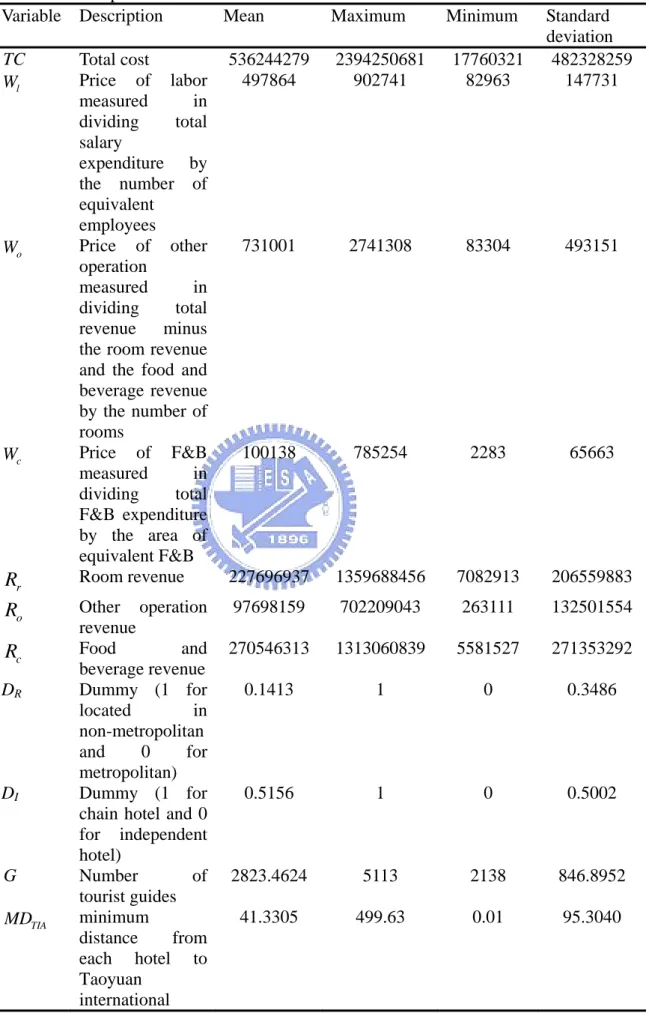
(22) 5. Data and empirical model 5.1 Sample and data sources. In order to estimate the cost frontier, the panel data used in this study consisted of data obtained from the annual report of international tourist hotels published by Taiwan Tourism Bureau during 1997~2006 concerning 66 different international hotels. Although the original data contained a total of 660 (66×10) samples, only hotels with complete data were chosen to be samples in this research.. In addition, all nominal. variables are transformed into real variables in 1997 prices by GDP deflators. The change in the GDP deflator provides the most general measure of overall price change, taking into account changes in total cost, price of labor, price of other operations, price of food and beverage, room revenue, other operation revenue, and food and beverage revenue. 5.2 Variables. There are two main businesses for international tourist hotels.. One is the renting. of rooms and the other the service of food and beverage. A stochastic generalized translog cost frontier function was used as the empirical model. The cost frontier function used has three inputs and three outputs. The three inputs are the price of labor, the price of food and beverage, and the price of other operations. The three outputs are room revenue, food and beverage revenue, and other operation revenue. The function involves five environmental variables, including the hotels located in non-metropolitan areas, chain hotels, number of tourist guides, the minimum distance from each hotel to Taoyuan international airport and the minimum distance from each hotel to Kaohsiung international airport. Moreover, the total operating cost comprises labor cost, fuel and energy, materials, and circumstantial services as the dependent variables. All those variables are detailed as follows. z. Input variables: 15.
(23) 1. Price of labor ( Wl ): measured by dividing the total salary expenditure by the number of equivalent employees. 2. Price of other operations ( Wo ): measured by dividing the other operations expenditure by the number of rooms. 3. Price of food and beverage ( Wc ): measured by dividing the total food and beverage expenditure by the area of equivalent food and beverage. z. Output variables:. 1. Room revenue ( Rr ): the room revenue of an international hotel. 2. Other operation revenue ( Ro ):. measured by the total revenue minus the room. revenue and the food and beverage revenue. 3. Food and beverage revenue ( Rc ):. the food and beverage revenue of an. international hotel. z. Environmental variables:. 1. Non-metropolitan area ( DR ): a dummy variable, with a value of one when a hotel is located in a non-metropolitan area and zero for a metropolitan area.. 2. Chain hotel ( DI ): a dummy variable, with a value of one for a chain hotel and zero for an independent hotel.. 3. Tourist guides ( G ): the number of tourist guides. 4. Distance from Taoyuan international airport ( MDTIA ):. the minimum distance from. each hotel to Taoyuan international airport. 5. Distance from Kaohsiung international airport ( MDKIA ):. the minimum distance. from each hotel to Kaohsiung international airport. The characteristics of the variables are summarized in Table 3. 5.3 Empirical model. The model used in this study is a translog cost function with three inputs, three 16.
(24) outputs, and five environmental variables (two of these are dummy variables). More specifically, the model can be expressed as follows: ln (TCit ) = β0 + β1 ln (Wlit ) + β2 ln (Woit ) + β3 ln (Wcit ) + β4 ln ( Rrit ) + β5 ln ( Roit ) + β6 ln ( Rcit ) 2 2 2 2 2 1 1 1 1 1 + β7 ⎡⎣ln (Wlit )⎤⎦ + β8 ⎡⎣ln (Woit )⎤⎦ + β9 ⎡⎣ln (Wcit ) ⎤⎦ + β10 ⎡⎣ln ( Rrit )⎤⎦ + β11 ⎡⎣ln ( Roit )⎤⎦ 2 2 2 2 2 2 1 + β12 ⎡⎣ln ( Rcit ) ⎤⎦ + β13 ln (Wlit ) ln (Woit ) + β14 ln (Wlit ) ln (Wcit ) + β15 ln (Wlit ) ln ( Rrit ) + β16 ln (Wlit ) ln ( Roit ) 2 +β17 ln (Wlit ) ln ( Rcit ) + β18 ln (Woit ) ln (Wcit ) + β19 ln (Woit ) ln ( Rrit ) + β20 ln (Woit ) ln ( Roit ) + β21 ln (Woit ) ln ( Rcit ). +β22 ln (Wcit ) ln ( Rrit ) + β23 ln (Wcit ) ln ( Roit ) + β24 ln (Wcit ) ln ( Rcit ) + β25 ln ( Rrit ) ln ( Roit ) + β26 ln ( Rrit ) ln ( Rcit ) +β27 ln ( Roit ) ln ( Rcit ) +Vit +Uit. (7). U it = δ 0 + δ1DRi + δ 2 DIi + δ 3Git + δ 4 MDTIAi + δ 5 MDKIAi + θit. (8). and. where i represents the number of international hotels, i =1,2,…,N;. t is time, t = 1,2,…,T; TC is the total cost;. Wl is the price of labor; Wo is the price of other operations; Wc is the price of F&B;. Rr is the room revenue; Ro is the other operation revenue; Rc is the food and beverage revenue; DR is the dummy variable of non-metropolitan area; DI is the dummy variable of the chain hotel; G is the number of tourist guides;. MDTIA is distance from Taoyuan international airport; and MDKIA is distance from Kaohsiung international airport.. 17.
(25) Equation (7) specifies the stochastic cost frontier function. The deviation from the frontier occurs because of the random shocks and statistical noise ( Vit ) as well as technical inefficiency ( U it ).. Equation (8) is a one-sided term reflecting technical. inefficiency. The characteristics of the variables are summarized in Table 3.. 18.
(26) Table 3. Descriptive statistics of variables Variable Description Mean. Maximum. TC Wl. 536244279 497864. 2394250681 902741. 17760321 82963. Standard deviation 482328259 147731. 731001. 2741308. 83304. 493151. 100138. 785254. 2283. 65663. 227696937. 1359688456. 7082913. 206559883. 97698159. 702209043. 263111. 132501554. 270546313. 1313060839. 5581527. 271353292. 0.1413. 1. 0. 0.3486. 0.5156. 1. 0. 0.5002. 2823.4624. 5113. 2138. 846.8952. 41.3305. 499.63. 0.01. 95.3040. Wo. Wc. Rr Ro Rc DR. DI. G. MDTIA. Total cost Price of labor measured in dividing total salary expenditure by the number of equivalent employees Price of other operation measured in dividing total revenue minus the room revenue and the food and beverage revenue by the number of rooms Price of F&B measured in dividing total F&B expenditure by the area of equivalent F&B Room revenue Other operation revenue Food and beverage revenue Dummy (1 for located in non-metropolitan and 0 for metropolitan) Dummy (1 for chain hotel and 0 for independent hotel) Number of tourist guides minimum distance from each hotel to Taoyuan international. 19. Minimum.
(27) MDKIA. airport minimum distance from each hotel to Kaohsiung international airport. 256.9486. 400.97. 20. 7.33. 134.9411.
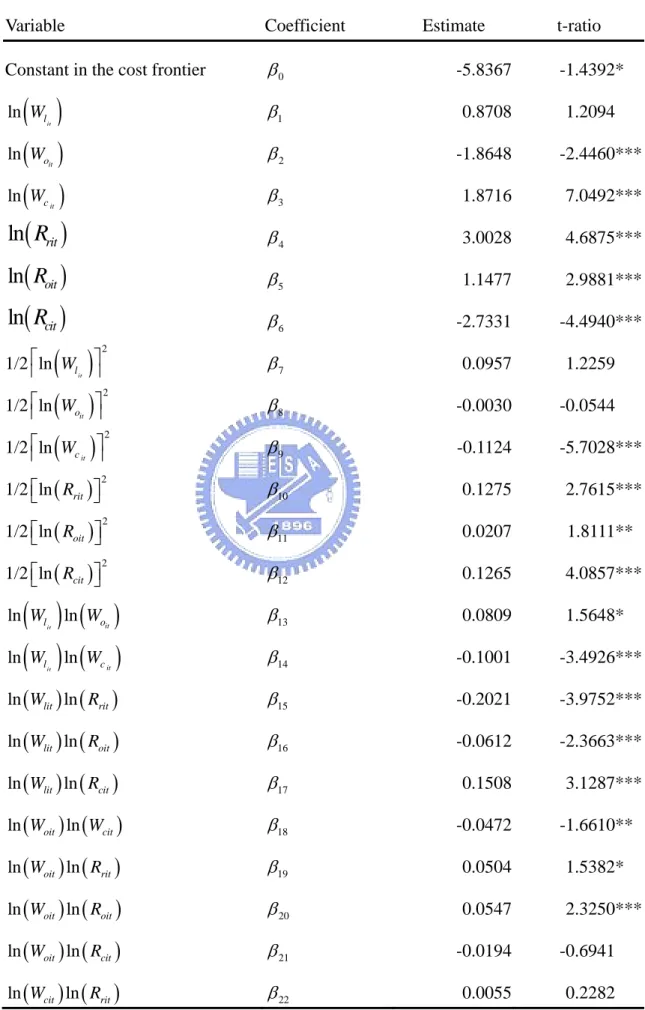
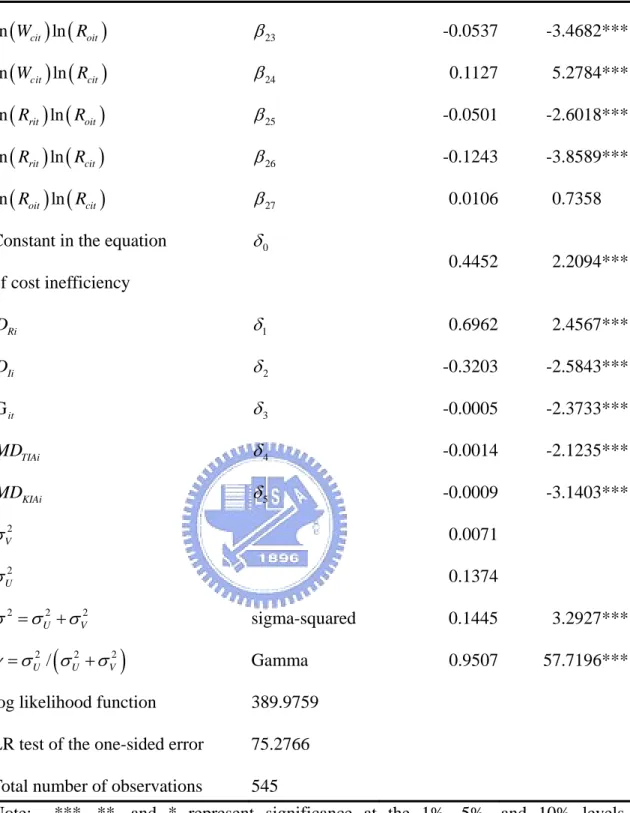
(28) 6. Empirical results In this study, Frontier 4.1 is applied to estimate the parameters of the translog cost frontier function. The results of the stochastic frontier estimation are shown in Tables 4 and 5. Table 4 summarizes the estimation results obtained for the stochastic frontier approach, showing that the translog cost function specified in the previous chapter fits the data well. The coefficients of most inputs and outputs are statistically significant. That means the selection of inputs and outputs is appropriate for the cost frontier estimation. The coefficients with respect to output variables, room revenue β 4 and other operation revenue β 5 , are 3.0028, and 1.1477, respectively.. The positive signs. indicate that an increase in output will lead to an increase in the total cost. Except for the hotel located in the non-metropolitan area, the coefficients of all environmental variables are negative. decrease cost inefficiency.. That means these four environments can. The results also show that δ1 is significantly positive. while δ 2 , δ 3 , δ 4 , and δ 5 are significantly negative.. A positive value indicates that. an increase in environmental variables will lead to an increase in cost inefficiency.. A. negative value indicates that an increase in environmental variables will lead to a decrease in cost inefficiency. The environmental variable of operation type, such as chain hotels, is significant at the 1% level. The environmental variable for the number of tourist guides is also significant at the 1% level. The environmental variables of international transportation, such as international airports, are significant at the 1% level. In addition to all of the above, the environmental variables significantly affect hotel cost efficiency. The ratio of the variability for U and V can be used to estimate the relative inefficiency in a hotel. It is an estimate of the amount of variation stemming from inefficiency relative to noise for the sample. 21. The values of λ and γ , where.
(29) λ = σ U / σ V and γ = σ U2 / σ V2 , are 4.3916 and 0.9507, respectively. Therefore, γ is significant at 1% level.. The fact that γ is close to one reveals that a significant. proportion of variance in the composite error term comes from the inefficiency effect. For this reason, it is appropriate to use the stochastic frontier approach in this study.. 22.
(30) Table 4. Parameter estimates of the translog cost frontier function Variable. Coefficient. Constant in the cost frontier. β0. -5.8367. -1.4392*. β1. 0.8708. 1.2094. ln Woit. β2. -1.8648. -2.4460***. c it. β3. 1.8716. 7.0492***. β4. 3.0028. 4.6875***. β5. 1.1477. 2.9881***. β6. -2.7331. -4.4940***. β7. 0.0957. 1.2259. β8. -0.0030. -0.0544. β9. -0.1124. -5.7028***. ( ). ln Wl. it. ( ) ln (W ) ln ( Rrit ) ln ( Roit ) ln ( Rcit ). ( ). 1/2 ⎡ ln Wl ⎤ it ⎣ ⎦. 2. 1/2 ⎡ ln Woit ⎤ ⎣ ⎦. 2. ( ) 1/2 ⎡ ln (W ) ⎤ ⎣ ⎦. 2. c it. Estimate. t-ratio. 1/2 ⎡⎣ ln ( Rrit ) ⎤⎦. 2. β10. 0.1275. 2.7615***. 1/2 ⎡⎣ ln ( Roit ) ⎤⎦. 2. β11. 0.0207. 1.8111**. 1/2 ⎡⎣ ln ( Rcit ) ⎤⎦. 2. β12. 0.1265. 4.0857***. β13. 0.0809. 1.5648*. β14. -0.1001. -3.4926***. ln (Wlit ) ln ( Rrit ). β15. -0.2021. -3.9752***. ln (Wlit ) ln ( Roit ). β16. -0.0612. -2.3663***. ln (Wlit ) ln ( Rcit ). β17. 0.1508. 3.1287***. ln (Woit ) ln (Wcit ). β18. -0.0472. -1.6610**. ln (Woit ) ln ( Rrit ). β19. 0.0504. 1.5382*. ln (Woit ) ln ( Roit ). β 20. 0.0547. 2.3250***. ln (Woit ) ln ( Rcit ). β 21. -0.0194. -0.6941. ln (Wcit ) ln ( Rrit ). β 22. 0.0055. 0.2282. ( ) ( ) ln (W ) ln (W ) ln Wl ln Woit it. l it. c it. 23.
(31) ln (Wcit ) ln ( Roit ). β 23. -0.0537. -3.4682***. ln (Wcit ) ln ( Rcit ). β 24. 0.1127. 5.2784***. ln ( Rrit ) ln ( Roit ). β 25. -0.0501. -2.6018***. ln ( Rrit ) ln ( Rcit ). β 26. -0.1243. -3.8589***. ln ( Roit ) ln ( Rcit ). β 27. 0.0106. 0.7358. Constant in the equation. δ0 0.4452. 2.2094***. of cost inefficiency DRi. δ1. 0.6962. 2.4567***. DIi. δ2. -0.3203. -2.5843***. G it. δ3. -0.0005. -2.3733***. MDTIAi. δ4. -0.0014. -2.1235***. MDKIAi. δ5. -0.0009. -3.1403***. σ V2. 0.0071. σ U2. 0.1374. σ 2 = σ U2 + σ V2. sigma-squared. 0.1445. 3.2927***. γ = σ U2 / (σ U2 + σ V2 ). Gamma. 0.9507. 57.7196***. log likelihood function. 389.9759. LR test of the one-sided error. 75.2766. Total number of observations. 545. Note:. ***, **, and * represent significance at the 1%, 5%, and 10% levels, respectively.. Table 5 shows the efficiency scores measured from the residuals. The mean efficiency is 91.15%. This value indicates that, to operate efficiently, hotels could only reduce their input costs by 8.85% without decreasing their outputs. In this study, the hotel outputs are defined as room revenue, food and beverage revenue, and other. 24.
(32) operation revenue. The score of the maximum hotel efficiency is 97.79% while the minimum efficiency score is 71.29%.. The median efficiency is 92.39% and the. standard deviation is 5.11%. These efficiency scores are higher than those listed in previous literatures in the same industry. For example, the corresponding values are 21.6%, 80.29%, and 89.4% in Portugal (Barros, 2004), Taiwan (Chen, 2007), and the United States (Anderson et. al, 1999), respectively.. Tables 6 to 15 are efficiency. scores of individual international tourist hotels, one table for each year from 1997 to 2006.. 25.
(33) Table 5. Average cost efficiency rankings of Taiwanese international tourist hotels ID. Hotel. 1 2. Grand Hotel Ambassador Hotel. 3. Mandarina Crown Hotel Imperial Taipei. 4 5 6 7. Cost efficiency 0.8322 0.9463 0.8707 0.8499 0.9383 0.9423. 8. Gloria Prince Hotel Emperor Hotel Hotel Riverview Taipei Caesar Park Taipei. 9 10 11. Golden China Hotel San Want Hotel Brother Hotel. 0.9648 0.9114. 12. Santos Hotel. 13. The Ritz Landis Hotel United Hotel. 14 15. 25. Sheraton Taipei Hotel Taipei Fortuna Hotel Holiday Inn Asiaworld Taipei Hotel Royal Taipei Howard Plaza Hotel Rebar Crowne Plaza Taipei Grand Hyatt Taipei Grand Formosa Regent Taipei Sherwood Hotel Taipei Far Eastern Plaza Hotel Taipei Westin Hotel. 26. Hotel Kingdom. 27. Holiday Garden Kaohsiung Ambassador Hotel Kaohsiung Han-Hsien international Hotel Grand Hi-Lai Hotel Howard Plaza Hotel Kaohsiung Splendor Kaohsiung Park Hotel. 16 17 18 19 20 21 22 23 24. 28 29 30 31 32 33. Mean efficiency Highest efficiency Lowest efficiency Median efficiency Standard deviation. 0.9395 0.9636. 0.9432 0.9118 0.9439 0.9546 0.8845 0.9123 0.8356 0.9699 0.9272 0.8655 0.8756 0.9687 0.9617 0.9503 0.9539 0.8796 0.8945 0.8553 0.8966 0.9370 0.9370 0.8351 0.9418. Ranking. ID. Hotel. 62 18. 34 35. 55. 36. Hotel National Plaza International Hotel Evergreen Laurel Hotel. 59. 37. 27 22 26. 38 39 40. 6. 41. 5 42 20. 42 43 44. 41. 45. 19. 46. 9. 47. 50. 48. 40. 49. 60. 50. Howard Beach Resort Kending Hibiscus Resorts. 2 32 56. 51 52 53. Lalu Sun Moon Lake Taoyuan Holiday Hotel Hotel Tainan. 54 3. 54 55. Ta Shee Resort Hotel Hotel Royal Hsinchu. 8. 56. 14. 57. 11. 58. 52. 59. 48. 60. Ambassador Hotel Hsinchu Formosan Naruwan Hotel Tayih Landis Tainan Hotel Jen Dow International Hotel Plaza Hotel. 58. 61. Le Midi Hotel Chitou. 46. 62. Royal Less Hotel. 29 29. 63 64. 61. 65. Miramar Garden Taipei Chinatrust Hotel Sun Moon Lake EI Dorado Hotel. 23. 66. Evergreen Plaza Hotel Tainan. 0.9115 0.9779 0.7129 0.9239 0.0511. 26. Howard Plaza Hotel Taichung Splendor Taichung Hotel Royal Chiao-His Marshal Hotel Chinatrust Hotel Hualien Parkview Hotel Taroko Hotel Landis China Yangmingshan The Grand Hotel Kaohsiung Caesar Park Hotel Kending Hotel Royal Chihpen Spa Grand Formosa Hotel. Cost efficiency 0.9149. Ranking. 0.9506. 13. 0.9370. 29. 0.9636. 6. 0.9019 0.9779. 45 1. 0.9139. 39. 0.9373. 28. 0.9266 0.9473. 33 17. 0.9164. 36. 0.8965. 47. 0.8919. 49. 0.9080. 43. 0.8065. 64. 0.9140. 38. 0.7129. 66. 0.9404 0.9211. 25 34. 0.9498. 15. 0.9545. 10. 0.9411. 24. 0.9424. 21. 0.8812. 51. 0.9498. 15. 0.9033. 44. 0.7612. 65. 0.8762. 53. 37. 0.9678. 4. 0.8560. 57. 0.9515. 12. 0.8295. 63. 0.9186. 35.
(34) Table 6. The efficiency scores of international tourist hotels in Taiwan (1997) ID. Hotel. Cost. ID. Hotel. efficiency 1. The Grand Hotel. 2. The Ambassador Hotel. 3. Mandarina Crown Hotel. 4. Imperial Taipei. 5. Gloria Prince Hotel. 6. Emperor Hotel. 7. Hotel Riverview Taipei. 8. Caesar Park Taipei. 9. Golden China Hotel. 10. San Want Hotel. 11. Brother Hotel. 12. Santos Hotel. 13. The Ritz Landis Hotel. 14. United Hotel. 15. Sheraton Taipei Hotel. 16. Taipei Fortuna Hotel. 17. Holiday Inn Asiaworld Taipei. 18. Hotel Royal Taipei. 19. Howard Plaza Hotel. 20. Rebar Crowne Plaza Taipei. 21. Grand Hyatt Taipei. 22. Grand Formosa Regent Taipei. 23. The Sherwood Hotel Taipei. 24. Far Eastern Plaza Hotel Taipei. 26. Hotel Kingdom. 27. Holiday Garden Kaohsiung Mean efficiency Highest efficiency Lowest efficiency Median efficiency Standard deviation. Cost efficiency. 0.6244 0.9326 0.7960 0.3994 0.9575 0.9631 0.9369 0.9234 0.9623 0.8078 0.9383 0.8976 0.9452 0.9530 0.9261 0.9336 0.7561 0.9712 0.9471 0.8906 0.9022 0.9690 0.9620 0.9494 0.8937 0.9182 0.8947 0.9712 0.3994 0.9294 0.1042. 27. 28. The Ambassador Hotel Kaohsiung. 29. Han-Hsien international Hotel. 30. Grand Hi-Lai Hotel. 31. Howard Plaza Hotel Kaohsiung. 33. Park Hotel. 34. Hotel National. 35. Plaza International Hotel. 36. Evergreen Laurel Hotel. 37. Howard Plaza Hotel Taichung. 40. Marshal Hotel. 41. Chinatrust Hotel Hualien. 42. Parkview Hotel. 44. Hotel Landis China Yangmingshan. 45. The Grand Hotel Kaohsiung. 46. Caesar Park Hotel Kending. 47. Hotel Royal Chihpen Spa. 48. Grand Formosa Hotel. 52. Taoyuan Holiday Hotel. 53. Hotel Tainan. 54. Ta Shee Resort Hotel. 59. Jen Dow International Hotel. 61. Le Midi Hotel Chitou. 63. Miramar Garden Taipei. 64. Chinatrust Hotel Sun Moon Lake. 65. EI Dorado Hotel. 0.7802 0.9131 0.9497 0.9211 0.9562 0.8566 0.9412 0.8894 0.9591 0.9264 0.9411 0.9449 0.8954 0.8447 0.9294 0.9478 0.6214 0.9377 0.9613 0.9599 0.9279 0.9234 0.8569 0.9577 0.8295.
(35) Table 7. The efficiency scores of international tourist hotels in Taiwan (1998) ID. Hotel. Cost. ID. Hotel. efficiency 1. The Grand Hotel. 2. The Ambassador Hotel. 3. Mandarina Crown Hotel. 4. Imperial Taipei. 5. Gloria Prince Hotel. 6. Emperor Hotel. 7. Hotel Riverview Taipei. 8. Caesar Park Taipei. 9. Golden China Hotel. 10. San Want Hotel. 11. Brother Hotel. 12. Santos Hotel. 13. The Ritz Landis Hotel. 14. United Hotel. 15. Sheraton Taipei Hotel. 16. Taipei Fortuna Hotel. 17. Holiday Inn Asiaworld Taipei. 18. Hotel Royal Taipei. 19. Howard Plaza Hotel. 20. Rebar Crowne Plaza Taipei. 21. Grand Hyatt Taipei. 22. Grand Formosa Regent Taipei. 23. The Sherwood Hotel Taipei. 24. Far Eastern Plaza Hotel Taipei. 26. Hotel Kingdom. 27. Holiday Garden Kaohsiung Mean efficiency Highest efficiency Lowest efficiency Median efficiency Standard deviation. Cost efficiency. 0.7562 0.9331 0.8482 0.9039 0.9509 0.9388 0.8025 0.9645 0.9596 0.8830 0.9348 0.9081 0.9346 0.8973 0.9242 0.8387 0.8464 0.9622 0.9412 0.8815 0.9217 0.9660 0.9573 0.9610 0.9443 0.8956 0.9074 0.9660 0.6475 0.9311 0.0648. 28. 28. The Ambassador Hotel Kaohsiung. 29. Han-Hsien international Hotel. 30. Grand Hi-Lai Hotel. 31. Howard Plaza Hotel Kaohsiung. 33. Park Hotel. 34. Hotel National. 35. Plaza International Hotel. 36. Evergreen Laurel Hotel. 37. Howard Plaza Hotel Taichung. 40. Marshal Hotel. 41. Chinatrust Hotel Hualien. 42. Parkview Hotel. 44. Hotel Landis China Yangmingshan. 45. The Grand Hotel Kaohsiung. 46. Caesar Park Hotel Kending. 47. Hotel Royal Chihpen Spa. 48. Grand Formosa Hotel. 49. Howard Beach Resort Kending. 52. Taoyuan Holiday Hotel. 53. Hotel Tainan. 54. Ta Shee Resort Hotel. 59. Jen Dow International Hotel. 60. Plaza Hotel. 61. Le Midi Hotel Chitou. 63. Miramar Garden Taipei. 64. Chinatrust Hotel Sun Moon Lake. 0.7325 0.9057 0.9388 0.9331 0.9261 0.8909 0.9647 0.9192 0.9621 0.9204 0.9294 0.9432 0.9224 0.8331 0.9518 0.9477 0.8132 0.8815 0.9327 0.9634 0.9394 0.9365 0.6475 0.9606 0.8700 0.9654.
(36) Table 8. The efficiency scores of international tourist hotels in Taiwan (1999) ID. Hotel. Cost. ID. Hotel. efficiency 1. The Grand Hotel. 2. The Ambassador Hotel. 3. Mandarina Crown Hotel. 4. Imperial Taipei. 5. Gloria Prince Hotel. 6. Emperor Hotel. 7. Hotel Riverview Taipei. 8. Caesar Park Taipei. 10. San Want Hotel. 11. Brother Hotel. 12. Santos Hotel. 13. The Ritz Landis Hotel. 14. United Hotel. 15. Sheraton Taipei Hotel. 16. Taipei Fortuna Hotel. 17. Holiday Inn Asiaworld Taipei. 18. Hotel Royal Taipei. 19. Howard Plaza Hotel. 20. Rebar Crowne Plaza Taipei. 21. Grand Hyatt Taipei. 22. Grand Formosa Regent Taipei. 23. The Sherwood Hotel Taipei. 24. Far Eastern Plaza Hotel Taipei. 26. Hotel Kingdom. 27. Holiday Garden Kaohsiung. 28. The Ambassador Hotel Kaohsiung. 29. Han-Hsien international Hotel Mean efficiency Highest efficiency Lowest efficiency Median efficiency Standard deviation. Cost efficiency. 0.7008 0.9425 0.8112 0.8532 0.9004 0.9489 0.9463 0.9607 0.8973 0.9450 0.9217 0.9376 0.9368 0.9224 0.9100 0.8987 0.9698 0.9414 0.8759 0.9230 0.9633 0.9616 0.9593 0.9218 0.9171 0.8168 0.9018 0.9079 0.9698 0.7008 0.9230 0.0567. 29. 30. Grand Hi-Lai Hotel. 31. Howard Plaza Hotel Kaohsiung. 33. Park Hotel. 34. Hotel National. 35. Plaza International Hotel. 36. Evergreen Laurel Hotel. 37. Howard Plaza Hotel Taichung. 38. The Splendor Taichung. 40. Marshal Hotel. 41. Chinatrust Hotel Hualien. 42. Parkview Hotel. 44. Hotel Landis China Yangmingshan. 45. The Grand Hotel Kaohsiung. 46. Caesar Park Hotel Kending. 47. Hotel Royal Chihpen Spa. 48. Grand Formosa Hotel. 49. Howard Beach Resort Kending. 52. Taoyuan Holiday Hotel. 53. Hotel Tainan. 54. Ta Shee Resort Hotel. 55. Hotel Royal Hsinchu. 59. Jen Dow International Hotel. 60. Plaza Hotel. 61. Le Midi Hotel Chitou. 63. Miramar Garden Taipei. 64. Chinatrust Hotel Sun Moon Lake. 0.9370 0.9353 0.9653 0.8859 0.9463 0.9325 0.9463 0.8635 0.9222 0.8958 0.9185 0.9433 0.8777 0.9331 0.9404 0.7553 0.9444 0.9006 0.9675 0.9510 0.8215 0.8545 0.7808 0.9405 0.8410 0.9314.
(37) Table 9. The efficiency scores of international tourist hotels in Taiwan (2000) ID. Hotel. Cost. ID. Hotel. efficiency 1. The Grand Hotel. 2. The Ambassador Hotel. 3. Mandarina Crown Hotel. 4. Imperial Taipei. 5. Gloria Prince Hotel. 6. Emperor Hotel. 7. Hotel Riverview Taipei. 8. Caesar Park Taipei. 9. Golden China Hotel. 10. San Want Hotel. 11. Brother Hotel. 12. Santos Hotel. 13. The Ritz Landis Hotel. 14. United Hotel. 15. Sheraton Taipei Hotel. 16. Taipei Fortuna Hotel. 17. Holiday Inn Asiaworld Taipei. 18. Hotel Royal Taipei. 19. Howard Plaza Hotel. 20. Rebar Crowne Plaza Taipei. 21. Grand Hyatt Taipei. 22. Grand Formosa Regent Taipei. 23. The Sherwood Hotel Taipei. 24. Far Eastern Plaza Hotel Taipei. 25. The Westin Hotel. 26. Hotel Kingdom. 27. Holiday Garden Kaohsiung Mean efficiency Highest efficiency Lowest efficiency Median efficiency Standard deviation. Cost efficiency. 0.8866 0.9323 0.8372 0.8813 0.9096 0.9439 0.9536 0.9668 0.9683 0.9096 0.9516 0.9089 0.9404 0.9736 0.9322 0.9129 0.9085 0.9674 0.9448 0.8597 0.8643 0.9658 0.9608 0.9645 0.9411 0.8320 0.8274 0.9058 0.9736 0.5931 0.9279 0.0693. 30. 28. The Ambassador Hotel Kaohsiung. 29. Han-Hsien international Hotel. 30. Grand Hi-Lai Hotel. 31. Howard Plaza Hotel Kaohsiung. 32. The Splendor Kaohsiung. 33. Park Hotel. 34. Hotel National. 35. Plaza International Hotel. 36. Evergreen Laurel Hotel. 37. Howard Plaza Hotel Taichung. 38. The Splendor Taichung. 40. Marshal Hotel. 41. Chinatrust Hotel Hualien. 42. Parkview Hotel. 44. Hotel Landis China Yangmingshan. 45. The Grand Hotel Kaohsiung. 46. Caesar Park Hotel Kending. 47. Hotel Royal Chihpen Spa. 48. Grand Formosa Hotel. 49. Howard Beach Resort Kending. 52. Taoyuan Holiday Hotel. 53. Hotel Tainan. 54. Ta Shee Resort Hotel. 55. Hotel Royal Hsinchu. 59. Jen Dow International Hotel. 60. Plaza Hotel. 61. Le Midi Hotel Chitou. 0.8270 0.8525 0.9294 0.9264 0.8952 0.9321 0.8826 0.9359 0.9347 0.9526 0.9390 0.8859 0.9134 0.9331 0.9406 0.9079 0.8113 0.9163 0.5931 0.9013 0.9073 0.9637 0.9612 0.9629 0.8208 0.9600 0.6806.
(38) Table 10. The efficiency scores of international tourist hotels in Taiwan (2001) ID. Hotel. Cost. ID. Hotel. efficiency 1. The Grand Hotel. 2. The Ambassador Hotel. 3. Mandarina Crown Hotel. 4. Imperial Taipei. 5. Gloria Prince Hotel. 6. Emperor Hotel. 7. Hotel Riverview Taipei. 8. Caesar Park Taipei. 9. Golden China Hotel. 11. Brother Hotel. 12. Santos Hotel. 13. The Ritz Landis Hotel. 14. United Hotel. 15. Sheraton Taipei Hotel. 16. Taipei Fortuna Hotel. 17. Holiday Inn Asiaworld Taipei. 18. Hotel Royal Taipei. 19. Howard Plaza Hotel. 20. Rebar Crowne Plaza Taipei. 21. Grand Hyatt Taipei. 22. Grand Formosa Regent Taipei. 23. The Sherwood Hotel Taipei. 24. Far Eastern Plaza Hotel Taipei. 25. The Westin Hotel. 26. Hotel Kingdom. 27. Holiday Garden Kaohsiung. 28. The Ambassador Hotel Kaohsiung Mean efficiency Highest efficiency Lowest efficiency Median efficiency Standard deviation. Cost efficiency. 0.8360 0.9354 0.8968 0.8710 0.9274 0.9052 0.9622 0.9589 0.9617 0.9303 0.9074 0.9362 0.9586 0.9091 0.9245 0.8581 0.9654 0.9373 0.8147 0.8327 0.9676 0.9574 0.9281 0.9277 0.7504 0.8124 0.8405 0.8915 0.9765 0.6169 0.9178 0.0747. 31. 29. Han-Hsien international Hotel. 30. Grand Hi-Lai Hotel. 31. Howard Plaza Hotel Kaohsiung. 32. The Splendor Kaohsiung. 33. Park Hotel. 34. Hotel National. 35. Plaza International Hotel. 36. Evergreen Laurel Hotel. 37. Howard Plaza Hotel Taichung. 38. The Splendor Taichung. 40. Marshal Hotel. 41. Chinatrust Hotel Hualien. 42. Parkview Hotel. 44. Hotel Landis China Yangmingshan. 45. The Grand Hotel Kaohsiung. 46. Caesar Park Hotel Kending. 47. Hotel Royal Chihpen Spa. 48. Grand Formosa Hotel. 49. Howard Beach Resort Kending. 50. The Hibiscus Resorts. 52. Taoyuan Holiday Hotel. 53. Hotel Tainan. 54. Ta Shee Resort Hotel. 55. Hotel Royal Hsinchu. 56. The Ambassador Hotel Hsinchu. 59. Jen Dow International Hotel. 60. Plaza Hotel. 0.8816 0.8880 0.9136 0.8153 0.9220 0.8939 0.9473 0.9238 0.9500 0.9174 0.8398 0.9362 0.9336 0.9006 0.8511 0.7797 0.9181 0.7519 0.9261 0.6169 0.8920 0.9278 0.9523 0.9498 0.8639 0.9765 0.6563.
(39) Table 11. The efficiency scores of international tourist hotels in Taiwan (2002) ID. Hotel. Cost. ID. Hotel. efficiency 1. The Grand Hotel. 2. The Ambassador Hotel. 3. Mandarina Crown Hotel. 4. Imperial Taipei. 5. Gloria Prince Hotel. 6. Emperor Hotel. 7. Hotel Riverview Taipei. 8. Caesar Park Taipei. 9. Golden China Hotel. 11. Brother Hotel. 12. Santos Hotel. 13. The Ritz Landis Hotel. 14. United Hotel. 15. Sheraton Taipei Hotel. 16. Taipei Fortuna Hotel. 17. Holiday Inn Asiaworld Taipei. 18. Hotel Royal Taipei. 19. Howard Plaza Hotel. 20. Rebar Crowne Plaza Taipei. 21. Grand Hyatt Taipei. 22. Grand Formosa Regent Taipei. 23. The Sherwood Hotel Taipei. 24. Far Eastern Plaza Hotel Taipei. 25. The Westin Hotel. 26. Hotel Kingdom. 27. Holiday Garden Kaohsiung. 28. The Ambassador Hotel Kaohsiung Mean efficiency Highest efficiency Lowest efficiency Median efficiency Standard deviation. Cost efficiency. 0.9185 0.9470 0.9014 0.8596 0.9625 0.9313 0.9532 0.9608 0.9619 0.9520 0.9213 0.9410 0.9571 0.8775 0.9132 0.9378 0.9696 0.9260 0.8150 0.7955 0.9697 0.9587 0.9341 0.9344 0.7812 0.8665 0.8800 0.9062 0.9697 0.7076 0.9213 0.0586. 32. 29. Han-Hsien international Hotel. 30. Grand Hi-Lai Hotel. 31. Howard Plaza Hotel Kaohsiung. 32. The Splendor Kaohsiung. 33. Park Hotel. 34. Hotel National. 35. Plaza International Hotel. 36. Evergreen Laurel Hotel. 37. Howard Plaza Hotel Taichung. 38. The Splendor Taichung. 40. Marshal Hotel. 41. Chinatrust Hotel Hualien. 42. Parkview Hotel. 44. Hotel Landis China Yangmingshan. 45. The Grand Hotel Kaohsiung. 46. Caesar Park Hotel Kending. 47. Hotel Royal Chihpen Spa. 48. Grand Formosa Hotel. 49. Howard Beach Resort Kending. 50. The Hibiscus Resorts. 52. Taoyuan Holiday Hotel. 53. Hotel Tainan. 54. Ta Shee Resort Hotel. 55. Hotel Royal Hsinchu. 56. The Ambassador Hotel Hsinchu. 57. Formosan Naruwan Hotel. 58. Tayih Landis Tainan Hotel. 0.9186 0.9087 0.9374 0.7848 0.9491 0.9038 0.9196 0.9455 0.9626 0.8931 0.8875 0.9476 0.9212 0.8492 0.8605 0.8764 0.9387 0.8477 0.9249 0.7076 0.8765 0.9153 0.9483 0.9583 0.9562 0.7540 0.9149.
(40) Table 12. The efficiency scores of international tourist hotels in Taiwan (2003) ID. Hotel. Cost. ID. Hotel. efficiency 1. The Grand Hotel. 2. The Ambassador Hotel. 3. Mandarina Crown Hotel. 4. Imperial Taipei. 5. Gloria Prince Hotel. 6. Emperor Hotel. 7. Hotel Riverview Taipei. 8. Caesar Park Taipei. 9. Golden China Hotel. 10. San Want Hotel. 11. Brother Hotel. 12. Santos Hotel. 13. The Ritz Landis Hotel. 14. United Hotel. 15. Sheraton Taipei Hotel. 16. Taipei Fortuna Hotel. 17. Holiday Inn Asiaworld Taipei. 18. Hotel Royal Taipei. 19. Howard Plaza Hotel. 20. Rebar Crowne Plaza Taipei. 21. Grand Hyatt Taipei. 22. Grand Formosa Regent Taipei. 23. The Sherwood Hotel Taipei. 24. Far Eastern Plaza Hotel Taipei. 25. The Westin Hotel. 26. Hotel Kingdom. 27. Holiday Garden Kaohsiung. 28. The Ambassador Hotel Kaohsiung Mean efficiency Highest efficiency Lowest efficiency Median efficiency Standard deviation. Cost efficiency. 0.8794 0.9559 0.9373 0.9208 0.9642 0.9445 0.9551 0.9725 0.9675 0.9501 0.9432 0.9122 0.9446 0.9656 0.7560 0.9066 0.7665 0.9720 0.9044 0.8638 0.8704 0.9737 0.9666 0.9415 0.9664 0.9084 0.9010 0.9071 0.9209 0.9748 0.7077 0.9424 0.0557. 33. 29. Han-Hsien international Hotel. 30. Grand Hi-Lai Hotel. 31. Howard Plaza Hotel Kaohsiung. 32. The Splendor Kaohsiung. 34. Hotel National. 35. Plaza International Hotel. 37. Howard Plaza Hotel Taichung. 38. The Splendor Taichung. 40. Marshal Hotel. 41. Chinatrust Hotel Hualien. 42. Parkview Hotel. 43. Taroko. 44. Hotel Landis China Yangmingshan. 45. The Grand Hotel Kaohsiung. 46. Caesar Park Hotel Kending. 47. Hotel Royal Chihpen Spa. 48. Grand Formosa Hotel. 49. Howard Beach Resort Kending. 50. The Hibiscus Resorts. 51. The Lalu Sun Moon Lake. 52. Taoyuan Holiday Hotel. 53. Hotel Tainan. 54. Ta Shee Resort Hotel. 55. Hotel Royal Hsinchu. 56. The Ambassador Hotel Hsinchu. 57. Formosan Naruwan Hotel. 58. Tayih Landis Tainan Hotel. 66. Evergreen Plaza Hotel(Tainan). 0.9100 0.9564 0.9468 0.8192 0.9669 0.9540 0.9748 0.8809 0.9280 0.9477 0.9199 0.9530 0.9731 0.9264 0.8859 0.9095 0.8366 0.9191 0.7077 0.9572 0.9208 0.9537 0.9544 0.9535 0.9541 0.8937 0.9550 0.8946.
(41) Table 13. The efficiency scores of international tourist hotels in Taiwan (2004) ID. Hotel. Cost. ID. Hotel. efficiency 1. The Grand Hotel. 2. The Ambassador Hotel. 3. Mandarina Crown Hotel. 4. Imperial Taipei. 5. Gloria Prince Hotel. 6. Emperor Hotel. 7. Hotel Riverview Taipei. 8. Caesar Park Taipei. 9. Golden China Hotel. 10. San Want Hotel. 11. Brother Hotel. 12. Santos Hotel. 13. The Ritz Landis Hotel. 14. United Hotel. 15. Sheraton Taipei Hotel. 16. Taipei Fortuna Hotel. 17. Holiday Inn Asiaworld Taipei. 18. Hotel Royal Taipei. 19. Howard Plaza Hotel. 20. Rebar Crowne Plaza Taipei. 21. Grand Hyatt Taipei. 22. Grand Formosa Regent Taipei. 23. The Sherwood Hotel Taipei. 24. Far Eastern Plaza Hotel Taipei. 25. The Westin Hotel. 26. Hotel Kingdom. 27. Holiday Garden Kaohsiung. 28. The Ambassador Hotel Kaohsiung. 29. Han-Hsien international Hotel Mean efficiency Highest efficiency Lowest efficiency Median efficiency Standard deviation. Cost efficiency. 0.8794 0.9559 0.9373 0.9208 0.9642 0.9445 0.9551 0.9725 0.9675 0.9501 0.9432 0.9122 0.9446 0.9656 0.7560 0.9066 0.7665 0.9720 0.9044 0.8638 0.8704 0.9737 0.9666 0.9415 0.9664 0.9084 0.9010 0.9071 0.9100 0.9208 0.9747 0.6964 0.9415 0.0562. 34. 30. Grand Hi-Lai Hotel. 31. Howard Plaza Hotel Kaohsiung. 32. The Splendor Kaohsiung. 34. Hotel National. 35. Plaza International Hotel. 36. Evergreen Laurel Hotel. 37. Howard Plaza Hotel Taichung. 38. The Splendor Taichung. 40. Marshal Hotel. 41. Chinatrust Hotel Hualien. 42. Parkview Hotel. 43. Taroko. 44. Hotel Landis China Yangmingshan. 45. The Grand Hotel Kaohsiung. 46. Caesar Park Hotel Kending. 47. Hotel Royal Chihpen Spa. 48. Grand Formosa Hotel. 49. Howard Beach Resort Kending. 50. The Hibiscus Resorts. 51. The Lalu Sun Moon Lake. 52. Taoyuan Holiday Hotel. 53. Hotel Tainan. 54. Ta Shee Resort Hotel. 55. Hotel Royal Hsinchu. 56. The Ambassador Hotel Hsinchu. 57. Formosan Naruwan Hotel. 58. Tayih Landis Tainan Hotel. 66. Evergreen Plaza Hotel(Tainan). 0.9564 0.9468 0.8192 0.9374 0.9647 0.9573 0.9747 0.8708 0.9280 0.9516 0.9125 0.9525 0.9715 0.9120 0.8980 0.9111 0.8421 0.9142 0.6964 0.9609 0.9309 0.9508 0.9599 0.9530 0.9542 0.8807 0.9571 0.8944.
(42) Table 14. The efficiency scores of international tourist hotels in Taiwan (2005) No.. Hotel. Cost. No.. Hotel. efficiency 1. The Grand Hotel. 2. The Ambassador Hotel. 4. Imperial Taipei. 5. Gloria Prince Hotel. 6. Emperor Hotel. 7. Hotel Riverview Taipei. 8. Caesar Park Taipei. 9. Golden China Hotel. 10. San Want Hotel. 11. Brother Hotel. 12. Santos Hotel. 13. The Ritz Landis Hotel. 14. United Hotel. 15. Sheraton Taipei Hotel. 16. Taipei Fortuna Hotel. 17. Holiday Inn Asiaworld Taipei. 18. Hotel Royal Taipei. 19. Howard Plaza Hotel. 20. Rebar Crowne Plaza Taipei. 21. Grand Hyatt Taipei. 22. Grand Formosa Regent Taipei. 23. The Sherwood Hotel Taipei. 24. Far Eastern Plaza Hotel Taipei. 25. The Westin Hotel. 26. Hotel Kingdom. 27. Holiday Garden Kaohsiung. 28. The Ambassador Hotel Kaohsiung. 29. Han-Hsien international Hotel Mean efficiency Highest efficiency Lowest efficiency Median efficiency Standard deviation. Cost efficiency. 0.9090 0.9591 0.9445 0.9342 0.9465 0.9606 0.9759 0.9668 0.9314 0.9448 0.8726 0.9533 0.9696 0.8979 0.9395 0.7819 0.9715 0.9057 0.8752 0.8734 0.9730 0.9601 0.9599 0.9665 0.9210 0.9471 0.9265 0.8745 0.9294 0.9765 0.6878 0.9447 0.0498. 35. 30. Grand Hi-Lai Hotel. 31. Howard Plaza Hotel Kaohsiung. 32. The Splendor Kaohsiung. 34. Hotel National. 35. Plaza International Hotel. 36. Evergreen Laurel Hotel. 37. Howard Plaza Hotel Taichung. 38. The Splendor Taichung. 40. Marshal Hotel. 41. Chinatrust Hotel Hualien. 42. Parkview Hotel. 43. Taroko. 44. Hotel Landis China Yangmingshan. 45. The Grand Hotel Kaohsiung. 46. Caesar Park Hotel Kending. 47. Hotel Royal Chihpen Spa. 48. Grand Formosa Hotel. 49. Howard Beach Resort Kending. 50. The Hibiscus Resorts. 51. The Lalu Sun Moon Lake. 52. Taoyuan Holiday Hotel. 53. Hotel Tainan. 54. Ta Shee Resort Hotel. 55. Hotel Royal Hsinchu. 56. The Ambassador Hotel Hsinchu. 57. Formosan Naruwan Hotel. 58. Tayih Landis Tainan Hotel. 66. Evergreen Plaza Hotel(Tainan). 0.9414 0.9515 0.8428 0.9675 0.9664 0.9627 0.9765 0.9332 0.9514 0.9534 0.9096 0.9476 0.9475 0.9368 0.9175 0.9145 0.8996 0.9125 0.6878 0.8754 0.9570 0.9256 0.9661 0.9606 0.9602 0.9408 0.9586 0.9387.
(43) Table 15. The efficiency scores of international tourist hotels in Taiwan (2006) ID. Hotel. Cost. ID. Hotel. efficiency 1. The Grand Hotel. 2. The Ambassador Hotel. 4. Imperial Taipei. 5. Gloria Prince Hotel. 6. Emperor Hotel. 7. Hotel Riverview Taipei. 8. Caesar Park Taipei. 9. Golden China Hotel. 10. San Want Hotel. 11. Brother Hotel. 12. Santos Hotel. 13. The Ritz Landis Hotel. 14. United Hotel. 15. Sheraton Taipei Hotel. 16. Taipei Fortuna Hotel. 18. Hotel Royal Taipei. 19. Howard Plaza Hotel. 20. Rebar Crowne Plaza Taipei. 21. Grand Hyatt Taipei. 22. Grand Formosa Regent Taipei. 23. The Sherwood Hotel Taipei. 24. Far Eastern Plaza Hotel Taipei. 25. The Westin Hotel. 26. Hotel Kingdom. 27. Holiday Garden Kaohsiung. 28. The Ambassador Hotel Kaohsiung. 29. Han-Hsien international Hotel. 30. Grand Hi-Lai Hotel. 31. Howard Plaza Hotel Kaohsiung Mean efficiency Highest efficiency Lowest efficiency Median efficiency Standard deviation. Cost efficiency. 0.9316 0.9691 0.9447 0.9120 0.9559 0.9700 0.9798 0.9675 0.9619 0.9488 0.9562 0.9617 0.9684 0.9439 0.9373 0.9782 0.9193 0.9146 0.9027 0.9653 0.9658 0.9633 0.9749 0.9343 0.9585 0.9354 0.8986 0.9647 0.9578 0.9466 0.9798 0.8606 0.9562 0.0272. 36. 32. The Splendor Kaohsiung. 34. Hotel National. 35. Plaza International Hotel. 36. Evergreen Laurel Hotel. 37. Howard Plaza Hotel Taichung. 38. The Splendor Taichung. 39. Hotel Royal Chiao-His. 40. Marshal Hotel. 41. Chinatrust Hotel Hualien. 42. Parkview Hotel. 43. Taroko. 44. Hotel Landis China Yangmingshan. 45. The Grand Hotel Kaohsiung. 46. Caesar Park Hotel Kending. 47. Hotel Royal Chihpen Spa. 48. Grand Formosa Hotel. 49. Howard Beach Resort Kending. 50. The Hibiscus Resorts. 51. The Lalu Sun Moon Lake. 52. Taoyuan Holiday Hotel. 53. Hotel Tainan. 54. Ta Shee Resort Hotel. 55. Hotel Royal Hsinchu. 56. The Ambassador Hotel Hsinchu. 57. Formosan Naruwan Hotel. 58. Tayih Landis Tainan Hotel. 62. Royal Less Hotel. 66. Evergreen Plaza Hotel(Tainan). 0.8696 0.9639 0.9656 0.9683 0.9777 0.9176 0.9779 0.9500 0.9569 0.9294 0.9403 0.8863 0.9591 0.9289 0.9204 0.9146 0.9327 0.8606 0.9682 0.9558 0.9687 0.9528 0.9694 0.9658 0.9368 0.9635 0.9678 0.9468.
(44) Table 16 shows a summary of the mean efficiency scores of 1997-2006. From Table 16, we can draw a tendency figure such as Figure 2. The figure indicates that the average cost efficiency scores are relatively stable from 1998 to 2000 and then grow higher from 2004 to 2006. In 2001, there is a dip in the average cost efficiency score. This may be explained by the 9/11 attacks that occurred in the United States in 2001. These deadly terrorist attacks created a sluggish market not only in the international aviation industry but also in the global tourism and hotel industry.. In later years. (2002 to 2006), the efficiency scores returned to the normal growth trend. The growth rate is a value of 1.85% for hotel cost efficiency in 2006.. Furthermore, the. international tourist hotel business can be expected to have an increase in efficiency in the future. Table 16. The yearly cost efficiency scores in Taiwan international hotels Year. Efficiency scores. 1997 1998 1999 2000 2001 2002 2003 2004 2005 2006. 0.8947 0.9074 0.9079 0.9058 0.8915 0.9062 0.9209 0.9208 0.9294 0.9466. 37.
(45) efficiency scores. 0.96 0.94 0.92 0.9. The 9/11 attacks. 0.88 0.86. 1997 1998 1999 2000 2001 2002 2003 2004 2005 2006. years Figure 2. The yearly cost efficiency scores for international hotels Table 17 is the cost efficiency for six areas of international hotels in Taiwan from 1997 to 2006. Figure 3 is the average cost efficiency for six areas in Taiwan over ten years. The highest average cost efficiency is for other international hotel with a value of 0.9356 while the lowest average cost efficiency is for non-metropolitan international hotel with a value of 0.8779. Table 17. The cost efficiency scores of international hotels in six areas Year 1997. 1998. 1999. 2000. 2001. 2002. 2003. 2004. 2005. 2006. Taipei. 0.8841. 0.9074. 0.9112. 0.9274. 0.9171. 0.9250. 0.9240. 0.9240. 0.9322. 0.9519. Kaohsiung. 0.8917. 0.8981. 0.8977. 0.8638. 0.8598. 0.8682. 0.9070. 0.9070. 0.9150. 0.9358. Taichung. 0.9205. 0.8851. 0.9030. 0.9338. 0.8872. 0.9289. 0.9441. 0.9410. 0.9613. 0.9586. Hualien. 0.9374. 0.9310. 0.9199. 0.9108. 0.9032. 0.9187. 0.9372. 0.9361. 0.9405. 0.9441. 0.8743. 0.9095. 0.9033. 0.8216. 0.8206. 0.8579. 0.8894. 0.8883. 0.8864. 0.9276. 0.9530. 0.9451. 0.9102. 0.9488. 0.9172. 0.9034. 0.9350. 0.9351. 0.9509. 0.9574. Nonmetropolitan Other. 38.
(46) 0.9356 0.9264. 0.9204. 0.9279. 0.8944. th er O. an lit. N. on. -m et ro po. ua lie n H. Ta ich un g. K. ao hs iu ng. 0.8779. Ta ip ei. Average cost efficiency. 0.9400 0.9300 0.9200 0.9100 0.9000 0.8900 0.8800 0.8700 0.8600 0.8500 0.8400. Area Figure 3. The international hotel’s average cost efficiency in six areas Table 18 is the statistics of tourist guides in Taiwan from 1997 to 2006 and Figure 4 is the tendency figure of tourist guides during those ten years. That set of data is one of the environmental variables used in this study.. Table 18. The number of tourist guides Year 1997 1998 1999 2000 2001 2002 2003 2004 2005 2006. Number of tourist guides 2206 2256 2312 2360 2723 2925 2925 3058 5113 6750. 39.
(47) 19 98 19 99 20 00 20 01 20 02 20 03 20 04 20 05 20 06. 4000 3000 2000 1000 0. 19 97. Number of tourist guides. 8000 7000 6000 5000. Year. Figure 4. The tendency for number of tourist guides in 1997-2006. 40.
(48) 7. Conclusions Facing strong competition in the global hotel industry, the cost efficiency of international hotels plays an important role in determining the profitability of international hotels and even their survival. While the focus of the past literatures is on internal management and different business models in the hotels, this thesis is about hotel cost efficiency analysis.. It is based on an econometrics frontier model that. permits the incorporation of multiple inputs in terms of various prices and multiple outputs in terms of various revenues while determining the relative efficiency. The external environmental variables are considered, and the time-varying cost efficiency for panel data is analyzed. By applying the approach proposed by Battese and Coelli (1995), this thesis simultaneously estimates the cost efficiencies and factors of inefficiency of 66 international tourist hotels in Taiwan from 1997 to 2006. The factors of technical inefficiency and the reasons for the well performing international tourist hotels are also analyzed. The study has the following major findings: •. On the whole, the average cost efficiency of Taiwan’s international tourist hotels from 1997 to 2006 is 91.15%, which implies that those hotels can reduce their input costs by 8.85%. Moreover, the market is generally competitive.. •. The contributions of cost efficiency in the hotel industry are significantly dependent on environmental variables. The empirical results reveal that the efficiency of chain hotels is higher than that of independent hotels, which means that the chain hotel systems can be a significant positive impact on average efficiency in the international tourist hotels in Taiwan. The fact of the existence of a large number of tourist guides, as published by the Tourism Bureau, makes the tourism market much more competitive. Therefore, the number of tourist guides is a significant factor influencing international tourist 41.
(49) hotel efficiency.. In addition, the international tourist hotels closer to. international transportation, such as international airports, are more cost efficient than those farther away, revealing that international transportation has a significant impact on the average efficiency.. Except for the variable. about hotels located in non-metropolitan areas, all the other environmental variables are significant at 1% level and can reduce cost inefficiency. •. The international tourist hotels have been ranked in this study based on their cost efficiencies. The ranking permits inefficient hotels not only to ponder about their positions in the ranking list but also to develop strategies to improve their efficiency in the future. The highest performing international tourist hotels are identified and constitute reference points for the less efficient hotels.. 42.
數據

+7


相關文件
(A)Full service upscale hotel (B)Limited service hotel (C)Economy hotel (D)All suite hotel
Direct taxes: salary tax, increase in tourist expenses would result in an increase in income of people working in the tourism industry. Indirect taxes, departure tax and hotel
When providing accommodation for business travellers to stay during the MICE event, the hotel needs to provide the following services for the delegates or attendees, the
Since huge quantities of transactions are involved in daily operations of a hotel, the accounting department always has to deal with complicated calculations which undoubtedly
• When providing accommodation for business travellers to stay during the MICE event, the hotel needs to provide the following services for the delegates or attendees, the.
When ready to eat a bite of your bread, place the spoon on the When ready to eat a bite of your bread, place the spoon on the under plate, then use the same hand to take the
This study integrates consumption emotions into the American Customer Satisfaction Index (ACSI) model to propose a hotel customer satisfaction index (H-CSI) model that can be
This research project tries to examine the issues of domestic green hotel service design, integrating QFD and VAHP, as well as to construct green criteria and their
