行政院國家科學委員會補助專題研究計畫成果報告
※※※※※※※※※※※※※※※※※※※※※※※※※
※ ※
※ 混凝土內部裂縫顯像法之研究 ※
※
Imaging of Concrete Internal Cracks
※
※ ※
※※※※※※※※※※※※※※※※※※※※※※※※※
計畫類別:個別型計畫 □整合型計畫
計畫編號:NSC 90 – 2211 – E – 002 – 032
執行期間:90 年 8 月 11 日至 91 年 7 月 31 日
計畫主持人:劉佩玲
共同主持人:吳政忠
計畫參與人員:葉柏涼、林君翰
本成果報告包括以下應繳交之附件:
□赴國外出差或研習心得報告一份
□赴大陸地區出差或研習心得報告一份
□出席國際學術會議心得報告及發表之論文各一份
□國際合作研究計畫國外研究報告書一份
執行單位:國立台灣大學應用力學研究所
中 華 民 國 91 年 10 月 30 日
行政院國家科學委員會專題研究計畫成果報告
混凝土內部裂縫顯像法之研究
Imaging of Concrete Internal Cracks
計畫編號:NSC 90-2211-E-002-032
執行期限:90 年 8 月 11 日至 91 年 7 月 31 日
主持人:劉佩玲 國立台灣大學應力所
共同主持人:吳政忠 國立台灣大學應力所
計畫參與者:葉柏涼、林君翰 國立台灣大學應力所
中文摘要 本研究之主旨在發展混凝土結構內部 缺陷的非破壞檢測方法。首先在混凝土結 構表面以暫態彈性波試驗進行掃瞄,再以 量測之時間域或頻率域訊號進行影像處 理,以建構內部缺陷之影像圖。由影像圖 中可清楚找出內部缺陷位置及上部輪廓。 本研究並以模型試驗與現場試驗驗證其可 行性。 關鍵詞:混凝土、裂縫、缺陷、彈性波、 影像法 ABSTRACTThis study develops imaging techniques for the detection of internal defects in concrete structures. The transient elastic wave tests are conducted on the surface of the target structure. Then, either time domain or frequency domain signals are used to construct the image of the internal defect. The images can be used not only to determine the location of the internal defect but also the shape of the defect. Model tests and in-situ tests are presented to verify the effectiveness of these methods.
Keywords: concrete, crack, defect, elastic
waves, imaging
INTRODUCTION
Reinforced concrete is the most
commonly used construction material
nowadays. Since the tensile strength of concrete is only about 10% of its
compressive strength, cracks and voids often present in concrete. The existence of such flaw may decrease the strength of the structure, and failure of the structure may follow. Therefore, the detection of cracks in reinforced concrete is indispensable in the safety assessment of reinforced concrete structures.
Recently, stress waves have been widely used to detect surface opening cracks in concrete. Sakata and Ohtsu [1] applied ultrasonic spectroscopy to evaluate vertical cracks. Chang and Wang [2] used ultrasonic waves to scan surface opening cracks. In
addition to ultrasonic waves, many
researchers have adopted transient elastic wave tests in the detection of cracks in concrete. Lin and Sansalone [3] used the impact echo method to detect flaws in concrete beams and columns. Wu et al. [4] developed an inverse method to detect the depth of vertical cracks based on phase information. Lin and Su [5] and Lin et al. [6] applied the impact echo method to measure the depth of cracks in reinforced concrete. Liu et al. [7] proposed a migration imaging method that can depict the location of a surface-opening crack on a test section. The migration method was extended to construct the 3D image of a surface-opening crack [8]. Kuo et al. [9] applied optimization techniques to locate the crack tip. Ohtsu and Watanabe [10] developed the stack imaging method for flaw detection based on impact echo data.
In this study, methods for constructing images of the interior defects of concrete
structures are developed. Transient elastic wave tests are adopted in these methods. Either time-domain or frequency-domain data are processed to display the image. The images can be used to determine the location of the internal defect.
MIGRATION METHOD
The principal investigator has applied the migration method to construct the image of a surface-opening crack [7, 8]. The principles of migration are as follows: Consider a signal that is emitted from the source, diffracted at a point, and arrives at the receiver. Suppose the travel time of the diffracted signal is t, and the wave velocity is
v. Then, the travel distance of the signal is vt.
If the diffraction path is unknown, any point in the medium with the same travel distance is a possible diffraction point. Therefore, the diffraction point should fall on an ellipse with the source and receiver as its foci, as shown in Fig. 1. If two ellipses are drawn
using different diffracted signals, the
diffracted point must be located at the intersection of the two ellipses.
ellipse 1 ellipse 2 receiver 1 receiver 2
source 1 source 2
y
x
Fig. 1 Principles of migration
To construct the migration image, an ellipse is constructed for each of the data points on the response curve according to the travel distance. Since the amplitude of the data points varies, the elliptic trajectories are of different magnitudes. Representing the magnitude by grayscale, we get a grayscale image. Since there is a visible change in the response curve when the first diffracted signal arrives, the ellipse of the first diffraction can be located on the image. If more than one response curve are migrated, the crack tip is simply located at the common
intersection of the ellipses of the first arrivals.
IMAGING OF INTERNAL DEFECTS USING TIME DOMAIN SIGNALS
In the detection of surface-opening cracks, the surface waves cannot propagate across a surface-opening crack. Therefore, if the source and receiver are placed on the opposite sides of the crack opening, the received signal does not contain surface waves. This is advantageous because surface waves do not contain any information about the defect. Furthermore, the useful reflected or diffracted waves will not be submerged in the surface wave.
Unfortunately, the surface wave is unavoidable in the case of internal defects. Therefore, it is very difficult to construct an image using merely two records. To overcome the difficulties, the migration imaging method can be adopted here.
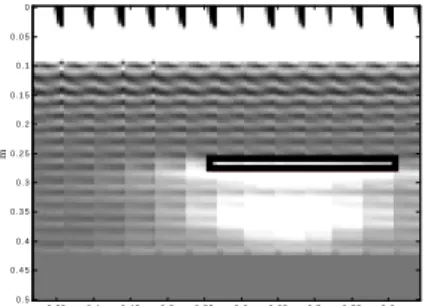
We first construct a series of migration images of the model using three consecutive traces for each image. Since the influence of the crack is the strongest when the source and receiver are on top of it, we take a slice of image right under the source and receiver from each of the successive images. Then, assemble the slices according to their original orders. Figure 2 shows the assembled image of the crack. There is a bright zone on top of the image. This comes from the Rayleigh wave. There is another bright zone on the image. Compared with the true crack location, the zone reveals the width and depth of the crack. Apparently, the image provides direct information on where and how large the defect is.
Fig. 2 Assembled image of an internal
m m 0 . 3 5 0 .4 0 . 4 5 0 . 5 0 . 5 5 0 . 6 0 . 6 5 0 . 7 0 .7 5 0 . 8 0 0 .0 5 0 . 1 0 .1 5 0 . 2 0 .2 5 0 . 3 0 .3 5 0 . 4 0 .4 5 0 . 5
One should notice that the thickness of the bright zone is not equal to the thickness of the defect. This is because almost all energy is reflected when a wave encounters a crack. No wave is reflected from the bottom of the crack. Therefore, it is impossible to construct an image of the bottom of an internal crack.
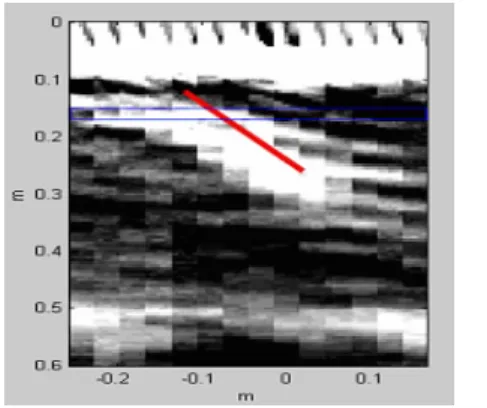
Figure 3 shows the assembled image obtained in a model test. Similar to the numerical results, there is a Rayleigh bright zone. The 45 crack is also depicted in the image. In addition to these bright zones, there is a horizontal bright band located at 50cm under the surface. This apparently denotes the bottom of the concrete.
Fig. 3 Assembled image of the 45
model crack model crack
IMAGING OF INTERNAL DEFECTS USING SPECTRAL SIGNALS
The impact echo method [3] is a well established NDT method on concrete structures. In this method, elastic wave tests are also performed on the concrete. Then, the time signals are transformed into the frequency domain using the fast Fourier transform. If there is an internal crack or void, one should find a peak in the spectrum. The
frequency of the peak f can be related to d
the depth of the defect, D, by the following formula: d p f C D 2 (1) (1)
where Cp is the velocity of longitudinal
waves of the concrete.
The impact echo method is very effective when it is applied to plain concrete. However,if the concrete is heavily reinforced, the spectrum becomes very complicated. In that case, it is difficult to detect an internal defect by examining a single spectrum. One possible solution is to put the spectra of all tests together. Then, try to compare the pattern of these spectra to see if any spectrum deviates from the regular pattern.
If the test area is large and there are many test points, such comparison is time consuming. In order to speed up the process, one may construct a “C-scan” image using the impact echo spectra. Similar to the ultrasonic C-scan, the impact echo tests are performed on an area on the concrete surface. After completing the tests, perform fast Fourier transform on the data. Then, select the depth of the horizontal section to be inspected, and determine the corresponding frequency using Eq. (1). For each point in the test area, represent the spectral amplitude by color scale. Finally, construct a spectral image for the horizontal section.
Theoretically, the color of the whole section should be homogeneous if no defect exists. However, if the section does contain a defect, there will be peaks in the spectra. Hence, the color of the defect zone should be different. One can determine if there is a defect simply by examining the color variation of the image. Apparently, the spectral C-scan image is a much better presentation of the defect than the spectral B-scan image, in which the color varies with depth.
Because of concrete inhomogeneity, noise, and numerical errors, the spectrum may fluctuate rapidly. Hence, the color of two neighboring pixels may be quite different even when the test points are above the same horizontal crack. As a result, the spectral C-scan image does not always show a clear picture of the defect. To improve its quality, one can stack the images in a selected frequency range (or depth range) together. This will help smoothing out the image. Alternatively, one can use the maximum color scale of each pixel in the frequency (depth) range to construct the image.
Figure 4 shows the spectral C-scan image (maximum image) of a concrete plate in a power plant. The inspection depth is 12cm~15cm. It is seen that there may be defects near the upper right corner and lower left corners of the test area. In order to verify the result, cores were taken from the plate near the defect zones. It was found that there are indeed horizontal cracks in these areas. Since the plate is 2.4m thick and is embedded with 7 layers of reinforcing bars, it would be extremely difficult to detect the cracks if other methods were adopted.
Fig. 4 Spectral C-scan image of a concrete plate
CONCLUSIONS
This study develops two techniques to construct the image of internal defects in concrete structures using elastic wave tests. These methods are shown to be effective by model tests and in-situ tests.
The imaging method provides the most direct information on the concrete interior. After proper training, an inspector can locate the defect zone of a concrete structure simply by viewing the images. No interpretation is required. Therefore, the image method can serve as a useful tool in the nondestructive evaluation of concrete structures.
REFERENCES
[1] Sakata, Y. and Ohtsu, M. (1995)
“Crack Evaluation in Concrete
Members Based on Ultrasonic
Spectroscopy,” ACI Materials Journal,
Vol. 92, No.6, pp.686-698.
[2] Chang, Y. F. and Wang, C. Y. (1997)
“A 3-D image detection method of a surface opening crack in concrete using ultrasonic transducer arrays”, Journal
of Nondestructive Evaluation, Vol. 16
No. 4, pp. 193-203.
[3] Lin, Y. and Sansalone, M. (1992)
“Detecting Flaws in Concrete Beams and Columns Using the Impact-Echo Method,” Materials Journal of the
American Concrete Institute,
July/August, 394-405.
[4] Wu, T.-T. , Fang, J. S. and Liu, P. L.
(1995) “Detection of the depth of a surface-breaking crack using transient elastic waves,” J. Acoust. Soc. Am., Vol. 97, No. 3, pp. 1678-1686.
[5] Lin, Y. and Su, W. C. (1996) “The Use
of Stress Waves for Determining the Depth of Surface-Opening Cracks in Concrete Structures,” ACI Materials
Journal, Vol. 93, No. 5, pp. 494-505.
[6] Lin, Y., Liou, T., and Hsiao, C., (1998)
“Influences of Reinforcing Bars on Crack Depth Measurement by Stress Waves,” ACI Materials Journal, Vol. 95, No. 4, pp. 407-418.
[7] Liu, P.-L., Tsai, C.-D., and Wu, T.-T.
(1996) “Imaging of Surface-Breaking Concrete Cracks Using Transient Elastic Waves,” NDT&E International, Vol. 29, No.5, pp. 323-331.
[8] Liu, P.-L., You, Y.-C. and Wu, T.-T.
(2001) “Scan of Surface-Opening Cracks in Reinforced Concrete using transient elastic waves,” NDT & E
International, Vol. 34, No. 3, pp.
219-226,.
[9] Kuo, M. K., Lin, T. R., Liu, P. L., and
Wu, T.-T. (1998) “Locating the Crack-Tip of a Surface-Breaking Crack. Part I. Line Crack”, Ultrasonics, Vol. 36, pp. 803-811.
[10] Ohtsu, M. and Watanabe, T. (2002) “Stack imaging of spectral amplitudes
based on impact-echo for flaw
detection,” NDT&E International, Vol. 35, No. 3, pp. 189-196.
[11] Waters, K. H. (1981) Reflection
Seismology, John Wiley and Sons, New
York. 計畫成果自評 本計畫預計完成的主要工作項目如下: 1. 發展有限差分程式,模擬含內部裂縫混 凝土之波傳行為; 2. 發展內部裂縫顯像法; 3. 以數值算例及模型試驗驗證內部裂縫 顯像法之可行性。 以上工作都已順利完成,研究成果已於 第六屆遠東非破壞檢測研討會的 Plenary Lecture 中發表,並將於第二十六屆全國力 學會議上發表。本計畫發展之顯像法已實 際應用於國內電廠混凝土地版之檢測,效 果良好。